

Metabonomic strategy for the detection of metabolic effects of probiotics combined with prebiotic supplementation in weaned rats
- PMID: 35539530
- PMCID: PMC9078034
- DOI: 10.1039/c7ra12067b
Metabonomic strategy for the detection of metabolic effects of probiotics combined with prebiotic supplementation in weaned rats
Abstract
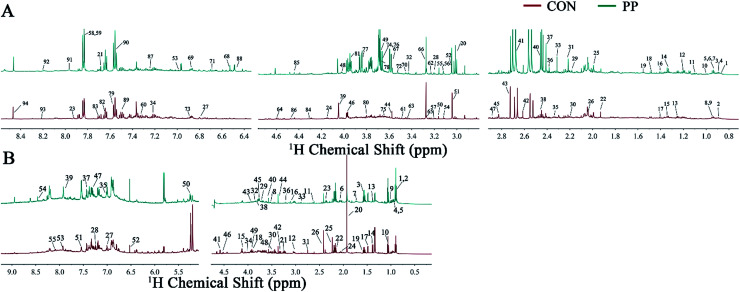
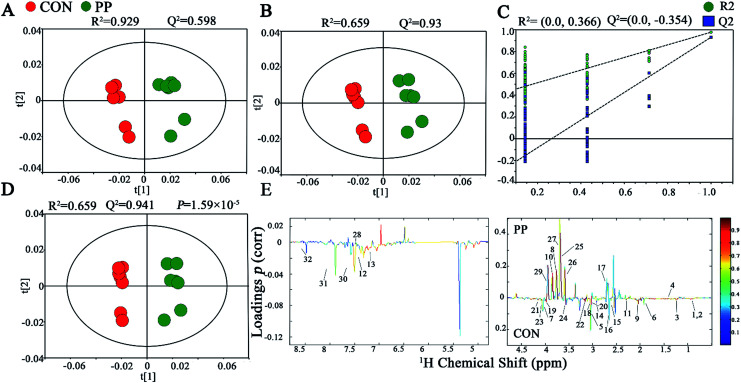
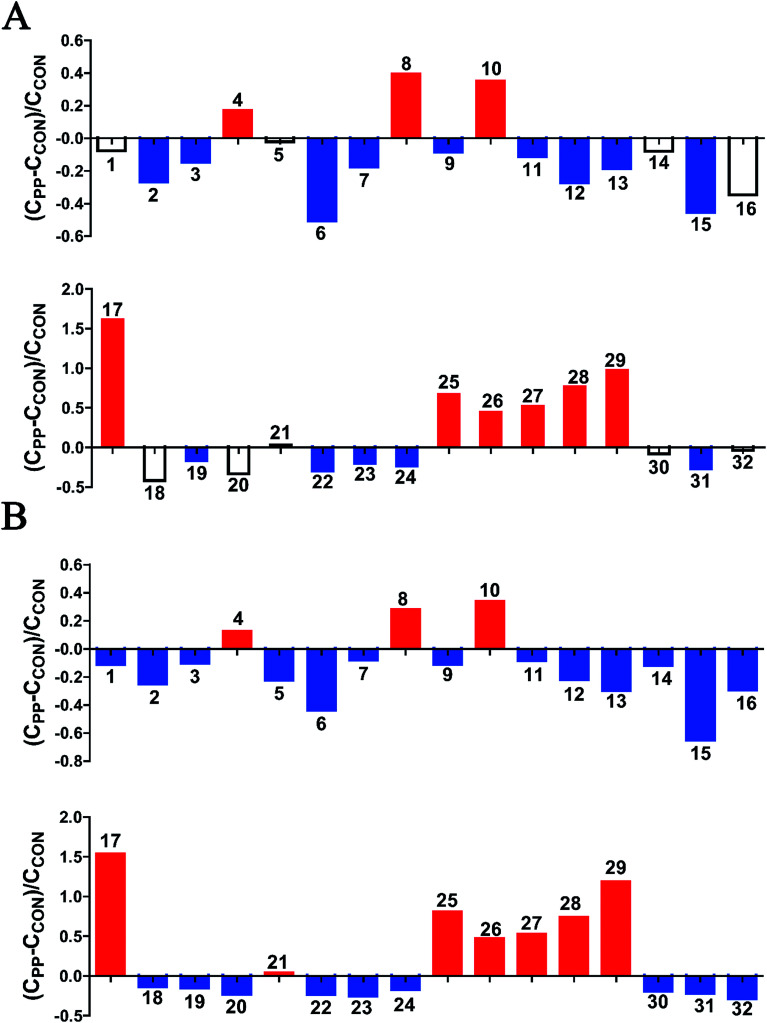
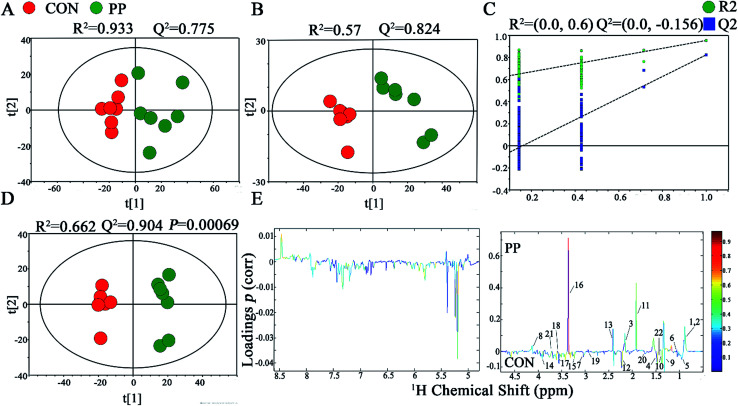
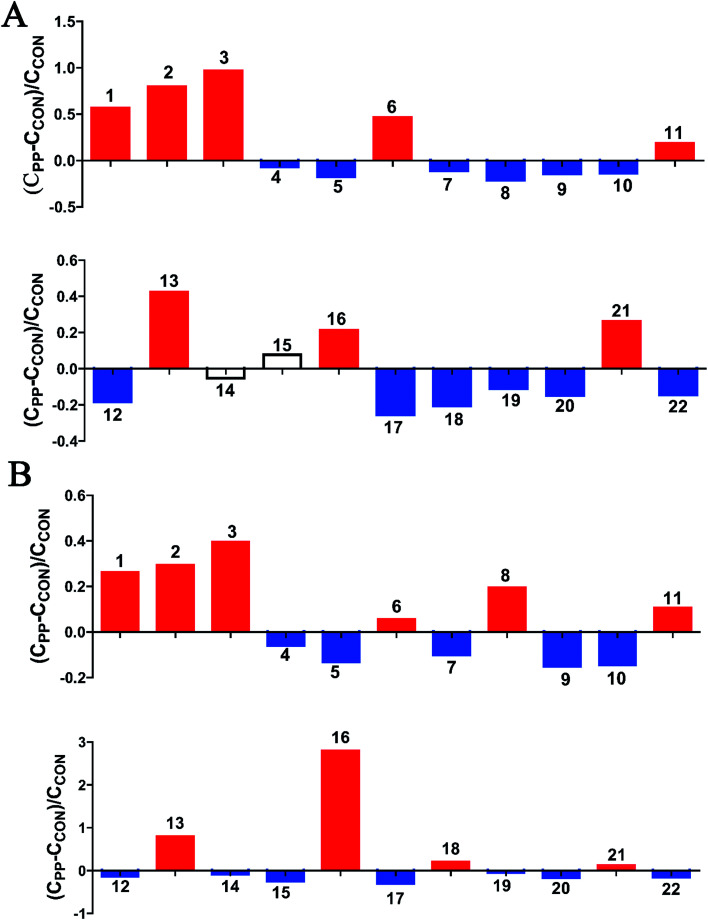
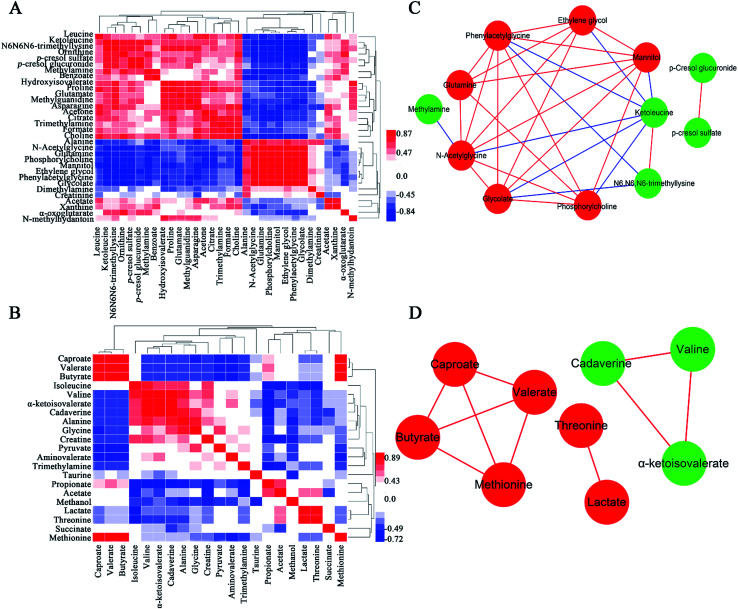
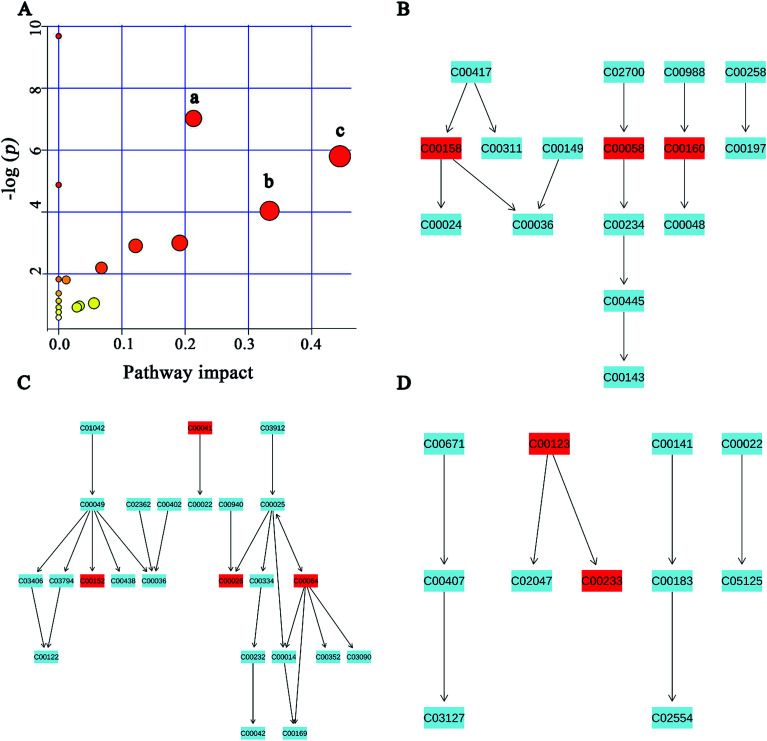
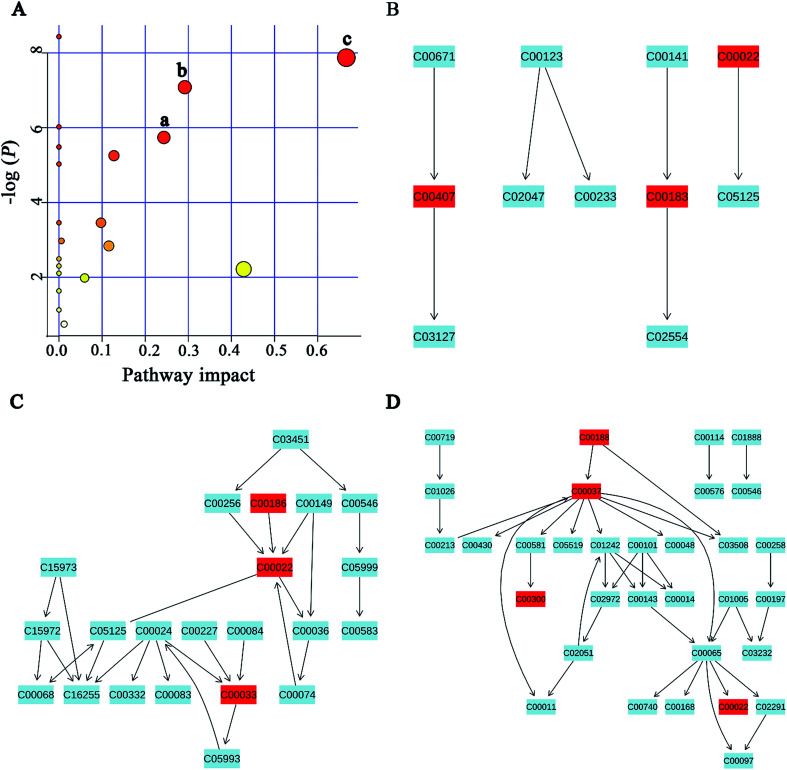
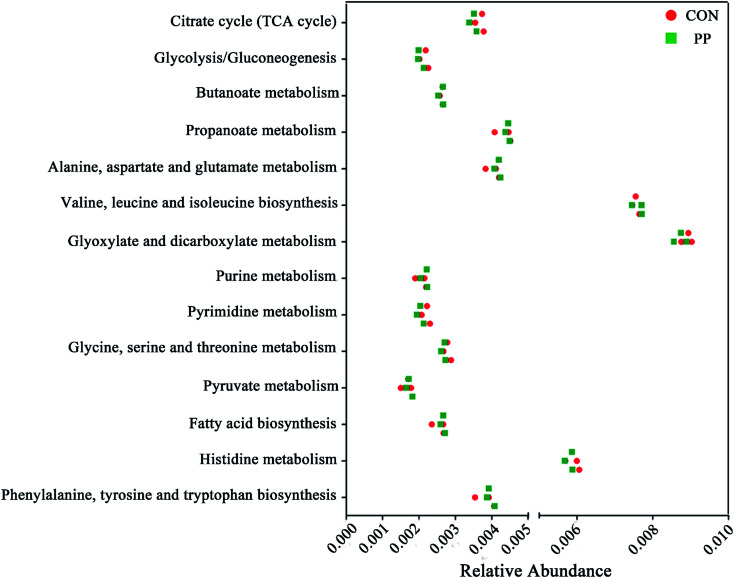
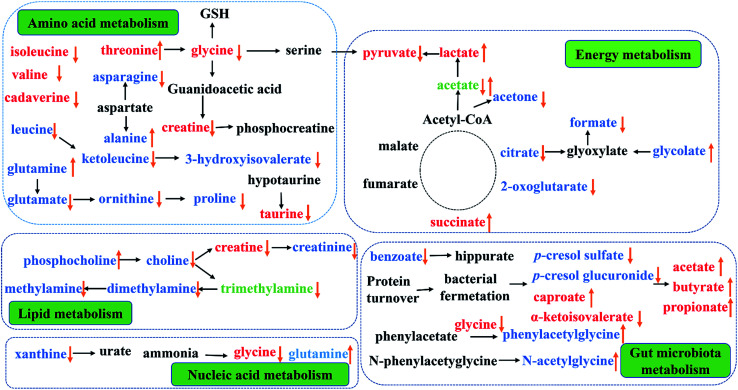
The purpose of this study is to investigate the effects of probiotics combined with prebiotics (PP) supplementation on weaned rat metabolism. A metabonomic strategy employing 1H-NMR spectroscopy and multivariate data analysis was used to examine weaned rat biological responses to PP supplementation. Male Sprague-Dawley rats (post-natal day 21, PD 21) received probiotics (Lactobacillus acidophilus NCFM (L-NCFM) and Bifidobacterium lactis Bi-07 (B-LBi07), 1 : 1, 1.0 × 10¹¹ cfu kg-1) and prebiotics (Lycium barbarum polysaccharides (LBP), Poria cocos polysaccharides (PCPs) and Lentinan, 1 : 1 : 1, 24 g kg-1) via intragastric administration for 28 consecutive days. Urine and feces were collected for analysis. Significant topographical metabolic variations were present in urine and feces. Urinary metabolites upregulated by PP treatment included alanine, N-acetylglycine, glutamine, dimethylamine, phosphorylcholine, ethylene glycol, mannitol, phenylacetylglycine and glycoate, which were related to alanine, aspartate and glutamate metabolism, and choline metabolism. Feces-derived metabolites, including caproate, valerate, butyrate, propionate, lactate, acetate, succinate, methanol, threonine and methionine, were significantly increased, which were related to short-chain fatty acid (SCFA) metabolism and TCA cycle metabolism. These results indicate that dietary PP supplementation can regulate common systemic metabolic processes, including energy metabolism, amino acid metabolism, lipid metabolism, nucleic acid metabolism, and gut microbiota-related metabolism. This study also illuminates the vital role of PP supplementation in regulating the metabolism of weaned rats.
This journal is © The Royal Society of Chemistry.
Conflict of interest statement
The authors declare no competing financial interests.
Figures
Similar articles
-
Supplementation with compound polysaccharides contributes to the development and metabolic activity of young rat intestinal microbiota.Food Funct. 2019 May 22;10(5):2658-2675. doi: 10.1039/c8fo02565g. Food Funct. 2019. PMID: 31025991
-
The effect of probiotics and polysaccharides on the gut microbiota composition and function of weaned rats.Food Funct. 2018 Mar 1;9(3):1864-1877. doi: 10.1039/c7fo01507k. Epub 2018 Mar 9. Food Funct. 2018. PMID: 29521393
-
Metabolomic strategy for the detection of metabolic effects of spermine supplementation in weaned rats.J Agric Food Chem. 2014 Sep 10;62(36):9035-42. doi: 10.1021/jf500882t. Epub 2014 Sep 2. J Agric Food Chem. 2014. PMID: 25162370
-
Lactobacillus acidophilus La5 and Bifidobacterium lactis Bb12 induce different age-related metabolic profiles revealed by 1H-NMR spectroscopy in urine and feces of mice.J Nutr. 2013 Oct;143(10):1549-57. doi: 10.3945/jn.113.177105. Epub 2013 Aug 14. J Nutr. 2013. PMID: 23946343
-
Combination of Lycium barbarum L. and Laminaria japonica polysaccharides as a highly efficient prebiotic: Optimal screening and complementary regulation of gut probiotics and their metabolites.Int J Biol Macromol. 2023 Aug 15;246:125534. doi: 10.1016/j.ijbiomac.2023.125534. Epub 2023 Jun 22. Int J Biol Macromol. 2023. PMID: 37355074
Cited by
-
A Novel Probiotic Bacillus subtilis Strain Confers Cytoprotection to Host Pig Intestinal Epithelial Cells during Enterotoxic Escherichia coli Infection.Microbiol Spectr. 2022 Aug 31;10(4):e0125721. doi: 10.1128/spectrum.01257-21. Epub 2022 Jun 23. Microbiol Spectr. 2022. PMID: 35736372 Free PMC article.
-
Effects of C5a and Receptor CD88 on Glutamate and N-Methyl-D-Aspartic Acid Receptor Expression in the Mouse Model of Optic Neuromyelitis.Comput Math Methods Med. 2022 Apr 25;2022:4997393. doi: 10.1155/2022/4997393. eCollection 2022. Comput Math Methods Med. 2022. PMID: 35509858 Free PMC article.
-
Whole genome sequencing and metabolomics analyses reveal the biosynthesis of nerol in a multi-stress-tolerant Meyerozyma guilliermondii GXDK6.Microb Cell Fact. 2021 Jan 3;20(1):4. doi: 10.1186/s12934-020-01490-2. Microb Cell Fact. 2021. PMID: 33413399 Free PMC article.
-
Lactobacillus acidophilus DDS-1 Modulates Intestinal-Specific Microbiota, Short-Chain Fatty Acid and Immunological Profiles in Aging Mice.Nutrients. 2019 Jun 7;11(6):1297. doi: 10.3390/nu11061297. Nutrients. 2019. PMID: 31181695 Free PMC article.
-
Exopolysaccharide Produced by Lactiplantibacillus plantarum-12 Alleviates Intestinal Inflammation and Colon Cancer Symptoms by Modulating the Gut Microbiome and Metabolites of C57BL/6 Mice Treated by Azoxymethane/Dextran Sulfate Sodium Salt.Foods. 2021 Dec 9;10(12):3060. doi: 10.3390/foods10123060. Foods. 2021. PMID: 34945611 Free PMC article.
References
LinkOut - more resources
Full Text Sources
Miscellaneous