. 2022 Apr 20:13:850128.
doi: 10.3389/fphar.2022.850128. eCollection 2022.

FGF9 Alleviates the Fatty Liver Phenotype by Regulating Hepatic Lipid Metabolism

Affiliations

FGF9 Alleviates the Fatty Liver Phenotype by Regulating Hepatic Lipid Metabolism

Fanrong Zhao et al. Front Pharmacol. .

Abstract

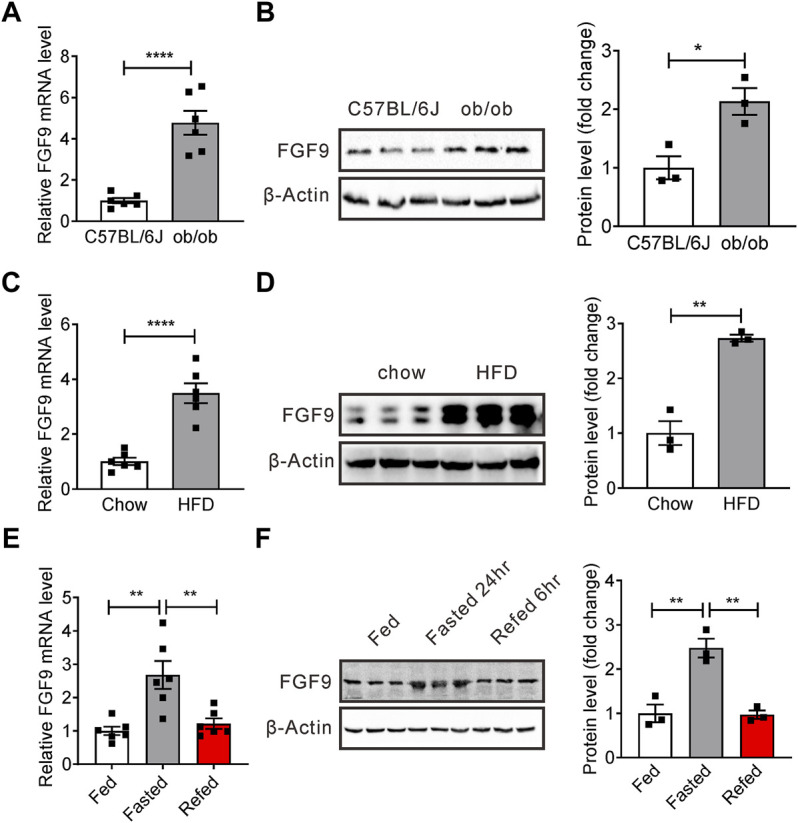
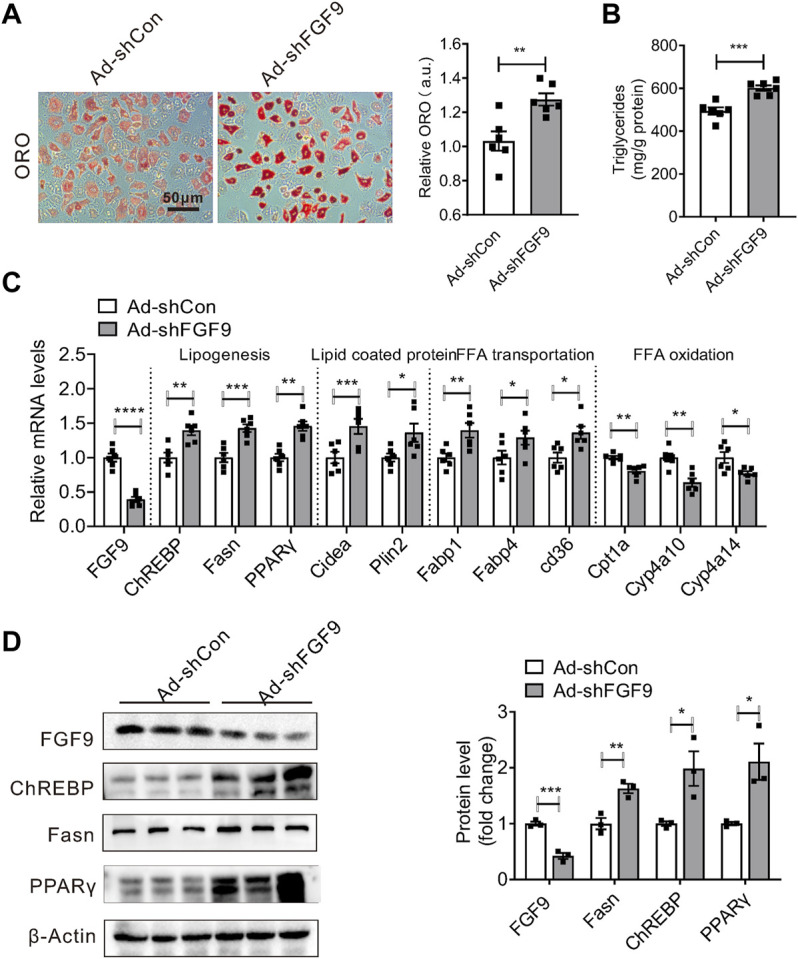
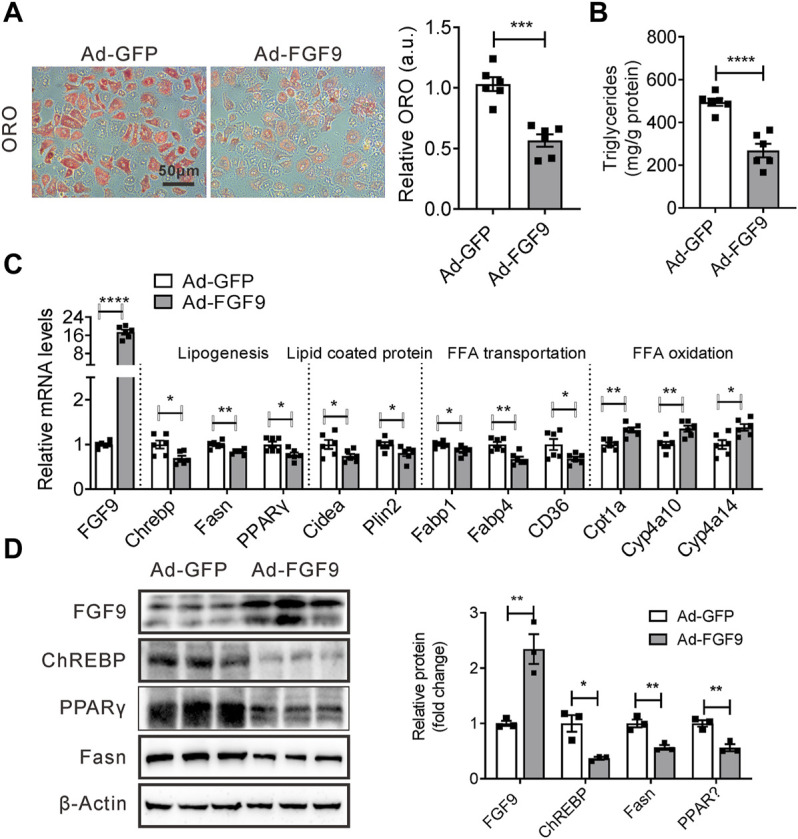
Although the fatty liver has been linked to numerous impairments of energy homeostasis, the molecular mechanism responsible for fatty liver development remains largely unknown. In the present study, we show that fibroblast growth factors 9 (FGF9) expression is increased in the liver of diet-induced obese (DIO), db/db, and ob/ob mice relative to their respective controls. The long-term knockdown of hepatic FGF9 expression mediated by adeno-associated virus expressing FGF9-specific short hairpin RNA (AAV-shFGF9) aggravated the fatty liver phenotype of DIO mice. Consistently, downregulation of FGF9 expression mediated by adenovirus expressing FGF9-specific shRNA (Ad-shFGF9) in the primary hepatocyte promoted the cellular lipid accumulation, suggesting that FGF9 exerts its effects in an autocrine manner. In contrast, adenoviruses expressing FGF9 (Ad-FGF9) mediated FGF9 overexpression in the liver of DIO mice alleviated hepatic steatosis and improved the insulin sensitivity and glucose intolerance. Moreover, the liver-specific FGF9 transgenic mice phenocopied the Ad-FGF9-infected mice. Mechanistically, FGF9 inhibited the expression of genes involved in lipogenesis and increased the expression of genes involved in fatty acid oxidation, thereby reducing cellular lipid accumulation. Thus, targeting FGF9 might be exploited to treat nonalcoholic fatty liver disease (NAFLD) and metabolic syndrome.

Keywords: FGF9; fatty acid oxidation; fatty liver; lipid synthesis; lipogenesis.


Conflict of interest statement

The authors declare that the research was conducted in the absence of any commercial or financial relationships that could be construed as a potential conflict of interest.

Figures

FIGURE 1
FIGURE 1
Expression of hepatic FGF9 is dysregulated in mice with fatty liver. (A) Quantitative PCR analysis of hepatic FGF9 in ob/ob mice (n = 6/group). (B) Representative Western blotting analysis of hepatic FGF9 in ob/ob mice. (C) Quantitative PCR analysis of hepatic FGF9 in C57BL/6J mice fed with a chow diet or high-fat diet for 3 months (DIO mice) (n = 6/group). (D) Representative Western blotting analysis of hepatic FGF9 in mice in (C). (E) Quantitative PCR analysis of hepatic FGF9 in mice under ad libitum-fed, 24 hour-fasted, or 6 hour re-fed conditions (n = 6/group). (F) Representative Western blotting analysis of hepatic FGF9 in mice in (E). All the data are presented as mean ± SEM, *p<0.05, **p<0.01, ****p < 0.0001, 2-tailed Student’s t-test (A–D), 1-way ANOVA (E,F).
FIGURE 2
FIGURE 2
Knockdown of FGF9 in the liver of DIO mice exacerbated fatty liver phenotype. (A) Ratio of liver weight to body weight in C57BL/6J mice injected with AAV-shCon or AAV-shFGF9. AAV-infected mice were then fed with a high-fat diet (HFD) for 8 weeks (n = 6/group). (B,C) Blood glucose levels during GTTs (B) and ITTs (C) performed in mice in (A) (n = 6/group). (D) Representative Western blotting analysis of phosphorylated and total AKT in the liver of mice in (A) 20 min after intraperitoneal injection of insulin (0.75 U/kg). (E) Representative H&E (top panel) and Oil Red O staining (bottom panel) of livers from mice in (A). (F) Hepatic TG levels in mice (A) (n = 6/group). (G), Quantitative PCR analysis of genes involved in lipid metabolism in the liver of mice in (A) (n = 6/group). (H) Representative Western blotting analysis of genes involved in lipid synthesis in mice as described in (A). All the data are presented as mean ± SEM, *p<0.05, **p<0.01, ***p<0.001, ****p<0.0001, 2-way ANOVA (B,C), 2-tailed Student’s t-test (A,D–H).
FIGURE 3
FIGURE 3
Knockdown of FGF9 in primary hepatocyte increased cellular TG content. (A) Representative Oil Red O staining of primary hepatocyte treatment with OA & PA for 24 h, followed by infecting with Ad-shCon or Ad-shFGF9 for 12 h prior to harvest for further analysis. (B) TG levels in primary hepatocyte in (A). (C) Quantitative PCR analysis of genes involved in lipid metabolism in primary hepatocytes in (A). (D) Representative Western blotting analysis of genes involved in lipid synthesis in primary hepatocytes in (A). All the data are represented as mean ± SEM, *p < 0.05, **p<0.01, ***p < 0.001, ****p<0.0001, 2-tailed Student’s t-test (A–D).
FIGURE 4
FIGURE 4
Overexpression of FGF9 in primary hepatocyte reduced cellular TG contents. (A) Representative Oil Red O staining of primary hepatocyte infected with Ad-GFP or Ad-FGF9 for 12 h, followed by treatment with OA & PA for 24 h prior to harvest for further analysis. (B) TG levels in primary hepatocyte in (A). (C) Quantitative PCR analysis of genes involved in lipid metabolism in primary hepatocytes in (A). (D) Representative Western blotting analysis of genes involved in lipid synthesis in primary hepatocytes in (A). All the data are represented as mean ± SEM, *p < 0.05, **p < 0.01, ***p < 0.001, ****p<0.0001, 2-tailed Student’s t-test (A–D).
FIGURE 5
FIGURE 5
Adenovirus-mediated FGF9 overexpression in the liver of DIO mice alleviated NAFLD. (A) Ratio of liver weight to body weight in DIO mice infected with Ad-GFP or Ad-FGF9 for 15 days (n = 6/group). (B,C) Blood glucose levels during GTTs and ITTs performed in (A) (n = 6/group). (D) Representative Western blotting analysis of phosphorylated and total AKT in the liver of mice in (A) 20 min after intraperitoneal injection of insulin (0.75 U/kg). (E) Representative H&E staining (top panel) and Oil Red O staining (bottom panel) of liver sections from the mice in (A). (F) Hepatic TG levels in mice in (A) (n = 6/group). (G,H) Plasma ALT and AST levels in mice in (A) (n = 6/group). (I) Quantitative PCR analysis of genes involved in lipid metabolism in the liver of mice in (A) (n = 6/group). (J) Representative Western blotting analysis of genes involved in lipid synthesis in mice in (A). All the data are represented as mean ± SEM, *p < 0.05, **p < 0.01, ***p < 0.001, 2-way ANOVA (B,C), 2-tailed Student’s t-test (A,D–J).
FIGURE 6
FIGURE 6
Liver-specific FGF9 transgene protected mice against NAFLD induced by HFD. (A) Representative Western blotting analysis of FGF9 protein levels in the liver, white adipose tissue (WAT), and muscle of FGF9 Rosa26 knockin mice (control) and liver-specific FGF9 transgenic mice (FGF9 alb-cre ). Data were normalized to β-actin. (B) Ratio of liver weight to body weight in control and FGF9 alb-cre mice fed with a HFD for 3 months (n = 6/group). (C,D) Blood glucose levels during GTTs and ITTs performed in mice in (B) (n = 6/group). (E) Representative Western blotting analysis of phosphorylated and total AKT in the liver of mice in (B) 20 min after intraperitoneal injection of insulin (0.75 U/kg). (F) Representative H&E staining and Oil Red O staining of livers from the mice in (B). (G) Hepatic TG levels in mice in B (n = 6/group). (H) Plasma ALT and AST levels in mice in (B) (n = 6/group). (I) Representative Western blotting analysis of genes involved in lipid synthesis in the liver of mice in (B). (J) Quantitative PCR analysis of genes involved in lipid metabolism in the liver of mice in B (n = 6/group). All the data are represented as mean ± SEM. *p < 0.05, **p < 0.01, ***p < 0.001, ****p<0.0001, 2-way ANOVA (C,D), 2-tailed Student’s t-test (A,B,E–J).

Similar articles

Cited by

References

    1. Badman M. K., Pissios P., Kennedy A. R., Koukos G., Flier J. S., Maratos-Flier E. (2007). Hepatic Fibroblast Growth Factor 21 Is Regulated by PPARalpha and Is a Key Mediator of Hepatic Lipid Metabolism in Ketotic States. Cell Metab 5 (6), 426–437. 10.1016/j.cmet.2007.05.002 - DOI - PubMed
    1. Beenken A., Mohammadi M. (2009). The FGF Family: Biology, Pathophysiology and Therapy. Nat. Rev. Drug Discov. 8 (3), 235–253. 10.1038/nrd2792 - DOI - PMC - PubMed
    1. Benhamed F., Denechaud P. D., Lemoine M., Robichon C., Moldes M., Bertrand-Michel J., et al. (2012). The Lipogenic Transcription Factor ChREBP Dissociates Hepatic Steatosis from Insulin Resistance in Mice and Humans. J. Clin. Invest. 122 (6), 2176–2194. 10.1172/jci41636 - DOI - PMC - PubMed
    1. Browning J. D., Horton J. D. (2004). Molecular Mediators of Hepatic Steatosis and Liver Injury. J. Clin. Invest. 114 (2), 147–152. 10.1172/jci22422 - DOI - PMC - PubMed
    1. Brunt E. M. (2010). Pathology of Nonalcoholic Fatty Liver Disease. Nat. Rev. Gastroenterol. Hepatol. 7 (4), 195–203. 10.1038/nrgastro.2010.21 - DOI - PubMed