

Interpretation of SARS-CoV-2 behaviour on different substrates and denaturation of virions using ethanol: an atomic force microscopy study
- PMID: 35517177
- PMCID: PMC9058402
- DOI: 10.1039/d0ra09083b
Interpretation of SARS-CoV-2 behaviour on different substrates and denaturation of virions using ethanol: an atomic force microscopy study
Abstract
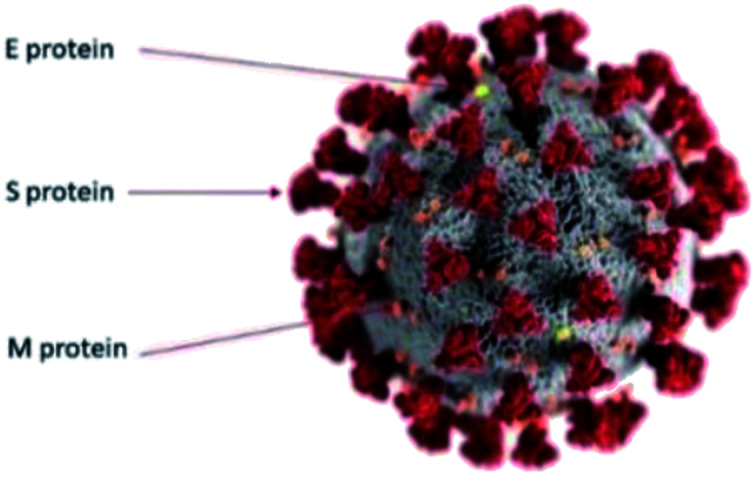
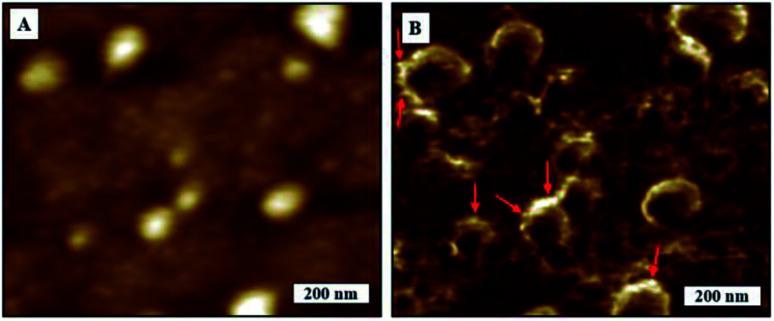
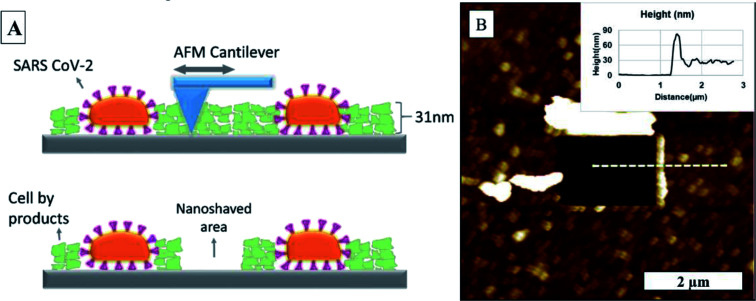
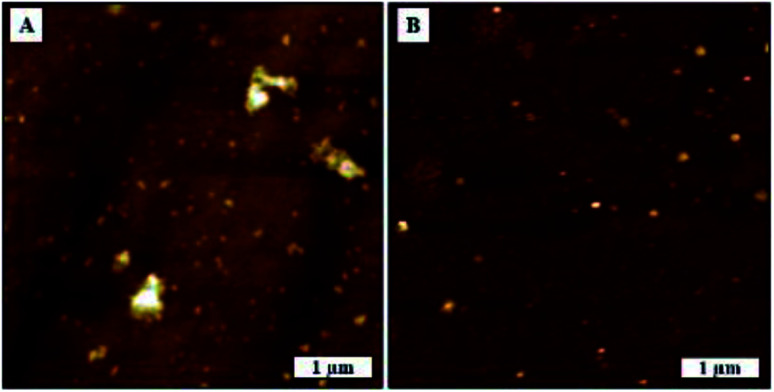
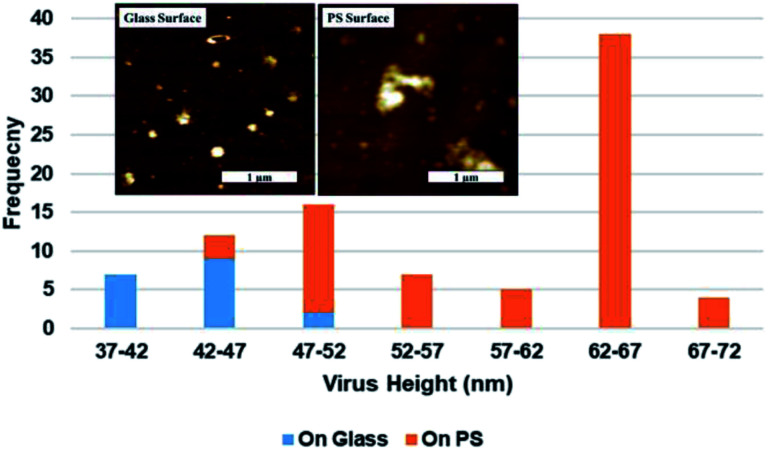
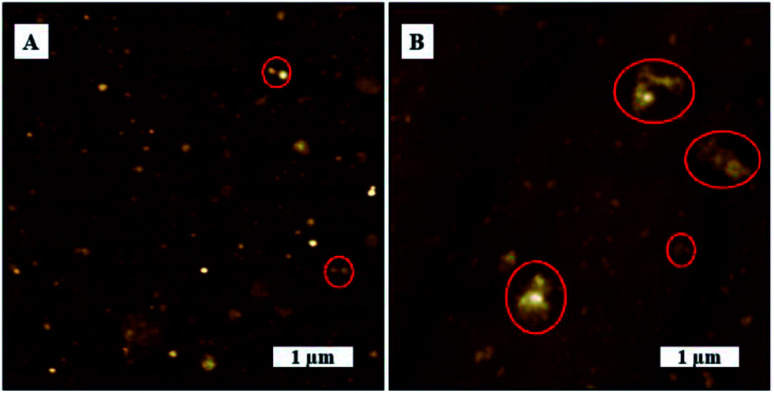
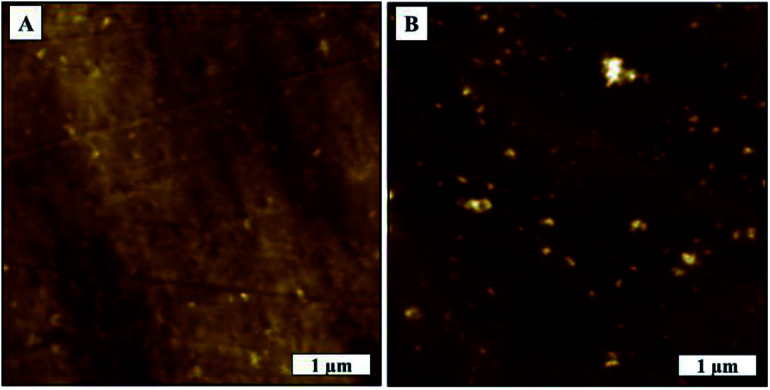
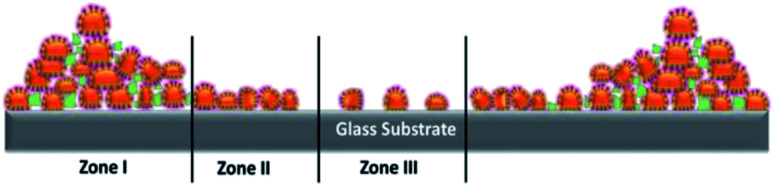
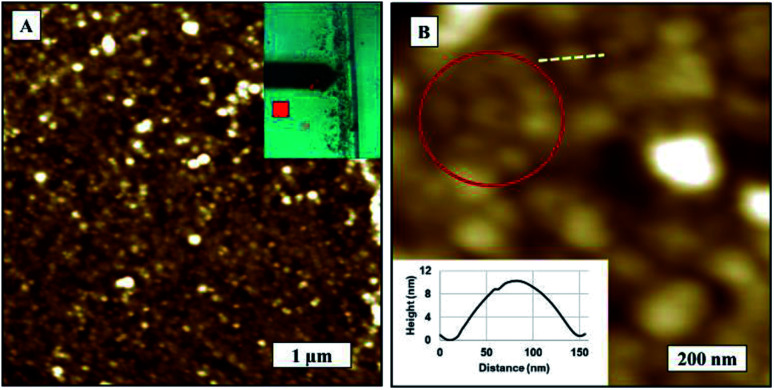
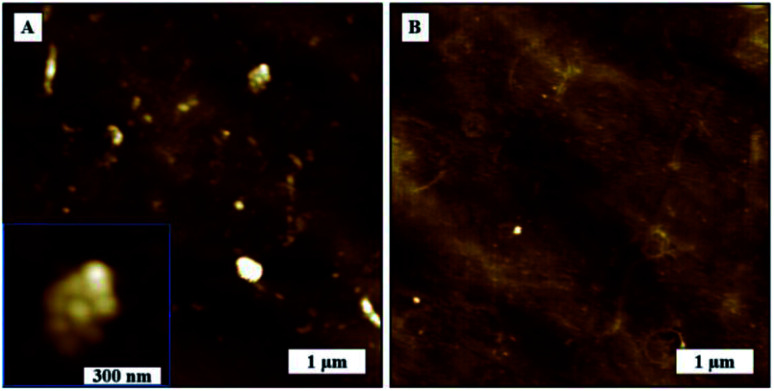
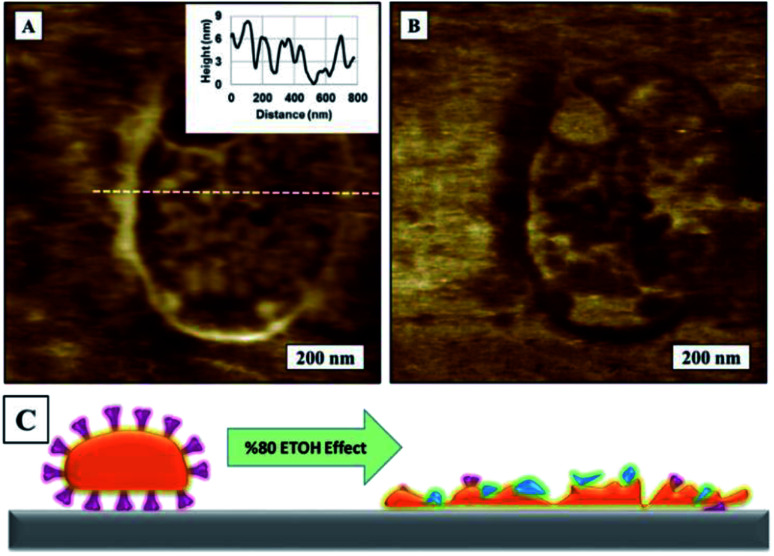
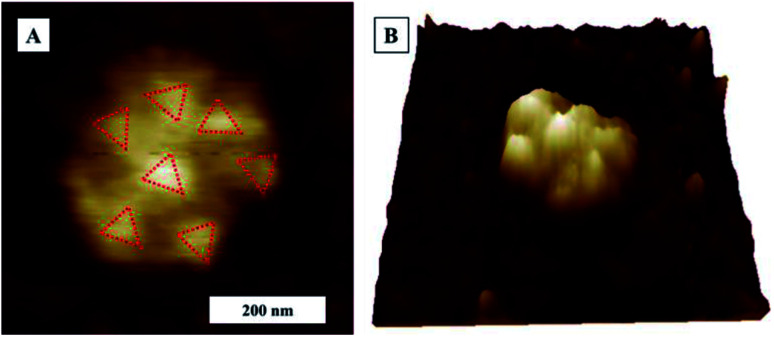
Coronavirus (SARS-CoV-2) is a respiratory infection virus that was first detected in Wuhan, China. The virus causes COVID-19 disease and the outbreak was recognised as a pandemic by the World Health Organization (WHO) in March 2020. SARS-CoV-2 virion was first imaged using cryo-electron microscopy by the Chinese Center for Disease Control and Prevention (CDC). Atomic Force Microscopy is a unique technique that can allow imaging of biomolecules under different conditions. In this work, we used Atomic Force Microscopy to characterize SARS-CoV-2 on tissue culture polystyrene (TCPS) and glass coverslip surfaces. We isolated SARS-CoV-2 and drop casted it on coverslip glass and tissue culture polystyrene surfaces. We analyzed height profiles, density, and aggregation behavior of the virion on glass and polystyrene surfaces. We observed the coffee ring effect on the drop casted samples and close packing of virions near the coffee rings on both surfaces with relatively higher virion distribution on the tissue culture polystyrene (TCPS) substrates. We compare virion agglomeration on the two types of surfaces. Finally, we applied ethanol disinfectant to virions on the surface to visualize the effect of ethanol and image the ultrastructure of SARS-CoV-2.
This journal is © The Royal Society of Chemistry.
Conflict of interest statement
There are no conflicts to declare.
Figures
Similar articles
-
Near-Native Visualization of SARS-CoV-2 Induced Membrane Remodeling and Virion Morphogenesis.Viruses. 2022 Dec 14;14(12):2786. doi: 10.3390/v14122786. Viruses. 2022. PMID: 36560790 Free PMC article.
-
A Nanomechanical Study on Deciphering the Stickiness of SARS-CoV-2 on Inanimate Surfaces.ACS Appl Mater Interfaces. 2020 Dec 30;12(52):58360-58368. doi: 10.1021/acsami.0c16800. Epub 2020 Dec 18. ACS Appl Mater Interfaces. 2020. PMID: 33337873
-
Surface characterization of poly(N-isopropylacrylamide) grafted tissue culture polystyrene by electron beam irradiation, using atomic force microscopy, and X-ray photoelectron spectroscopy.J Nanosci Nanotechnol. 2007 Mar;7(3):796-802. doi: 10.1166/jnn.2007.509. J Nanosci Nanotechnol. 2007. PMID: 17450835
-
SARS-CoV-2: Outline, Prevention, and Decontamination.Pathogens. 2021 Jan 23;10(2):114. doi: 10.3390/pathogens10020114. Pathogens. 2021. PMID: 33498679 Free PMC article. Review.
-
Hunting coronavirus by transmission electron microscopy - a guide to SARS-CoV-2-associated ultrastructural pathology in COVID-19 tissues.Histopathology. 2021 Feb;78(3):358-370. doi: 10.1111/his.14264. Epub 2020 Dec 1. Histopathology. 2021. PMID: 32981112 Free PMC article. Review.
Cited by
-
Mechanisms of Plasma Ozone and UV-C Sterilization of SARS-CoV-2 Explored through Atomic Force Microscopy.ACS Appl Mater Interfaces. 2024 Sep 18;16(37):49176-49185. doi: 10.1021/acsami.4c11057. Epub 2024 Sep 6. ACS Appl Mater Interfaces. 2024. PMID: 39240691 Free PMC article.
-
Monitoring SARS-CoV-2 Surrogate TGEV Individual Virions Structure Survival under Harsh Physicochemical Environments.Cells. 2022 May 27;11(11):1759. doi: 10.3390/cells11111759. Cells. 2022. PMID: 35681454 Free PMC article.
-
Light-Induced Transformation of Virus-Like Particles on TiO2.ACS Appl Mater Interfaces. 2024 Jul 17;16(28):37275-37287. doi: 10.1021/acsami.4c07151. Epub 2024 Jul 3. ACS Appl Mater Interfaces. 2024. PMID: 38959130 Free PMC article.
-
Fluidization and Application of Carbon Nano Agglomerations.Adv Sci (Weinh). 2024 Feb;11(8):e2306355. doi: 10.1002/advs.202306355. Epub 2023 Dec 19. Adv Sci (Weinh). 2024. PMID: 38115551 Free PMC article. Review.
-
Stability of SARS-CoV-2 on Commercial Aircraft Interior Surfaces with Implications for Effective Control Measures.Int J Environ Res Public Health. 2023 Aug 18;20(16):6598. doi: 10.3390/ijerph20166598. Int J Environ Res Public Health. 2023. PMID: 37623181 Free PMC article.
References
-
- Li C., Zhang J., Kulwa F., Qi S. and Qi Z., in Pattern Recognition and Computer Vision, ed. Y. Q. Peng, H. LiuLu, Z. Sun, C. Liu, X. Chen, H. Zha and Y. Jian, Springer International Publishing, Switzerland, 1st edn, 2020, vol. 12305, ch. 1, pp. 244–255
-
- WHO Director-General’s opening remarks at the media briefing on COVID-19, https://www.who.int/dg/speeches/detail/who-director-general-s-opening-re..., accessed November 2020
-
- WHO Director-General’s opening remarks at the World Health Assembly, https://www.who.int/director-general/speeches/detail/who-director-genera..., accessed November 2020
LinkOut - more resources
Full Text Sources
Other Literature Sources
Miscellaneous