Integrated glycomics strategy for the evaluation of glycosylation alterations in salivary proteins associated with type 2 diabetes mellitus
- PMID: 35515389
- PMCID: PMC9057417
- DOI: 10.1039/d0ra05466f
Integrated glycomics strategy for the evaluation of glycosylation alterations in salivary proteins associated with type 2 diabetes mellitus
Abstract
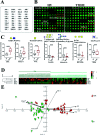
Glycosylation is involved in several biological processes, and its alterations can reflect the process of certain diseases. Type 2 diabetes mellitus (T2DM) has attained the status of a global pandemic; however, the difference in salivary protein glycosylation between healthy subjects and patients with T2DM has not been fully understood. In the present study, salivary specimens from patients with T2DM (n = 72) and healthy volunteers (HVs, n = 80) were enrolled and divided into discovery and validation cohorts. A method combining the lectin microarray and lectin blotting was employed to investigate and confirm the altered glycopatterns in salivary glycoproteins. Then, lectin-mediated affinity capture of glycoproteins and MALDI-TOF/TOF-MS were performed to obtain the precise structural information of the altered glycans. As a result, the glycopatterns recognized by 5 lectins (LEL, VVA, Jacalin, RCA120 and DSA) showed significant alteration in the saliva of T2DM patients. Notably, the glycopattern of Galβ-1,4GlcNAc (LacNAc) recognized by LEL exhibited a significant increase in T2DM patients compared to HVs in both discovery and validation cohorts. The MALDI-TOF/TOF-MS results indicated that there were 10 and 7 LacNAc-containing N/O-glycans (e.g. m/z 1647.586, 11 688.613 and 1562.470) that were identified only in T2DM patients. Besides, the relative abundance of 3 LacNAc-containing N-glycans and 10 LacNAc-containing O-glycans showed an increase in the glycopattern in T2DM patients. These results indicated that the glycopattern of LacNAc is increased in salivary glycoproteins from T2DM patients, and an increase in LacNAc-containing N/O-glycans may contribute to this alteration. Our findings provide useful information to understand the complex physiological changes in the T2DM patients.
This journal is © The Royal Society of Chemistry.
Conflict of interest statement
The authors declare no conflict of interest.
Figures


Similar articles
-
The Abnormal Glycopatterns of Salivary Glycoproteins in Esophageal Squamous Cell Carcinoma Patients.Front Chem. 2021 Mar 4;9:637730. doi: 10.3389/fchem.2021.637730. eCollection 2021. Front Chem. 2021. PMID: 33748076 Free PMC article.
-
Integrated Glycome Strategy for Characterization of Aberrant LacNAc Contained N-Glycans Associated With Gastric Carcinoma.Front Oncol. 2019 Jul 10;9:636. doi: 10.3389/fonc.2019.00636. eCollection 2019. Front Oncol. 2019. PMID: 31355147 Free PMC article.
-
Integrated glycomics strategy for galactosylated-N-glycans recognized by Bandeiraea Simplicifolia Lectin I in salivary proteins associated with lung cancer.Proteomics Clin Appl. 2023 May;17(3):e2200012. doi: 10.1002/prca.202200012. Epub 2022 Dec 4. Proteomics Clin Appl. 2023. PMID: 36349801
-
Methods in enzymology: O-glycosylation of proteins.Methods Enzymol. 2005;405:139-71. doi: 10.1016/S0076-6879(05)05007-X. Methods Enzymol. 2005. PMID: 16413314 Review.
-
Lectin microarrays for glycoproteomics: an overview of their use and potential.Expert Rev Proteomics. 2020 Jan;17(1):27-39. doi: 10.1080/14789450.2020.1720512. Epub 2020 Jan 27. Expert Rev Proteomics. 2020. PMID: 31971038 Review.
Cited by
-
Deciphering disease through glycan codes: leveraging lectin microarrays for clinical insights.Acta Biochim Biophys Sin (Shanghai). 2024 Aug 1;56(8):1145-1155. doi: 10.3724/abbs.2024123. Acta Biochim Biophys Sin (Shanghai). 2024. PMID: 39099413 Free PMC article. Review.
-
High-Throughput Glycomic Methods.Chem Rev. 2022 Oct 26;122(20):15865-15913. doi: 10.1021/acs.chemrev.1c01031. Epub 2022 Jul 7. Chem Rev. 2022. PMID: 35797639 Free PMC article. Review.
-
Characterization of aberrant glycosylation associated with osteoarthritis based on integrated glycomics methods.Arthritis Res Ther. 2023 Jun 12;25(1):102. doi: 10.1186/s13075-023-03084-w. Arthritis Res Ther. 2023. PMID: 37308935 Free PMC article.
-
Highland Barley and Its By-Products Enriched with Phenolic Compounds for Inhibition of Pyrraline Formation by Scavenging α-Dicarbonyl Compounds.Foods. 2021 May 17;10(5):1109. doi: 10.3390/foods10051109. Foods. 2021. PMID: 34067809 Free PMC article.
-
The Abnormal Glycopatterns of Salivary Glycoproteins in Esophageal Squamous Cell Carcinoma Patients.Front Chem. 2021 Mar 4;9:637730. doi: 10.3389/fchem.2021.637730. eCollection 2021. Front Chem. 2021. PMID: 33748076 Free PMC article.
References
-
- Danaei G. Finucane M. M. Lu Y. Singh G. M. Cowan M. J. Paciorek C. J. Lin J. K. Farzadfar F. Khang Y. H. Stevens G. A. Rao M. Ali M. K. Riley L. M. Robinson C. A. Ezzati M. Global Burden of Metabolic Risk Factors of Chronic Diseases Collaborating Group (Blood Glucose) Lancet. 2011;378:31–40. doi: 10.1016/S0140-6736(11)60679-X. - DOI - PubMed
LinkOut - more resources
Full Text Sources
Research Materials

