

Identifying signatures of proteolytic stability and monomeric propensity in O-glycosylated insulin using molecular simulation
- PMID: 35507105
- PMCID: PMC10353491
- DOI: 10.1007/s10822-022-00453-6
Identifying signatures of proteolytic stability and monomeric propensity in O-glycosylated insulin using molecular simulation
Abstract
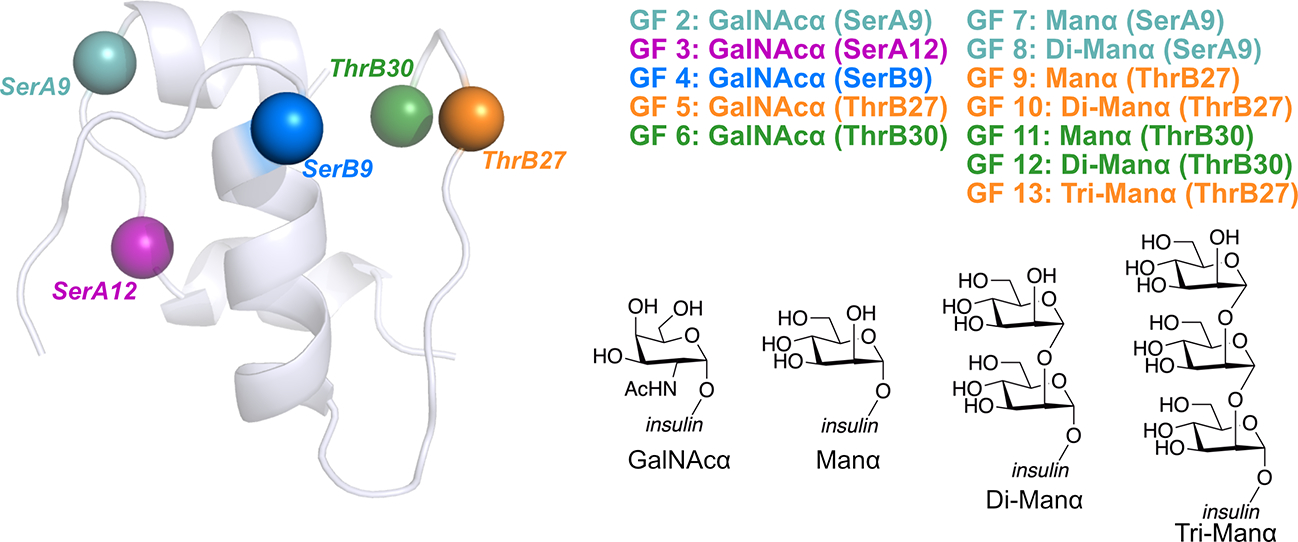
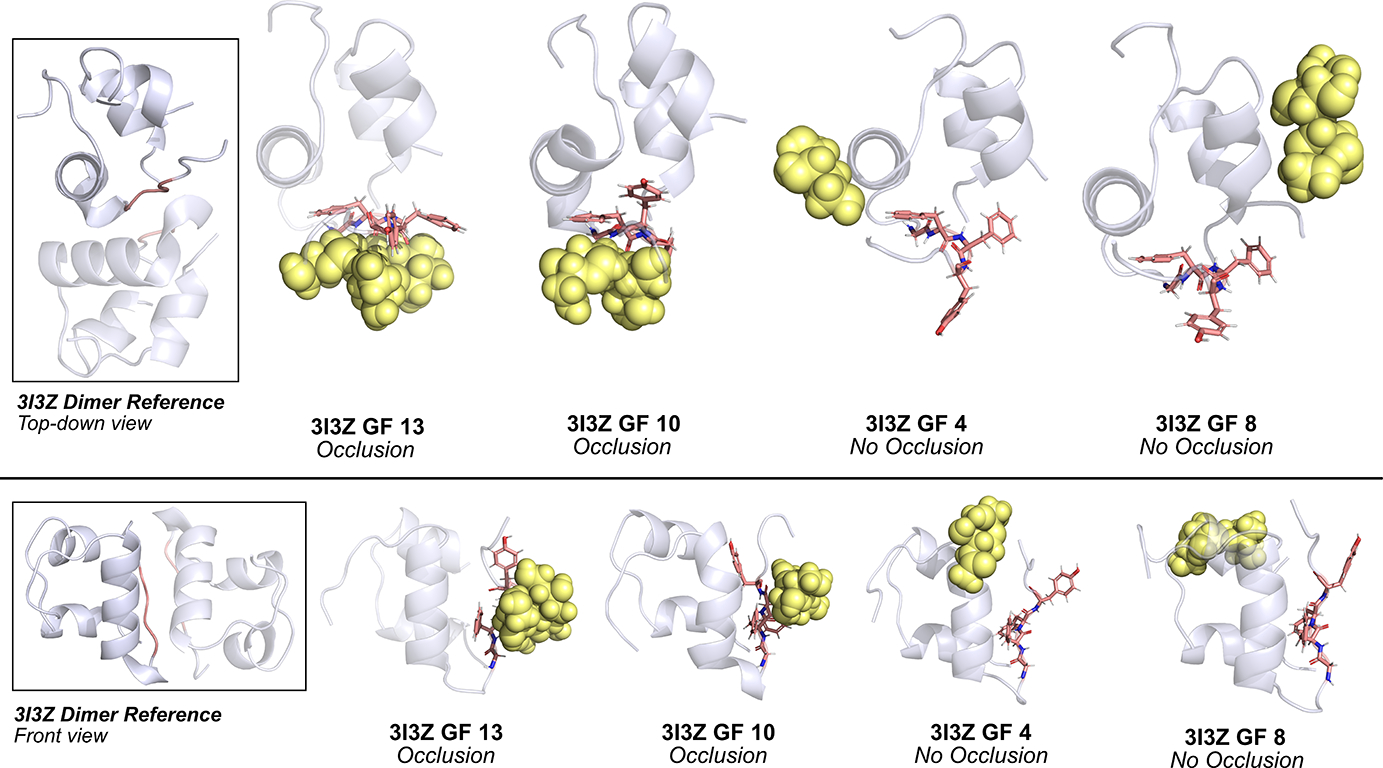
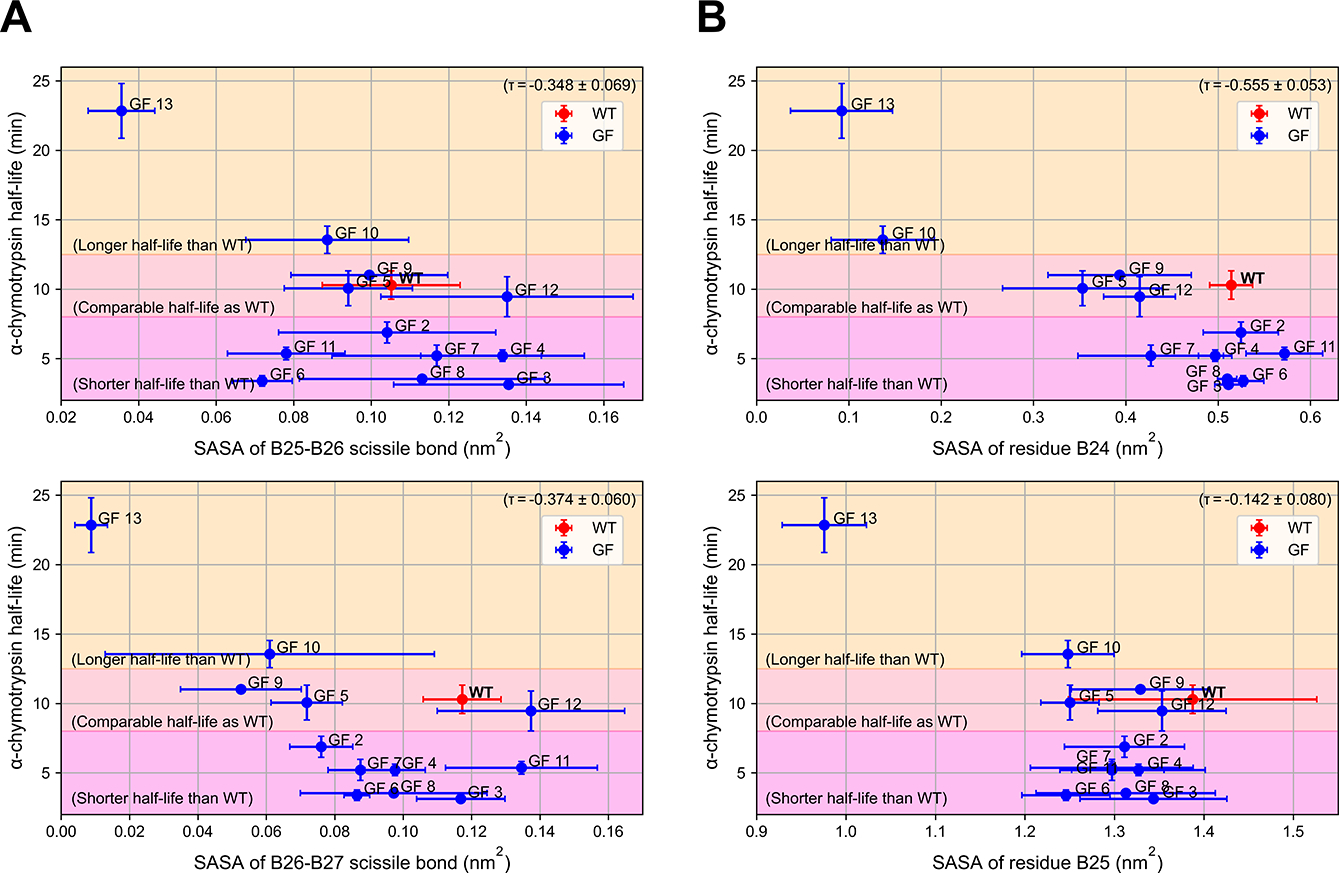
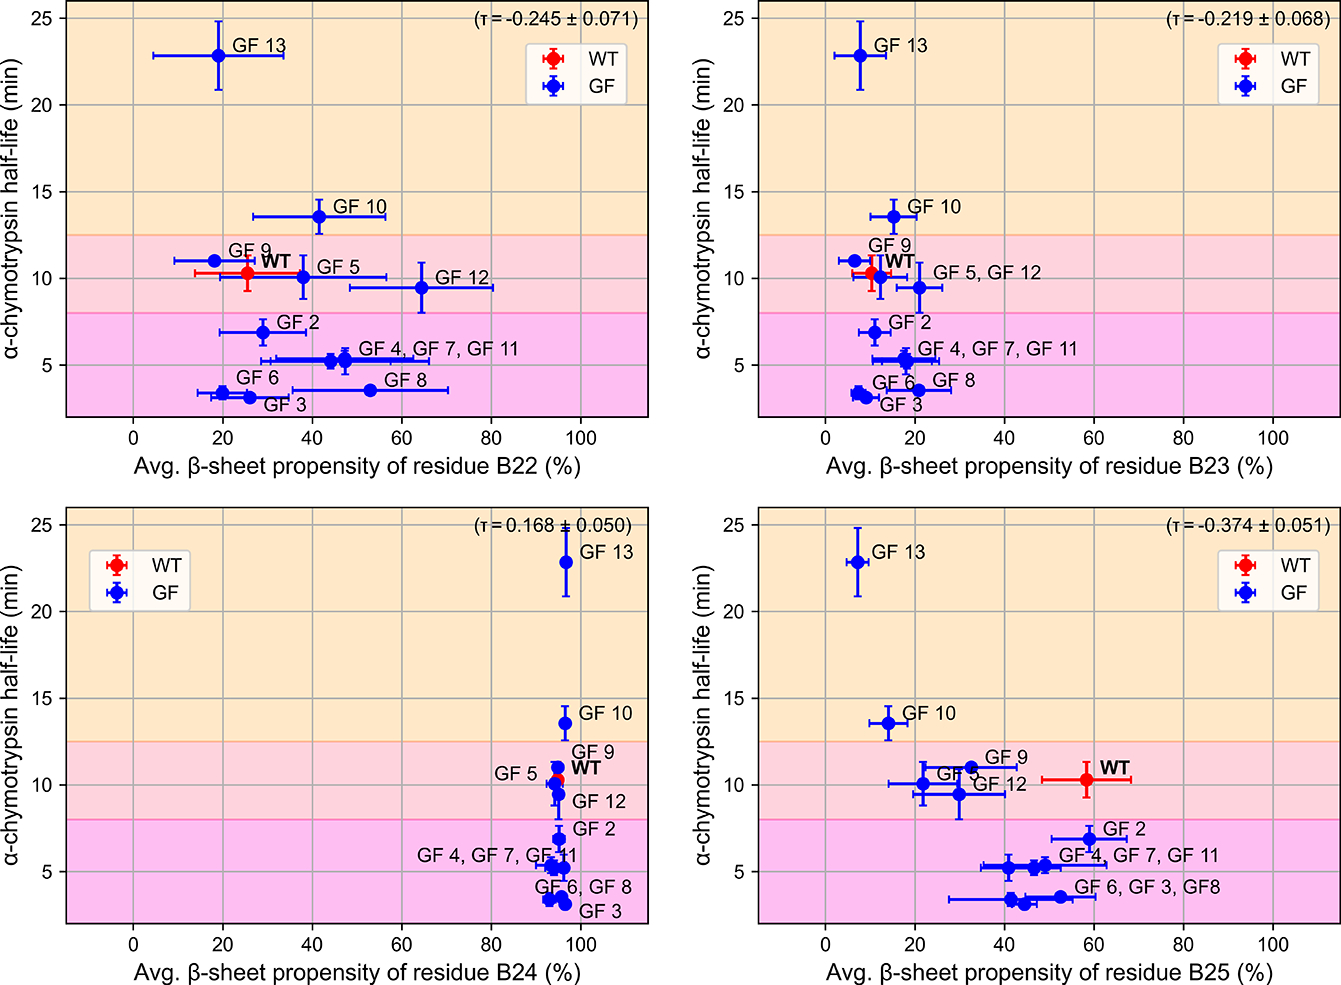
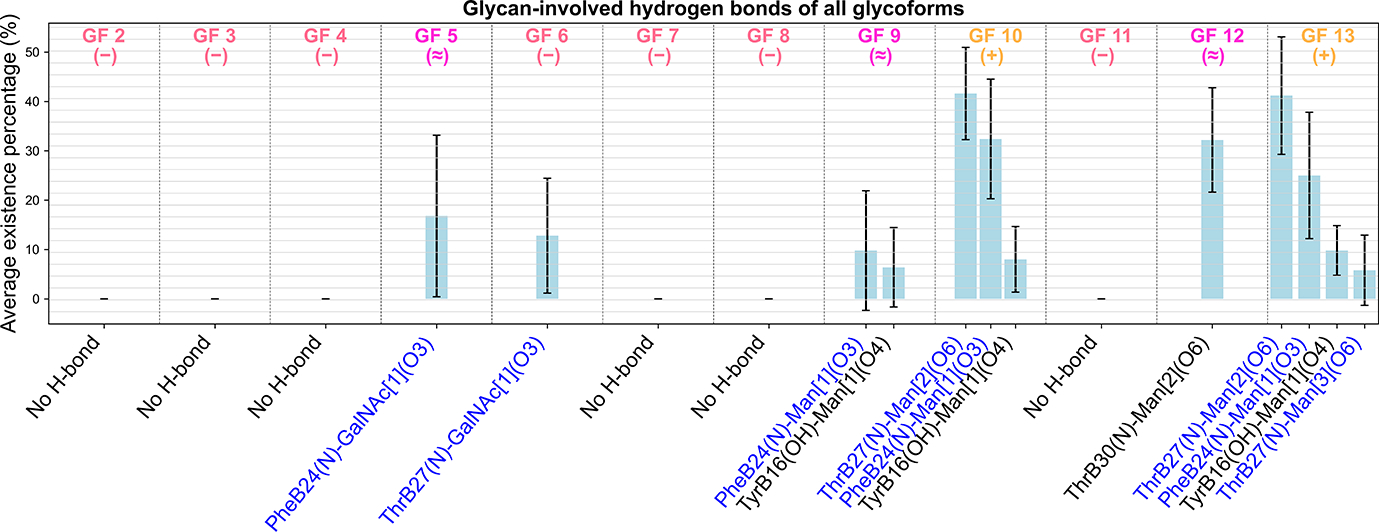
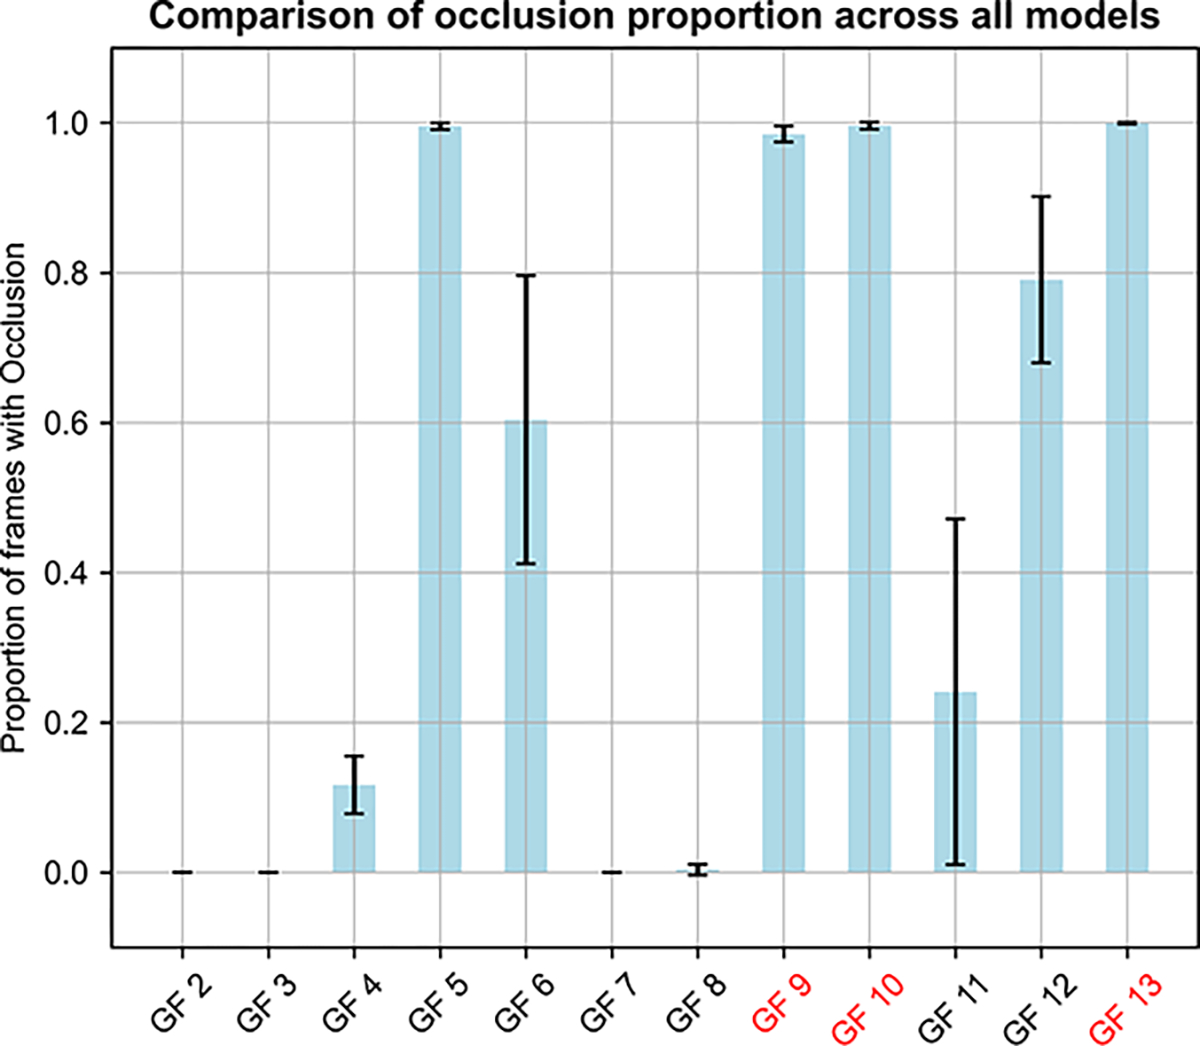
Insulin has been commonly adopted as a peptide drug to treat diabetes as it facilitates the uptake of glucose from the blood. The development of oral insulin remains elusive over decades owing to its susceptibility to the enzymes in the gastrointestinal tract and poor permeability through the intestinal epithelium upon dimerization. Recent experimental studies have revealed that certain O-linked glycosylation patterns could enhance insulin's proteolytic stability and reduce its dimerization propensity, but understanding such phenomena at the molecular level is still difficult. To address this challenge, we proposed and tested several structural determinants that could potentially influence insulin's proteolytic stability and dimerization propensity. We used these metrics to assess the properties of interest from [Formula: see text] aggregate molecular dynamics of each of 12 targeted insulin glyco-variants from multiple wild-type crystal structures. We found that glycan-involved hydrogen bonds and glycan-dimer occlusion were useful metrics predicting the proteolytic stability and dimerization propensity of insulin, respectively, as was in part the solvent-accessible surface area of proteolytic sites. However, other plausible metrics were not generally predictive. This work helps better explain how O-linked glycosylation influences the proteolytic stability and monomeric propensity of insulin, illuminating a path towards rational molecular design of insulin glycoforms.
Keywords: Insulin; Molecular dynamics; O-glycosylation; Protein degradation; Stability.
© 2022. The Author(s), under exclusive licence to Springer Nature Switzerland AG.
Figures

Similar articles
-
Dynamics and Infrared Spectrocopy of Monomeric and Dimeric Wild Type and Mutant Insulin.J Phys Chem B. 2020 Dec 31;124(52):11882-11894. doi: 10.1021/acs.jpcb.0c08048. Epub 2020 Nov 27. J Phys Chem B. 2020. PMID: 33245663
-
Sensitivity of water dynamics to biologically significant surfaces of monomeric insulin: role of topology and electrostatic interactions.J Phys Chem B. 2014 Apr 10;118(14):3805-13. doi: 10.1021/jp411136w. Epub 2014 Mar 31. J Phys Chem B. 2014. PMID: 24641444
-
Comparison of the dynamics of an engineered insulin monomer and dimer by acid-quenched amide proton exchange. Non-local stabilization of interchain hydrogen bonds by dimerization.J Mol Biol. 1993 Mar 20;230(2):387-94. doi: 10.1006/jmbi.1993.1156. J Mol Biol. 1993. PMID: 8464054
-
Active role for the vasculature in the delivery of insulin to skeletal muscle.Clin Exp Pharmacol Physiol. 2005 Apr;32(4):302-7. doi: 10.1111/j.1440-1681.2005.04188.x. Clin Exp Pharmacol Physiol. 2005. PMID: 15810996 Review.
-
Methods in enzymology: O-glycosylation of proteins.Methods Enzymol. 2005;405:139-71. doi: 10.1016/S0076-6879(05)05007-X. Methods Enzymol. 2005. PMID: 16413314 Review.
Cited by
-
Using physical property surrogate models to perform accelerated multi-fidelity optimization of force field parameters.Digit Discov. 2023 May 5;2(3):828-847. doi: 10.1039/d2dd00138a. eCollection 2023 Jun 12. Digit Discov. 2023. PMID: 37312680 Free PMC article.
-
Effects of External Perturbations on Protein Systems: A Microscopic View.ACS Omega. 2022 Nov 30;7(49):44556-44572. doi: 10.1021/acsomega.2c06199. eCollection 2022 Dec 13. ACS Omega. 2022. PMID: 36530249 Free PMC article. Review.
References
-
- Carino GP, Mathiowitz E. Oral insulin delivery. Advanced drug delivery reviews. 1999;35(2–3):249–257. - PubMed
-
- Gedawy A, Martinez J, Al-Salami H, Dass CR. Oral insulin delivery: existing barriers and current counter-strategies. Journal of pharmacy and pharmacology. 2018;70(2):197–213. - PubMed
-
- Hoffman A, Ziv E. Pharmacokinetic considerations of new insulin formulations and routes of administration. Clinical pharmacokinetics. 1997;33(4):285–301. - PubMed
-
- Owens DR. New horizons—alternative routes for insulin therapy. Nature reviews drug discovery. 2002;1(7):529–540. - PubMed
Publication types
MeSH terms
Substances
Grants and funding
LinkOut - more resources
Full Text Sources
Medical
