

Analysis of the different characteristics between omental preadipocytes and differentiated white adipocytes using bioinformatics methods
- PMID: 35499169
- PMCID: PMC9067510
- DOI: 10.1080/21623945.2022.2063471
Analysis of the different characteristics between omental preadipocytes and differentiated white adipocytes using bioinformatics methods
Abstract
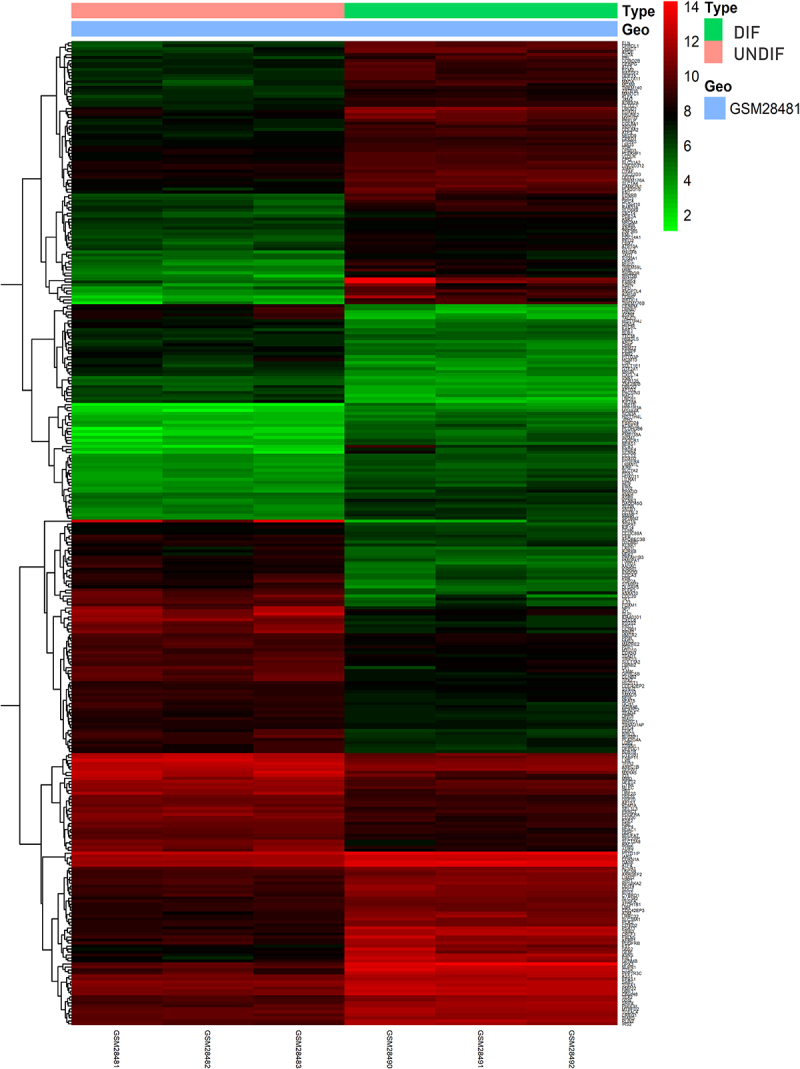
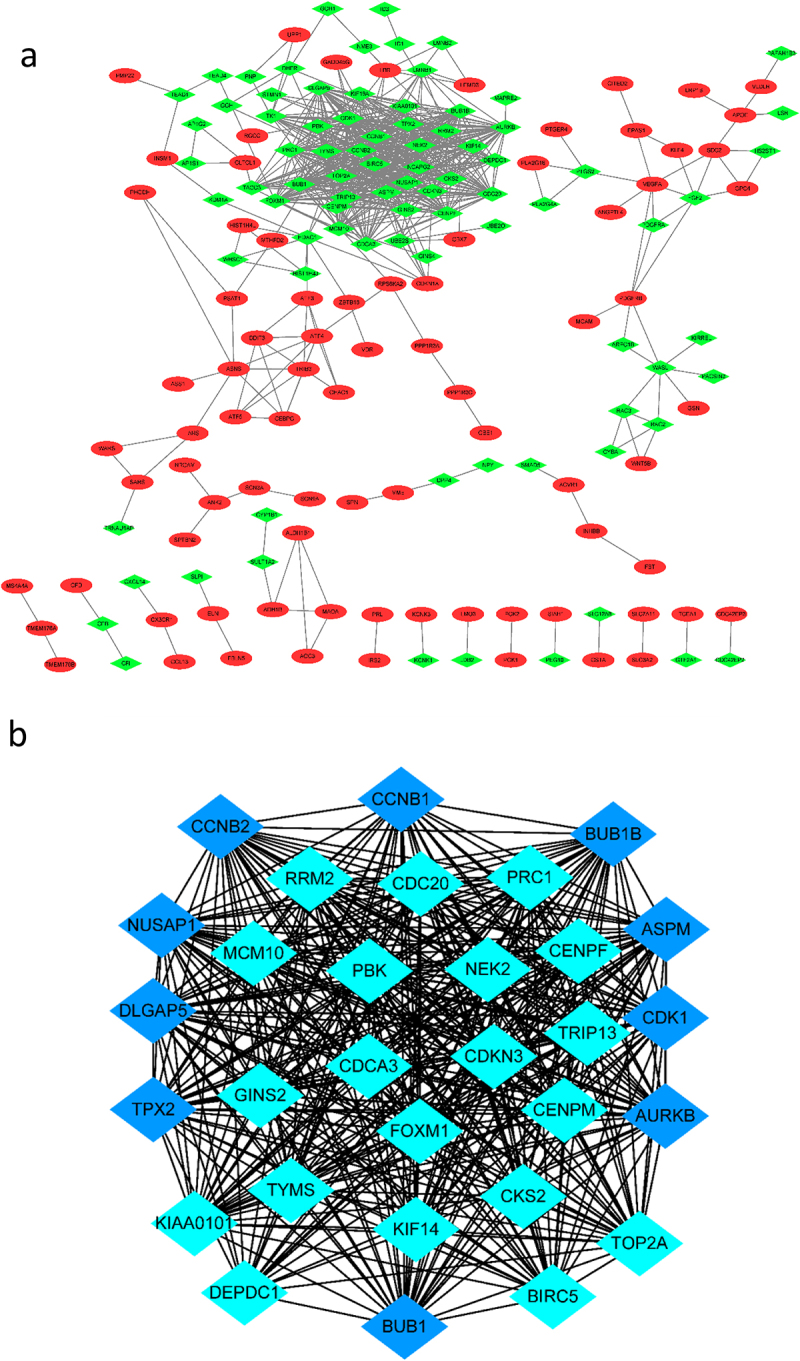
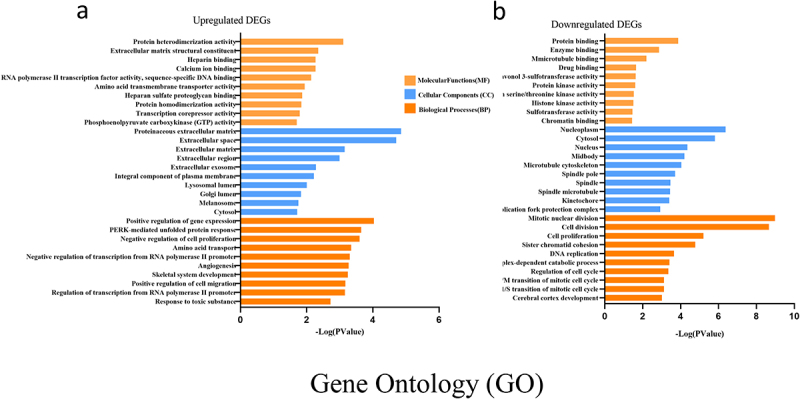
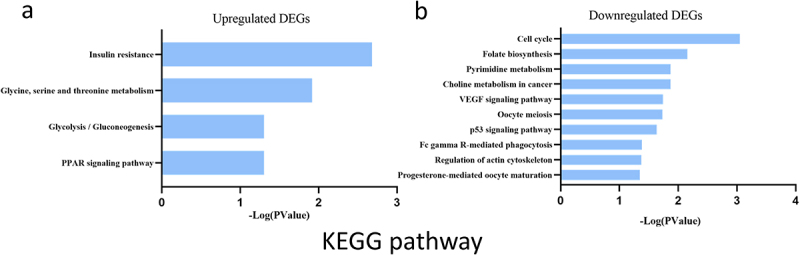
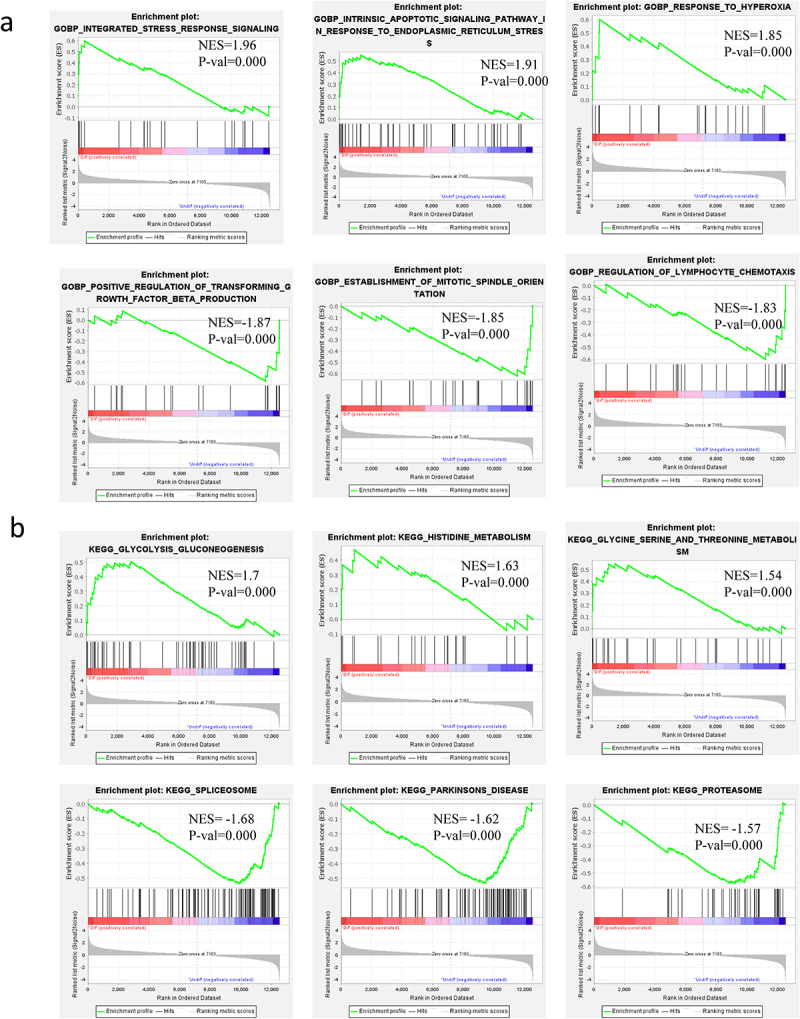
Obesity is emerging as an epidemiological issue, being associated with the onset and progress of various metabolism-related disorders. Obesity is characterized by the white adipose expansion, which encounters white adipocyte hypertrophy and hyperplasia. White adipocyte hyperplasia is defined as adipogenesis with the increase in the number of the white adipocytes from the preadipocytes. Adipogenesis contributes to distributing excess triglycerides among the smaller newly formed adipocytes, reducing the number of hypertrophic adipocytes and secreting anti-inflammatory factor. Therefore, adipogenesis is emerging as a new therapeutic target for the treatment of obesity. In the present study, for a better understanding of the contribution of the alteration of the omental differentiated white adipocytes to the systemic metabolic disorders, we downloaded the mRNA expression profiles from GEO database GSE1657, 328 differentially expressed genes (DEGs) were screened between the undifferentiated preadipocytes (UNDIF) and omental differentiated white adipocytes (DIF). The contributions of the upregulated and downregulated DEGs to the system were performed via the Gene Ontology (GO) analysis, the Kyoto Encyclopedia of Genes and Genomes (KEGG) pathway analysis and Protein-Protein Interaction (PPI) network, respectively. The potential contribution of the whole altered genes in the differentiated white adipocytes was explored with the performance of Gene Set Enrichment Analysis (GSEA), especially on the GO analysis, KEGG analysis, hallmark analysis, oncogenic analysis and related miRNA analysis. The output of the current study will shed light on the new targets for the treatment of obesity and obesity-related disorders.
Keywords: Differentiated white adipocyte; GSAE; bioinformatics; different characteristic; preadipocytes.
Conflict of interest statement
No potential conflict of interest was reported by the author(s).
Figures

Similar articles
-
Identification of biomarkers, pathways and potential therapeutic agents for white adipocyte insulin resistance using bioinformatics analysis.Adipocyte. 2019 Dec;8(1):318-329. doi: 10.1080/21623945.2019.1649578. Adipocyte. 2019. PMID: 31407623 Free PMC article.
-
Autophagic Regulation of Adipogenesis Through TP53INP2: Insights from In Silico and In Vitro Analysis.Mol Biotechnol. 2024 May;66(5):1188-1205. doi: 10.1007/s12033-023-01020-6. Epub 2024 Jan 18. Mol Biotechnol. 2024. PMID: 38238641
-
Identification of Potential Key Genes Associated with Adipogenesis through Integrated Analysis of Five Mouse Transcriptome Datasets.Int J Mol Sci. 2018 Nov 12;19(11):3557. doi: 10.3390/ijms19113557. Int J Mol Sci. 2018. PMID: 30424473 Free PMC article.
-
Adipogenic miRNA and meta-signature miRNAs involved in human adipocyte differentiation and obesity.Oncotarget. 2016 Jun 28;7(26):40830-40845. doi: 10.18632/oncotarget.8518. Oncotarget. 2016. PMID: 27049726 Free PMC article. Review.
-
Revisiting the adipocyte: a model for integration of cytokine signaling in the regulation of energy metabolism.Am J Physiol Endocrinol Metab. 2015 Oct 15;309(8):E691-714. doi: 10.1152/ajpendo.00297.2015. Epub 2015 Sep 1. Am J Physiol Endocrinol Metab. 2015. PMID: 26330344 Review.
Cited by
-
Resveratrol Supplementation in Obese Pregnant Rats Improves Maternal Metabolism and Prevents Increased Placental Oxidative Stress.Antioxidants (Basel). 2022 Sep 21;11(10):1871. doi: 10.3390/antiox11101871. Antioxidants (Basel). 2022. PMID: 36290594 Free PMC article.
-
Targeted Nano-Based Systems for the Anti-Obesity Agent's Delivery.Adv Exp Med Biol. 2024;1460:657-676. doi: 10.1007/978-3-031-63657-8_22. Adv Exp Med Biol. 2024. PMID: 39287868 Review.
-
Identification of key genes and signaling pathways associated with dementia with Lewy bodies and Parkinson's disease dementia using bioinformatics.Front Neurol. 2023 Mar 9;14:1029370. doi: 10.3389/fneur.2023.1029370. eCollection 2023. Front Neurol. 2023. PMID: 36970514 Free PMC article.
-
Identification of energy metabolism-related biomarkers for risk prediction of heart failure patients using random forest algorithm.Front Cardiovasc Med. 2022 Oct 11;9:993142. doi: 10.3389/fcvm.2022.993142. eCollection 2022. Front Cardiovasc Med. 2022. PMID: 36304554 Free PMC article.
References
-
- Piche ME, Tchernof A, Despres JP. Obesity phenotypes, diabetes, and cardiovascular diseases. Circ Res. 2020;126(11):1477–1500. - PubMed
Publication types
MeSH terms
Grants and funding
LinkOut - more resources
Full Text Sources
Other Literature Sources