. 2022 May;23(5):705-717.
doi: 10.1038/s41590-022-01192-4. Epub 2022 Apr 29.

Caspase-11 interaction with NLRP3 potentiates the noncanonical activation of the NLRP3 inflammasome

Affiliations

Caspase-11 interaction with NLRP3 potentiates the noncanonical activation of the NLRP3 inflammasome

Julien Moretti et al. Nat Immunol. 2022 May.

Abstract

Caspase-11 detection of intracellular lipopolysaccharide (LPS) from invasive Gram-negative bacteria mediates noncanonical activation of the NLRP3 inflammasome. While avirulent bacteria do not invade the cytosol, their presence in tissues necessitates clearance and immune system mobilization. Despite sharing LPS, only live avirulent Gram-negative bacteria activate the NLRP3 inflammasome. Here, we found that bacterial mRNA, which signals bacterial viability, was required alongside LPS for noncanonical activation of the NLRP3 inflammasome in macrophages. Concurrent detection of bacterial RNA by NLRP3 and binding of LPS by pro-caspase-11 mediated a pro-caspase-11-NLRP3 interaction before caspase-11 activation and inflammasome assembly. LPS binding to pro-caspase-11 augmented bacterial mRNA-dependent assembly of the NLRP3 inflammasome, while bacterial viability and an assembled NLRP3 inflammasome were necessary for activation of LPS-bound pro-caspase-11. Thus, the pro-caspase-11-NLRP3 interaction nucleated a scaffold for their interdependent activation explaining their functional reciprocal exclusivity. Our findings inform new vaccine adjuvant combinations and sepsis therapy.


Conflict of interest statement

Competing interests: Authors declare no competing interest.

Figures

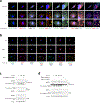
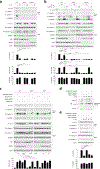
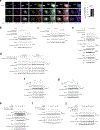
Extended Data Fig. 1
Extended Data Fig. 1. Bacterial mRNA and stimulatory LPS are both required for caspase-11 and noncanonical inflammasome activation.
a, Immunofluorescence confocal microscopy on bone marrow derived macrophages (hereafter ‘macrophages’) 2hr post-stimulation with L or HK E. coli or untreated. b, Bar graph, % cells with LAMP1-LPS colocalization. c, Immunoblots of macrophage concentrated supernatants (20hr) or WCE (6hr), and cytokine concentrations and LDH release in culture supernatants (20hr) post-stimulation with L, HK or HK E. coli supplemented with 100ng/mL mRNA isolated from E. coli or eukaryotic cells. LDH measured by cytotoxicity assay; IL-1β, TNF and IL-6 by ELISA. Error bars, mean ± s.e.m. t-test was performed in b (n=3). ns: non-significant. Bacteria:macrophage=20:1. Results represent at least 3 independent experiments.
Extended Data Fig. 2
Extended Data Fig. 2. Cytosolic levels of LPS and bacterial mRNA after macrophage stimulation with live or heat-killed bacteria.
a, Measurements of LPS in the cytosolic (C) or residual (R) fractions prepared from macrophages 2hr post-transfection of indicated doses of LPS alone, co-transfection of 2ng/mL LPS with 100ng/mL E. coliLPSmut mRNA, or stimulation with L or HK E. coli or virulent E. coli as indicated. LPS was measured via Limulus Amebocyte Lysate method. b, Immunoblots of cytosolic (C) and residual (R) fractions from macrophages 2hr post-stimulation with L E. coli, HK E. coli or L virulent E. coli, and probed with marker antibodies for indicated subcellular compartments. c, RT-qPCR for the bacterial gene groES, groEL, era and dnaE on cytosolic fractions prepared 2hr post macrophage transfection with indicated doses of ultrapure LPS and mRNA prepared from E. coli, or stimulation with L, HK or HK E. coli or virulent E. coli supplemented with mRNA prepared from each bacterium. d,e, mNeonGreen fluorescence measurements on total extracts (d) or cytosolic versus residual fractions (e) of macrophages stably expressing tDeg-tagged mNeonGreen 2hr post-stimulation with E. coli expressing or not Pepper RNA, or after treatment with proteasome inhibitor MG132 as indicated. By expressing a Pepper RNA-regulated fluorogenic protein (mNeonGreen-tDeg) in the cytosol of macrophages, we noted 1.5–2-fold increase in mNeonGreen fluorescence following phagocytosis of recombinant Pepper RNA-expressing E. coli compared to the 2–2.5-fold increase with the proteasomal inhibitor MG132, indicating cytosolic access of Pepper RNA derived from phagocytosed E. coli bound to and stabilized the fluorogenic protein in the cytosol of macrophages. f,h, Confocal microscopy of direct fluorescence RNA in situ hybridization (ViewRNA ISH) to detect two RNAbac transcripts encoding for either mCherry (f) or endogenous GroES (h) from recombinant mCherry E. coli showed significantly more probe signal in macrophages at 6hr post-phagocytosis of live (L) compared to killed (K) bacteria. Killed bacteria were visualized by anti-LPS staining due to loss of mCherry fluorescence. RNA probe signal localized with live bacteria in lysosomes labeled with LAMP-1 as expected, but almost half of this signal did not colocalize to these bacteria suggesting cytosolic access. Inserts show magnification of indicated area. g,i, Bar graphs show quantification of probe signal in (f) and (h), respectively. Bacteria:macrophage=20:1. Error bars, mean ± s.e.m. One-way ANOVA followed by multiple comparisons Sidak tests and p values are indicated in bar graphs in g (Total number, Unst.: n=13, L: n=19, K: n=15, K(LPS): n=17 – Not colocalized, Unst.: n=11, L, K: n=14) and i (Total number, Unst.: n=11, L: n=14, K, K(LPS): n=10 – Not colocalized, n=10). Results represent at least 3 independent experiments.
Extended Data Fig. 3
Extended Data Fig. 3. Bacterial mRNA and LPS are both required for IL-1β secretion and generation of the active form of caspase-11.
a, Cytokine concentrations and LDH release in culture supernatants (20hr) post-transfection of WT or Nlrp3–/– macrophages as indicated with 2ng/mL ultrapure LPS and/or 10, 30 and 100 ng/mL of mRNA prepared from E. coli LPSmut, L. innocua, or in vitro transcribed (IVT). b, Immunoblots of macrophage concentrated supernatants, WCE, mixed concentrated supernatants and WCE, or pulldown of caspases with biotinylated zVAD-FMK from WT, Nlrp3–/– or Casp11–/– macrophages 20hr post-stimulation with L, HK or HK E. coli supplemented with E. coli total RNA (RNAtot), or transfection with indicated doses of ultrapure LPS and E. coli RNAtot. c, In vitro zVAD-AMC fluorescence post-incubation with immunoprecipitates of endogenous caspase-11 from macrophages stimulated for 6hr or 12hr as indicated with L, HK, or HK E. coli supplemented with E. coli RNAtot (10μg/mL). No IgG served as a control for Protein G-bound proteins alone. Bacteria:macrophage=20:1. Error bars, mean ± s.e.m. Results represent at least 3 independent experiments.
Extended Data Fig. 4
Extended Data Fig. 4. LPS is required alongside bacterial mRNA for assembly of the NLRP3 inflammasome and regardless of LPS stimulatory activity.
a-c, Immunofluorescence confocal microscopy on macrophages 16hr post-stimulation of indicated macrophage genotypes with L, gentamicin-killed (K) or K red fluorescent protein (RFP) expressing recombinant E. coli supplemented with E. coli RNAtot. Note, the partial nuclear staining pattern has previously been observed (see methods) and appears to be a specific signal given its absence in Pycard–/– macrophages. In a,b, insets show magnification of indicated areas. White arrowheads point to ASC specks. Phalloidin delineates the macrophage actin cytoskeleton. Scale bar=10μm. Bar graphs, % cells exhibiting ASC specks. Error bars, mean ± s.e.m. t-test was performed in b (n=5). One-way ANOVA followed by multiple comparisons Sidak tests were performed in a (n=5) and c (n=6). P values are indicated in bar graphs. Bacteria:macrophage=20:1. Results represent at least 3 independent experiments.
Extended Data Fig. 5
Extended Data Fig. 5. Kinetics of noncanonical activation of the NLPR3 inflammasome in macrophages in response to virulent and avirulent bacteria.
a, LDH released in culture supernatants of macrophages at indicated time points post-stimulation with Live E. coli (avirulent), virulent E. coli or virulent Salmonella. LDH measured by cytotoxicity assay. b,c, Kinetics of SYTOX Red incorporation over 72hr in macrophages stimulated with Live E. coli or virulent E. coli, Salmonella ΔSpi1/2 (avirulent) or WT (virulent), or Shigella BS103 (avirulent) or WT (virulent) (b), and representative images of SYTOX Red incorporation at selected time points (c). Peaks of SYTOX incorporation occurred faster (blue boxes) in response to virulent bacteria, before decreasing likely due to destruction of cell structure, while macrophages stimulated with avirulent bacteria were still incorporating SYTOX and peaked later (orange boxes). Scale bar=150μm. d, Counting of live macrophages at the indicated time points post-stimulation with Live E. coli or virulent E. coli. Counts were normalized to the unstimulated macrophages for each time point. e, Immunoblots of macrophage WCE at the indicated time points post-stimulation with Live E. coli, virulent E. coli or virulent Salmonella. f, Immunoblots of macrophage concentrated supernatants 6hr post-stimulation with Live E. coli or virulent E. coli. Error bars, mean ± s.e.m. Bacteria:macrophage =20:1 for E. coli and virulent E. coli, 5:1 for Salmonella and Shigella strains. Results represent at least 3 independent experiments.
Extended Data Fig. 6
Extended Data Fig. 6. NLRP3 stimuli specifically couple with LPS in mediating noncanonical activation of the NLRP3 inflammasome.
a,b, Immunoblots of macrophage concentrated supernatants (20hr), WCE (6hr), or cross-linked fractions (16hr), and cytokine concentrations in culture supernatants (20hr) as indicated post-stimulation with L, HK or HK E. coli supplemented with indicated doses of RNAtot or Nigericin (a), and post-treatment with Nigericin or transfection of indicated doses of poly(dA:dT) or Flagellin with or without prior priming with 100ng/mL LPS for 12–16hr (b). IL-1β and IL-6 by ELISA. Error bars, mean ± s.e.m.
Extended Data Fig. 7
Extended Data Fig. 7. dTGN colocalization and biochemical procaspase-11-NLRP3 interaction.
a,b, Immunofluorescence confocal microscopy 16hr post-stimulation of WT macrophages with L or HK virulent E. coli (a), and WT, Casp11–/– and Nlrp3–/– macrophages as indicated with L E coli (b). Scale bar=10μm. In (a), side micrograph insets in the triple merges show magnification of the indicated areas. c,d, Immunoprecipitation (IP) of endogenous caspase-11 or NLRP3 as indicated, and immunoblotting for co-immunoprecipitating proteins and WCE proteins (labels to left of immunoblot panels) from macrophages stimulated 12hr with L, HK or HK E. coli supplemented with indicated dose of E. coli RNAtot. (c) and L, HK or HK E. coli supplemented with indicated dose of E. coli RNAtot or Nigericin, E. coli RNAtot alone or Nigericin alone (d). Bacteria:macrophage=20:1. Results represent at least 3 independent experiments.
Extended Data Fig. 8
Extended Data Fig. 8. GSDMD is important for noncanonical activation of the NLRP3 inflammasome in response to Gram-negative bacteria.
a-c, Immunoblots of macrophage concentrated supernatants (20hr) or WCE at 6hr (a,b) and 20hr (c) post-stimulation of WT and Gsdmd–/– macrophages with L or HK E. coli (avirulent) or virulent E. coli as indicated. (d) Immunoblots of macrophage concentrated supernatants (20hr) or WCE (6hr) post-stimulation of macrophages with L or HK E. coli with or without zVAD-FMK treatment.
Extended Data Fig. 9
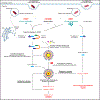
Extended Data Fig. 9. Model for noncanonical activation of the NLRP3 inflammasome by live Gram-negative bacteria.
Following phagocytosis of live Gram-negative bacteria, two classes of PAMPs are exposed to cytoplasmic pattern recognition receptors: the classical PAMP LPS, shared by live and killed bacteria, and the vita-PAMP bacterial mRNA (mRNAbac), present only in live bacteria. Coincident detection of mRNAbac and LPS from virulent or avirulent Gram-negative bacteria alike promotes a physical and mutually exclusive interaction between NLRP3 and the intracellular LPS receptor procaspase-11. This interaction localizes to the dispersed Trans-Golgi Network (TGN) and is mediated through the procaspase-11 SCAF domain and the LRR and PYD domains of NLRP3. The interaction of NLRP3 and procaspase-11 is upstream of their activation: It does not require the ability of LPS to activate caspase-11 and can still occur in the absence of GSDMD. It also does not require ASC and caspase-1 which are important for NLRP3 activation. Besides their interaction, NLRP3 and procaspase-11 are reciprocally required for their function: LPS binding to but not activation of procaspase-11, is necessary for mRNAbac-mediated NLRP3 inflammasome assembly. Reciprocally, NLRP3 and ASC but not caspase-1 are required for procaspase-11 activation, indicating the necessity for ‘nascent’ NLRP3 inflammasome assembly upon sensing the viability of Gram-negative bacteria (detection of mRNAbac) and irrespective of bacterial virulence factor expression. Although NLRP3-ASC oligomers can form in the absence of procaspase-1, these oligomers are unstable indicating stabilization of the ‘nascent’ assembled NLRP3 inflammasome upon procaspase-1 recruitment. Furthermore, higher concentrations of intracellular LPS, likely due to virulence factor activity during infection with virulent cell-invasive Gram-negative bacteria, trigger faster kinetics of plasma membrane permeabilization/pyroptosis compared to avirulent bacteria, and independently of NLRP3 and ASC,. Collectively, the model that emerges demonstrates two modes of procaspase-11 activation by LPS, a fast NLRP3-independent mode triggered by the concurrent expression of bacterial virulence factors, and a slower NLRP3-dependent mode triggered by coincident detection of the vita-PAMP mRNAbac that signifies bacterial viability. (SCAF, scaffold; PYD, Pyrin; LRR, leucine rich repeat).
Extended Data Fig. 10
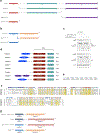
Extended Data Fig. 10. Characterization and mapping of the procaspase-11 and NLRP3 interaction.
a, Schematic indicating the different truncated mutants of NLRP3 used for co-immunoprecipitation experiments in 293T cells. All forms were fused to 3xHA tag in N-Terminus. b, Schematic indicating the different truncated mutants of casp-11C254A used for co-immunoprecipitation experiments in 293T cells. All forms were fused to 3xFLAG tag in N-Terminus. c, Immunoprecipitation and immunoblotting for coimmunoprecipitating and WCE proteins of overexpressed FLAG-caspase-11 either casp-11C254A FL, Casp-11 C254A ΔCARD or Casp-11 C254A ΔSCAF with or without HA-NLRP3FL in 293T cells 24 hr post-transfection. To equilibrate the levels of FLAG-caspase-11 mutants in the immunoprecipitates, 4 times more protein extracts were submitted to anti-FLAG immunoprecipitation when FLAG-casp-11C254A ΔSCAF was expressed (labelled 4X) compared to when either FLAG-casp-11C254A FL or FLAG-casp-11C254A ΔCARD were expressed (labelled 1X). Therefore, note that all proteins from FLAG-casp-11C254A ΔSCAF samples (including HA-NLRP3FL) were 4 times more abundant during anti-FLAG immunoprecipitation, yet HA-NLRP3FL was still much less co-immunoprecipitated with FLAG-casp-11C254A ΔSCAF compared to FLAG-casp-11C254A FL. Immunoblotted proteins are indicated to left of each immunoblot panel. d, Schematic representation of CARD, DED, CASPASE p20 and CASPASE p10 domains of murine inflammatory and apoptotic caspases. SCAF domain is composed of CASPASE p20 and CASPASE p10 domains. All caspases, with the exception of the short forms of mouse and human caspase-12, have SCAF domains. The alignment E values were calculated using the NCBI alignment tool. e, Similarity coefficients between caspase-11 and other murine caspases. f, Protein sequence alignment for murine caspases. The alignment diagram was generated using the alignment module of SnapGene software. g, Schematic indicating the different caspase-11C254A and caspase-9 chimeras used for co-immunoprecipitation experiments in 293T cells. All forms were fused to 3xFLAG tag in N-terminus.
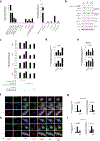
Figure 1.
Figure 1.. Bacterial mRNA and stimulatory LPS are both required for caspase-11 and noncanonical inflammasome activation.
a, Immunoblots of macrophage concentrated supernatants (20hr) or whole cell extracts (WCE, 6hr), and cytokine concentrations in culture supernatants (20hr) post-stimulation with live (L), heat-killed (HK) or HK E. coli supplemented with 10μg/mL total bacterial RNA (RNAtot) from E. coli or L. innocua. b, Electron microscopy on macrophages stimulated with L or HK E. coli for 8 or 12 hrs. Scale bar=2μm. c, Immunoblots and cytokine concentrations as in a and lactate dehydrogenase (LDH) release (pyroptosis) post-stimulation with L or HK E. coli, L. innocua or S. aureusΔSarΔAgr supplemented with their respective 100ng/mL bacterial mRNA, d, Immunoblots as in a post-stimulation with L E. coli grown in 2μg/mL Rifampicin for indicated times. e, Percentage live E. coli following Rifampicin treatment. f, Immunoblots, cytokine concentrations and LDH release as in c post-stimulation with L E. coli or L, HK or HK L. innocua supplemented with LPS and/or mRNA from E. coli or L. innocua. g, Immunoblots and cytokine concentrations as in a post-stimulation with L, HK or HK F. novicida or F. novicida ΔlpxF with 10μg/mL RNAtot from each bacterium. LDH measured by cytotoxicity assay; IL-1β, TNF and IL-6 by ELISA. Error bars, mean ± s.e.m. One-way ANOVA followed by multiple comparisons Sidak tests and p values indicated in bar graphs in a,g (n=4), c,f (n=3). ns: non-significant. Cleaved caspase-11 corresponds to caspase-11 p30. Bacteria:macrophage=20:1. Results represent at least 3 independent experiments.
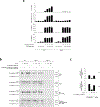
Figure 2.
Figure 2.. Low cytosolic concentration of LPS triggers noncanonical activation of the NLRP3 inflammasome when cytosolic bacterial mRNA is also present.
a-b, Immunoblots of macrophage concentrated supernatants (20hr) or WCE (6hr), and cytokine concentrations and LDH release in culture supernatants (20hr) as indicated following transfection of ultrapure LPS (low dose 2ng/mL or high dose 1μg/mL) +/− mRNA from E. coliLPSmut or in vitro transcribed (IVT) (100ng/mL), or transfection of LPS (2ng/mL) +/− mRNA from E. coli or eukaryotic cells (100ng/mL) (a), and transfection of wild-type (WT) or Nlrp3–/– macrophages with indicated doses of ultrapure LPS or mRNA from E. coliLPSmut, L. innocua, or IVT (b). Bacteria:macrophage ratio=20:1, except 50:1 for F. novicida. LDH measured by cytotoxicity assay; IL-1β, TNF and IL-6 by ELISA. Error bars, mean ± s.e.m. One-way ANOVA followed by multiple comparisons Sidak tests and p values indicated in bar graphs in a (IL-1β: n=4, LDH: n=3), and b (n=4). Cleaved caspase-11 corresponds to caspase-11 p30. Results represent at least 3 independent experiments.
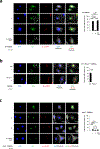
Figure 3.
Figure 3.. NLRP3 inflammasome assembly requires bacterial mRNA with LPS, irrespective of LPS stimulatory activity.
a-c, Immunoblots of macrophage cross-linked fractions and matching WCE (16hr), post-stimulation with L, HK or HK E. coli and E. coliLPSmut + mRNA from each bacterium (a), L, HK or HK Y. pestis grown at 24°C or 37°C + Y. pestis RNAtot (b), L, HK or HK E. coli + E. coli RNAtot (c). d,e, Immunoblots of macrophage concentrated supernatants (20hr) or WCE (6hr), and cytokine concentrations and LDH release in culture supernatants (20hr) post-stimulation with L, HK or HK E. coli or E. coliLPSmut +100ng/mL ultrapure LPS or 100ng/mL mRNA from each bacterium (d), and L, HK or HK Y. pestis grown at 24°C or 37°C +Y. pestis RNAtot (e). LDH measured by cytotoxicity assay; IL-1β, TNF and IL-6 by ELISA. f,g, Immunoblots of macrophage cross-linked fractions and matching WCE as in a, post-stimulation with L, HK or HK E. coli+IVT or L. innocua mRNA (f), and L, HK or HK E. coli+E. coli or L. innocua RNAtot, or E. coli mRNA or eukaryotic mRNA (g). h,i, Immunofluorescence confocal microscopy on macrophages stimulated for 16hr with L or HK Y. pestis grown at 24°C or 37°C (h), and L, HK or HK E. coliLPSmut + E. coliLPSmut RNAtot or untreated (i). Bar graphs in h,i, % cells exhibiting ASC speck. Inserts, magnification of indicated areas. White arrowheads, ASC specks. Phalloidin delineates the macrophage actin cytoskeleton. Scale bar=10μm. j,k, Immunoblots of macrophage cross-linked fractions and matching WCE as in a, post-stimulation with L, HK or HK E. coli or L. innocua + E. coli or L. innocua RNAtot with LPS or Lipid IVa as indicated. Error bars, mean ± s.e.m. One-way ANOVA followed by multiple comparisons Sidak tests and p values indicated in bar graphs in d (IL-1β: n=3, LDH: n=4), e (n=4), h (n=10) and i (Unst.: n=6, L: n=8, HK and HK+RNA: n=11). ns: non-significant. All macrophages are WT except as indicated in (c). Bacteria:macrophage=20:1. Results represent at least 3 independent experiments.
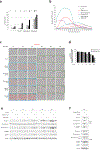
Figure 4.
Figure 4.. Requirement of NLRP3 and ASC for caspase-11 activation in response to live avirulent Gram-negative bacteria.
a-c, Immunoblots of macrophage concentrated supernatants (20hr) or WCE (6hr), and cytokine concentrations and LDH release in culture supernatants (20hr) post-stimulation of WT, Nlrp3–/– or Pycard–/– macrophages with L or HK E. coli (a), WT, Nlrp3–/– or Pycard–/– macrophages with L or HK avirulent or virulent E. coli (b), and WT, Nlrp3–/– or Ipaf–/– macrophages with Live Salmonella ΔSpi1/2 (avirulent, lacking the Salmonella pathogenicity islands 1 and 2 encoded type III secretion system) or WT (virulent) or Shigella BS103 (avirulent virulence plasmid cured) or WT (virulent) (note the doublet GSDMD bands here likely reflect the nature of the trigger) (c). d, Immunoblot of WT macrophage cross-linked fractions (16hr) post-stimulation with L, HK or HK E. coli supplemented with indicated doses of RNAtot, Flagellin or poly(dA:dT). e, Immunoblots of WT macrophage concentrated supernatants (20hr) or WCE (6hr), and cytokine concentrations in culture supernatants (20hr) post-stimulation as in d. LDH measured by cytotoxicity assay; IL-1β and IL-6 by ELISA. Error bars, mean ± s.e.m. One-way ANOVA followed by multiple comparisons Sidak tests and p values indicated in bar graphs in a, b, c and e (n=3). ns: non-significant. Bacteria:macrophage=20:1 for E. coli and virulent E. coli, 5:1 for all Salmonella and Shigella strains. Results represent at least 3 independent experiments.
Figure 5.
Figure 5.. Procaspase-11 protein is required for assembly of the NLRP3 inflammasome in response to avirulent Gram-negative bacteria.
a, Immunoblots of WT, Casp11–/– or Casp1–/– macrophage concentrated supernatants (20hr) or WCE (6hr), and cytokine concentrations and LDH release in culture supernatants (20hr) post-stimulation with L, HK or HK E. coli supplemented with E. coli RNAtot. LDH release measured by cytotoxicity assay; IL-1β and IL-6 by ELISA. b, Immunoblot of WT, Casp11–/– or Casp1–/– macrophage cross-linked fractions (16hr) post-stimulation with L E. coli. c, Immunoblots of WT, Casp11–/– or Casp1–/– macrophage concentrated supernatants (20hr) (top panels) or cross-linked fractions (16hr) (bottom panels) post-stimulation with L, HK or HK E. coli supplemented with E. coli RNAtot or poly(dA:dT). d, Immunofluorescence confocal microscopy on WT, Casp11–/– or Casp1–/– macrophages stimulated for 16hr with L E. coli RFP. Bar graph, % cells exhibiting ASC speck. Inset shows magnification of indicated area. White arrowhead points to ASC speck. Phalloidin delineates the macrophage actin cytoskeleton. Scale bar=10μm. Error bars, mean ± s.e.m. One-way ANOVA followed by multiple comparisons Sidak tests and p values indicated in bar graphs in a (IL-1β, WT and Casp1–/– : n=3, Casp11–/– : n=4; LDH, n=3) and d (WT: n=6, Casp11–/– : n=7, Casp1–/– : n=8). ns: non-significant. Bacteria:macrophage=20:1. Results represent at least 3 independent experiments.
Figure 6.
Figure 6.. Coincident detection of bacterial RNA and LPS triggers a procaspase-11-NLRP3 interaction irrespective of LPS stimulatory activity.
a, Immunofluorescence confocal microscopy on macrophages stimulated for 16hr with L or HK E. coli. Scale bar=10μm. For 3-color merges, magnification of indicated areas shown as insets to the right. Bar graphs, % cells with caspase-11-NLRP3-TGN38 colocalization. Error bars, mean ± s.e.m. One-way ANOVA followed by multiple comparisons Sidak tests were performed and P values are indicated in bar graphs (Unst.: n=10, L: n=9, HK: n=7). ns: non-significant. b-j, Immunoprecipitation (IP) of endogenous caspase-11, NLRP3 or AIM2 as indicated, and immunoblotting for coimmunoprecipitating proteins or WCE proteins from WT macrophages stimulated for 12hr with L, HK or HK Y. pestis (grown at 24°C) or F. novicida ΔlpxF supplemented with RNAtot from each bacterium (b), 12hr with L, HK or HK E. coli or E. coliLPSmut supplemented with E. coli RNAtot or E. coliLPSmut RNAtot, respectively (c), 4hr with L E. coli or after transfection with indicated doses of ultrapure LPS and E. coliLPSmut RNAtot +/− prior 12–16hr priming with 1μg/mL poly(I:C) (d), 12hr with L, HK or HK E. coli in combination with E. coli RNAtot or poly(dA:dT) (e), 3hr or 12hr with L or HK E. coli or virulent E. coli, (f,g), 12hr with L E. coli or L, HK or HK L. innocua supplemented with E. coli or L. innocua RNAtot (h-j), concomitant with LPS (h,i) or Lipid IVa (j) stimulation as indicated. All immunoblotted proteins are according to the labels to left of immunoblot panels. Bacteria:macrophage=20:1. Results represent at least 3 independent experiments.
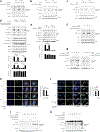
Figure 7.
Figure 7.. Procaspase-11-NLRP3 interaction is upstream of NLRP3 inflammasome assembly and activation.
a, Immunoblots of macrophage concentrated supernatants (20hr) or WCE (6hr) as indicated post-stimulation of WT and Gsdmd–/– macrophages with L, HK or HK E. coli supplemented with E. coli RNAtot. b-e, Immunoprecipitation (IP) of endogenous caspase-11 or NLRP3 as indicated, and immunoblotting for coimmunoprecipitating and WCE proteins at 12hr post-stimulation of WT and Gsdmd–/– macrophages with L, HK or HK E. coli + E. coli RNAtot (b), WT macrophages with L or HK E. coli with or without caspases inhibition with 10μg/mL zVAD-FMK before stimulation with bacteria (c), WT macrophages with L or HK E. coli (d), and WT, Pycard–/– and Casp1–/– macrophages with L or HK E. coli supplemented with E. coli RNAtot (e). All immunoblotted proteins are according to the labels to left of immunoblot panels. Bacteria:macrophage=20:1. Results represent at least 3 independent experiments.
Figure 8.
Figure 8.. Procaspase-11-NLRP3 interaction is mediated by the caspase-11 SCAF domain and NLRP3 LRR and PYD domains.
a, Immunoprecipitation and immunoblotting for coimmunoprecipitating and WCE proteins of overexpressed FLAG-casp-11C254A FL, FLAG-casp-11C254A ΔCARD or FLAG-casp-11C254A ΔSCAF with or without HA-NLRP3FL in 293T cells at 24hr post transfection. b, Immunoprecipitation and immunoblotting for coimmunoprecipitating and WCE proteins of overexpressed FLAG-caspase11–9 CARD-SCAF chimeras with or without HA-NLRP3FL in 293T cells as in a. c, Immunoprecipitation and immunoblotting for coimmunoprecipitating and WCE proteins of overexpressed HA-NLRP3 either as NLRP3FL, NLRP3ΔPYD, NLRP3ΔLRR, NLRP3ΔNACHT ΔLRR or NLRP3ΔNACHT ΔPYD with or without FLAG-casp-11C254A FL, in 293T cells as in a. All immunoblotted proteins and MW according to a protein standard are indicated to left of each immunoblot panel. Bacteria:macrophage=20:1. Results represent at least 3 independent experiments.

Comment in

Similar articles

Cited by

References

    1. Hagar JA, Powell DA, Aachoui Y, Ernst RK & Miao EA Cytoplasmic LPS activates caspase-11: implications in TLR4-independent endotoxic shock. Science 341, 1250–1253 (2013). - PMC - PubMed
    1. Kayagaki N et al. Noncanonical inflammasome activation by intracellular LPS independent of TLR4. Science 341, 1246–1249 (2013). - PubMed
    1. Shi J et al. Inflammatory caspases are innate immune receptors for intracellular LPS. Nature 514, 187–192 (2014). - PubMed
    1. Broz P & Dixit VM Inflammasomes: mechanism of assembly, regulation and signalling. Nat Rev Immunol 16, 407–420 (2016). - PubMed
    1. Broz P, Pelegrin P & Shao F The gasdermins, a protein family executing cell death and inflammation. Nat Rev Immunol 20, 143–157 (2020). - PubMed

Publication types