Construction of a Novel LncRNA Signature Related to Genomic Instability to Predict the Prognosis and Immune Activity of Patients With Hepatocellular Carcinoma
- PMID: 35479067
- PMCID: PMC9037030
- DOI: 10.3389/fimmu.2022.856186
Construction of a Novel LncRNA Signature Related to Genomic Instability to Predict the Prognosis and Immune Activity of Patients With Hepatocellular Carcinoma
Abstract
Background: Genomic instability (GI) plays a crucial role in the development of various cancers including hepatocellular carcinoma. Hence, it is meaningful for us to use long non-coding RNAs related to genomic instability to construct a prognostic signature for patients with HCC.
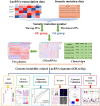
Methods: Combining the lncRNA expression profiles and somatic mutation profiles in The Cancer Genome Atlas database, we identified GI-related lncRNAs (GILncRNAs) and obtained the prognosis-related GILncRNAs through univariate regression analysis. These lncRNAs obtained risk coefficients through multivariate regression analysis for constructing GI-associated lncRNA signature (GILncSig). ROC curves were used to evaluate signature performance. The International Cancer Genomics Consortium (ICGC) cohort, and in vitro experiments were used for signature external validation. Immunotherapy efficacy, tumor microenvironments, the half-maximal inhibitory concentration (IC50), and immune infiltration were compared between the high- and low-risk groups with TIDE, ESTIMATE, pRRophetic, and ssGSEA program.
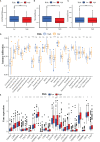
Results: Five GILncRNAs were used to construct a GILncSig. It was confirmed that the GILncSig has good prognostic evaluation performance for patients with HCC by drawing a time-dependent ROC curve. Patients were divided into high- and low-risk groups according to the GILncSig risk score. The prognosis of the low-risk group was significantly better than that of the high-risk group. Independent prognostic analysis showed that the GILncSig could independently predict the prognosis of patients with HCC. In addition, the GILncSig was correlated with the mutation rate of the HCC genome, indicating that it has the potential to measure the degree of genome instability. In GILncSig, LUCAT1 with the highest risk factor was further validated as a risk factor for HCC in vitro. The ESTIMATE analysis showed a significant difference in stromal scores and ESTIMATE scores between the two groups. Multiple immune checkpoints had higher expression levels in the high-risk group. The ssGSEA results showed higher levels of tumor-antagonizing immune cells in the low-risk group compared with the high-risk group. Finally, the GILncSig score was associated with chemotherapeutic drug sensitivity and immunotherapy efficacy of patients with HCC.
Conclusion: Our research indicates that GILncSig can be used for prognostic evaluation of patients with HCC and provide new insights for clinical decision-making and potential therapeutic strategies.
Keywords: genomic instability; hepatocellular carcinoma; immune infiltration; long non-coding RNAs; prognosis; signature; tumor immune activity.
Copyright © 2022 Zhu, Huang, Liu, Peng, Xue, Feng, Huang, Chen, Lai, Ji, Wang and Yuan.
Conflict of interest statement
The authors declare that the research was conducted in the absence of any commercial or financial relationships that could be construed as a potential conflict of interest.
Figures


Similar articles
-
Construction of a genome instability-derived lncRNA-based risk scoring system for the prognosis of hepatocellular carcinoma.Aging (Albany NY). 2021 Nov 18;13(22):24621-24639. doi: 10.18632/aging.203698. Epub 2021 Nov 18. Aging (Albany NY). 2021. PMID: 34799469 Free PMC article.
-
A Mutation-Related Long Noncoding RNA Signature of Genome Instability Predicts Immune Infiltration and Hepatocellular Carcinoma Prognosis.Front Genet. 2021 Nov 22;12:779554. doi: 10.3389/fgene.2021.779554. eCollection 2021. Front Genet. 2021. PMID: 34880908 Free PMC article.
-
Construction and validation of somatic mutation-derived long non-coding RNAs signatures of genomic instability to predict prognosis of hepatocellular carcinoma.World J Gastrointest Surg. 2024 Mar 27;16(3):842-859. doi: 10.4240/wjgs.v16.i3.842. World J Gastrointest Surg. 2024. PMID: 38577085 Free PMC article.
-
Ferroptosis-related long non-coding RNA signature predicts the prognosis of hepatocellular carcinoma: A Review.Medicine (Baltimore). 2022 Nov 25;101(47):e31747. doi: 10.1097/MD.0000000000031747. Medicine (Baltimore). 2022. PMID: 36451456 Free PMC article. Review.
-
The Expressions and Functions of lncRNA Related to m6A in Hepatocellular Carcinoma from a Bioinformatics Analysis.Comput Math Methods Med. 2022 Oct 12;2022:1395557. doi: 10.1155/2022/1395557. eCollection 2022. Comput Math Methods Med. 2022. PMID: 36276996 Free PMC article. Review.
Cited by
-
Mechanisms of immune checkpoint inhibitors: insights into the regulation of circular RNAS involved in cancer hallmarks.Cell Death Dis. 2024 Jan 4;15(1):3. doi: 10.1038/s41419-023-06389-5. Cell Death Dis. 2024. PMID: 38177102 Free PMC article. Review.
-
Advancing prognostic understanding in hepatocellular carcinoma through the integration of genomic instability and lncRNA signatures: GILncSig model.World J Gastrointest Surg. 2024 Sep 27;16(9):2774-2777. doi: 10.4240/wjgs.v16.i9.2774. World J Gastrointest Surg. 2024. PMID: 39351545 Free PMC article.
-
Identification of cuproptosis-related lncRNA prognostic signature for osteosarcoma.Front Endocrinol (Lausanne). 2022 Oct 13;13:987942. doi: 10.3389/fendo.2022.987942. eCollection 2022. Front Endocrinol (Lausanne). 2022. PMID: 36313774 Free PMC article.
-
Long non-coding RNA signature for predicting gastric cancer survival based on genomic instability.Aging (Albany NY). 2023 Dec 20;15(24):15114-15133. doi: 10.18632/aging.205336. Epub 2023 Dec 20. Aging (Albany NY). 2023. PMID: 38127056 Free PMC article.
-
Identification of a bile acid and bile salt metabolism-related lncRNA signature for predicting prognosis and treatment response in hepatocellular carcinoma.Sci Rep. 2023 Nov 9;13(1):19512. doi: 10.1038/s41598-023-46805-6. Sci Rep. 2023. PMID: 37945918 Free PMC article.
References
Publication types
MeSH terms
Substances
LinkOut - more resources
Full Text Sources
Medical

