. 2022 Apr 27;13(1):2274.
doi: 10.1038/s41467-022-29979-x.

The timing of differentiation and potency of CD8 effector function is set by RNA binding proteins

Affiliations

The timing of differentiation and potency of CD8 effector function is set by RNA binding proteins

Georg Petkau et al. Nat Commun. .

Abstract

CD8+ T cell differentiation into effector cells is initiated early after antigen encounter by signals from the T cell antigen receptor and costimulatory molecules. The molecular mechanisms that establish the timing and rate of differentiation however are not defined. Here we show that the RNA binding proteins (RBP) ZFP36 and ZFP36L1 limit the rate of differentiation of activated naïve CD8+ T cells and the potency of the resulting cytotoxic lymphocytes. The RBP function in an early and short temporal window to enforce dependency on costimulation via CD28 for full T cell activation and effector differentiation by directly binding mRNA of NF-κB, Irf8 and Notch1 transcription factors and cytokines, including Il2. Their absence in T cells, or the adoptive transfer of small numbers of CD8+ T cells lacking the RBP, promotes resilience to influenza A virus infection without immunopathology. These findings highlight ZFP36 and ZFP36L1 as nodes for the integration of the early T cell activation signals controlling the speed and quality of the CD8+ T cell response.


Conflict of interest statement

The authors declare no competing interests.

Figures
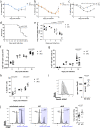
Fig. 1
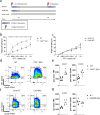
Fig. 1. ZFP36 and ZFP36L1 limit the anti-viral CD8+ T cell effector response.
Body weight loss of initial body weight (100%) in (a) ZFP36 KO; (b) ZFP36L1 KO; or (c) dKO mice compared with age matched WT mice. a, b Show combined data from two independent experiments with WT n = 10, ZFP36KO n = 11 in (a) and WT n = 9, ZFP36L1KO n = 10 in (b); for (c) data is combined from four experiments with a total n = 20 per genotype. Statistical significance determined by two-way ANOVA followed by Sidak’s multiple-comparisons test: Error bars indicate SEM. d Survival curve of WT and dKO mice infected with a lethal dose of influenza A virus; n = 14 per genotype combined from two independent experiments. Statistical significance was tested by Mantel Cox rank test. e Viral-load in the lungs of mice following sub-lethal IAV infection. n = 9 per genotype for day 4 and 7, n = 5 for day 8, and n = 10 per genotype for day 10; Statistical significance was determined using a two-way ANOVA on log transformed data followed by Sidak’s multiple-comparisons test. Adjusted p values and p value for the main Genotype effect are shown. f, g Absolute and relative numbers of virus specific CD8+ T cells in lungs of mice on indicated days after infection. Data is compiled from three independent experiments. h Frequency of GzmB positive CD8+ T cells recovered from lungs on different days after infection. Statistical significance in (fh) was determined by mixed-effects model followed by Sidak’s multiple-comparisons test. i Left) Representative overlay flow cytometry plot of GzmB staining in CD8+ T cells on day 10 post infection. Open histogram represents WT and filled histogram dKO cells. Right panel: summary data for GzmB staining. Statistical significance determined by a two-tailed unpaired Student’s t-test. j In vivo cytotoxicity assay: Representative histograms showing proportions of labelled cells following transfer into uninfected C57BL/6 mouse (PBS) or day 10 IAV infected mice of the indicated genotype. Statistical significance determined by a two-tailed unpaired Student’s t-test. In all panels closed circles represent the WT group and open circles the dKO. Source Data are provided as Source Data file.
Fig. 2
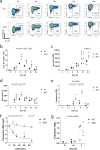
Fig. 2. Suppression of effector cell differentiation and function mediated by ZFP36 and ZFP36L1 is cell intrinsic.
a Bodyweight loss of WT mice which received 200 WT or dKO naïve OT-I cells the day before infection with a sublethal dose of WSN-OVA virus. Data is compiled from four independent experiments with the following number of mice per day: day 0-3 WT n = 12, dKO n = 11; day 4-8 WT n = 29, dKO n = 30; day 9 WT n = 20, dKO n = 23; Statistical significance was tested using two-way ANOVA followed by Sidak’s post-test for multiple comparisons; error bars indicate SEM. b Numbers of OVA257–264 peptide tetramer-binding CD8+ T cells in the lung and spleen of CD45.1 recipient mice following transfer of WT or dKO OT-I CD8+ T cells on day 10 post IAV infection. c Representative flow cytometry and frequencies showing relative abundance of MPEC and SLEC among transferred OT-I cells recovered from lungs on day 10 post infection. Data is compiled from two independent experiments. Representative flow cytometry and frequencies of TNF and IFNγ producing OT-I cells in (d) lung and (e) spleen 10 days after infection. Representative flow cytometry plot and frequencies of GzmB positive cells among OT-I cells in the lung (f) and spleens (g) 10 days after infection. Data is compiled from two independent experiments. Statistical significance in panels (bg) was tested using a two-tailed unpaired Student’s t-test. In all panels closed circles are the WT group and open circles the dKO group with each symbol representing data from an individual mouse. Source Data are provided as Source Data file.
Fig. 3
Fig. 3. ZFP36 and ZFP36L1 determine the CD8 effector program early after T cell activation.
a Experimental design: In WT cells or cells transduced with non-targeting guides the ZFP36 and ZFP36L1 proteins are transiently expressed after T cell activation prior to transduction as well as upon restimulation of CTL. Cells which have undergone Cas9 mediated deletion of ZFP36 and ZFP36L1 lack both proteins upon restimulation but not during the initial activation period. CD4cre mediated deletion generates naïve CD8+ T cells which lack ZFP36 and ZFP36L1 during initial activation and re-stimulation. b In vitro killing of N4 peptide loaded EL4 cells after three hours at indicated CTL to EL4 ratios, using CTLs with CD4cre mediated deletion of ZFP36 and ZFP36L1 (n = 6) and WT CTLs (n = 7). c Killing assay using CTLs which were transduced with non-targeting guides (n = 3) or guides targeting both ZFP36 and ZFP36L1 (n = 3) is shown. For (b) and (c) data is represented as mean values ± SD. Statistical significance was determined by one-way ANOVA followed by Tukey’s test for multiple comparisons. d Representative flow cytometry plots showing GzmB and TNF expression in CTLs after three hours of WT and CD4cre dKO CTL exposure to peptide loaded EL4 cells at a 1:1 ratio. e Plots showing geometric mean fluorescence intensity for GzmB and TNF as in (d), gated on the positive population. Each dot represents a biological replicate from four independent experiments. f Representative flow cytometry plots showing GzmB and TNF expression in CTLs treated with non-targeting and ZFP36 and ZFP36L1 specific guides, after three hours of exposure to peptide loaded EL4 cells at a 1:1 ratio. g Plots showing geometric mean fluorescence intensity for GzmB and TNF as in (f), gated on the positive population. For sgRNAs targeting ZFP36 and ZFP36L1 or non-targeting controls the data is representative of two independent experiments, each with three independent pairs of sgRNAs. Statistical significance was determined by a two-tailed unpaired Students t-test. In all panels filled circles represent the respective WT control and open shaded circles the dKO. Source Data are provided as Source Data file.
Fig. 4
Fig. 4. Dynamic gene expression networks targeted by ZFP36 and ZFP36L1 early after CD8+ T cell activation.
a Overlap of transcripts significantly differentially expressed (adjusted p value <= 0.05) by log2 FC > 1.3 or < −1.3, following activation of naive CD8+ T cells for 6 or 18 h (analysed by DESeq2; Wald test followed by Benjamini–Hochberg correction for adjusted p values) with CLIP targets of ZFP36 and ZFP36L1. b Clusters I-III showing ZFP36 family mRNA target dynamics during T-cell activation. Dotted line shows log2 FC = 1.3. Source Data are provided as Source Data file.
Fig. 5
Fig. 5. ZFP36 and ZFP36L1 suppress IL-2 production.
a Representative flow cytometry plots showing IL-2 and CD25 staining intensity by naive OT-I cells stimulated with N4 peptide for the indicated times. b A plot showing frequency of IL-2 producing OT-I cells over time; (c) Geometric mean of CD25 fluorescence per cell over time. d Geometric mean of IL-2 fluorescence per cell over time. Graphs in (ad), are compiled from three independent experiments. Each point represents a biological replicate. e Relative quantity of IL2 mRNA expression measured by real time PCR, in naive WT and dKO OT-I cells which were stimulated for the indicated times with N4 peptide. Relative quantities of IL2 mRNA to RPL32 mRNA are shown. f Relative quantity of IL2 mRNA expression, measured by real time PCR, in naive WT and dKO OT-I cells stimulated for 3 h with N4 peptide and treated with Triptolide for indicated times. A linear regression model of one phase decay was fitted on the data. Data is presented as mean values ± SD from n = 3 biological replicates. Statistical significance was determined on non-transformed data. g Relative quantity of unprocessed IL2 pre-mRNA expression in naive WT and dKO OT-I cells stimulated with N4 peptide for indicated times. IL2 pre-mRNA expression was normalized to RPL32 mRNA expression. Each point represents a biological replicate. Statistical significance in (bg) was determined using a mixed-effects model analysis followed by Sidak’s post-test for multiple comparisons. In all panels filled circles represent the respective WT control and open shaded circles dKO. Source Data are provided as Source Data file.
Fig. 6
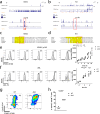
Fig. 6. ZFP36 and ZFP36L1 limit the early expression of transcription factors driving effector differentiation.
a CLIP data showing sequencing reads across (a) Nfkb2 and (b) Rel transcripts (a set of top two lanes) with an expanded view of the 3ʹUTR (a set of bottom two lanes). In each set top lane shows ZFP36L1 CLIP data from OT-I CD8 CTLs stimulated for 3 h with N4 peptide; bottom lane shows ZFP36 CLIP data from in vitro activated naive CD4 T cells. TATTTA motifs are identified in orange; (c, d) conservation among vertebrates of the ZFP36/ZFP36L1 binding site determined using MULTIZ alignment tool in UCSC genome browser for (c) Nfkb2 and (d) Rel. Binding as identified by CLIP is highlighted in yellow. Selected species are ordered from top to bottom according the evolutionary proximity of the clades. Red bracket highlights the ARE. For Rel the best conserved binding site is displayed. e Differential protein expression of NF-κB2 and (f) cREL by naive CD8+ T cells following activation with plate bound anti-CD3 antibody. Representative flow cytometry histograms (left panel) and geometric mean fluorescence (right panel) are shown. Open histograms represent WT and filled histograms show dKO cells. Statistical significance was determined using a mixed-effects model analysis followed by Sidak’s test for multiple comparisons. Data is compiled from two of three independent experiments, with each dot representing a biological replicate. g Flow cytometry plots showing expression of EOMES and GzmB by naive WT and dKO CD8+ T cells activated with plate bound CD3 for 72 h. h Frequency of GzmB and EOMES expressing cells. Statistical significance was tested with a two-tailed unpaired Student’s t-test. Data is compiled from two independent experiments and three biological replicates. In all panels filled circles represent the respective WT control and open shaded circles dKO. Source Data are provided as Source Data file.
Fig. 7
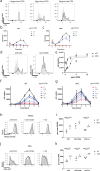
Fig. 7. ZFP36 and ZFP36L1 promote CD28 costimulation dependence for activation.
a CTV dilution by WT (open histograms) and dKO (filled histograms) T cells stimulated for 72 h, with indicated concentrations of anti CD3 plate bound antibody. b, c Total numbers of cells recovered per generation after 72 h of stimulation with anti CD3 antibodies. Data from n = 3 biological replicates is presented as mean values ± SD. d CTV dilution by WT and dKO T cells after 72 h in the presence of 5 µg/ml plate bound anti CD3 (left panel) and with the addition of 10 µg/ml plate bound anti CD28 (right panel). e Total numbers of cells recovered with varying amounts of CD28 plate bound added to 5 µg/ml plate bound CD3. Error bars indicate the SEM from three biological replicates. Non-linear regression model was fitted on the data. f Cell numbers per generation after 72 h with plate bound anti CD3 and varying amounts of plate bound anti-CD28 from WT and (g) dKO T cells. Data from n = 3 biological replicates is presented as mean values ± SD. h, i Representative histograms and geometric mean fluorescence showing expression of NF-κB2 and (j, k) IRF8 in naive CD8+ T cells after 24 h stimulation with plate bound anti-CD3 in the presence or absence of soluble recombinant IL-2 or plate bound anti-CD28. Open histograms represent WT and filled histograms show dKO cells. Each symbol represents a biological replicate. Statistical significance was determined with two-way ANOVA with Sidak’s correction for multiple testing. In all panels filled circles represent the respective WT control and open shaded circles dKO. Source Data are provided as Source Data file.

Similar articles

Cited by

References

    1. Bennett TJ, Udupa VAV, Turner SJ. Running to stand still: naive CD8+ T cells actively maintain a program of quiescence. IJMS. 2020;21:9773. doi: 10.3390/ijms21249773. - DOI - PMC - PubMed
    1. Gett AV, Sallusto F, Lanzavecchia A, Geginat J. T cell fitness determined by signal strength. Nat. Immunol. 2003;4:355–360. doi: 10.1038/ni908. - DOI - PubMed
    1. Hünig, T., Beyersdorf, N. & Kerkau, T. CD28 co-stimulation in T-cell homeostasis: a recent perspective. ITT 111 10.2147/ITT.S61647 (2015). - PMC - PubMed
    1. Obst, R. The timing of T cell priming and cycling. Front. Immunol. 6, 563 (2015). - PMC - PubMed
    1. Zehn D, Lee SY, Bevan MJ. Complete but curtailed T-cell response to very low-affinity antigen. Nature. 2009;458:211–214. doi: 10.1038/nature07657. - DOI - PMC - PubMed

Publication types

MeSH terms