. 2022 Apr 26;18(4):e1010453.
doi: 10.1371/journal.ppat.1010453. eCollection 2022 Apr.

Reduced IRF4 expression promotes lytic phenotype in Type 2 EBV-infected B cells

Affiliations

Reduced IRF4 expression promotes lytic phenotype in Type 2 EBV-infected B cells

Jillian A Bristol et al. PLoS Pathog. .

Abstract

Humans are infected with two types of EBV (Type 1 (T1) and Type 2 (T2)) that differ substantially in their EBNA2 and EBNA 3A/B/C latency proteins and have different phenotypes in B cells. T1 EBV transforms B cells more efficiently than T2 EBV in vitro, and T2 EBV-infected B cells are more lytic. We previously showed that both increased NFATc1/c2 activity, and an NFAT-binding motif within the BZLF1 immediate-early promoter variant (Zp-V3) contained in all T2 strains, contribute to lytic infection in T2 EBV-infected B cells. Here we compare cellular and viral gene expression in early-passage lymphoblastoid cell lines (LCLs) infected with either T1 or T2 EBV strains. Using bulk RNA-seq, we show that T2 LCLs are readily distinguishable from T1 LCLs, with approximately 600 differentially expressed cellular genes. Gene Set Enrichment Analysis (GSEA) suggests that T2 LCLs have increased B-cell receptor (BCR) signaling, NFAT activation, and enhanced expression of epithelial-mesenchymal-transition-associated genes. T2 LCLs also have decreased RNA and protein expression of a cellular gene required for survival of T1 LCLs, IRF4. In addition to its essential role in plasma cell differentiation, IRF4 decreases BCR signaling. Knock-down of IRF4 in a T1 LCL (infected with the Zp-V3-containing Akata strain) induced lytic reactivation whereas over-expression of IRF4 in Burkitt lymphoma cells inhibited both NFATc1 and NFATc2 expression and lytic EBV reactivation. Single-cell RNA-seq confirmed that T2 LCLs have many more lytic cells compared to T1 LCLs and showed that lytically infected cells have both increased NFATc1, and decreased IRF4, compared to latently infected cells. These studies reveal numerous differences in cellular gene expression in B cells infected with T1 versus T2 EBV and suggest that decreased IRF4 contributes to both the latent and lytic phenotypes in cells with T2 EBV.


Conflict of interest statement

The authors have declared that no competing interests exist.

Figures
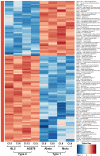
Fig 1
Fig 1. Comparison of cellular transcripts in Type 1 EBV versus Type 2 EBV infected lymphoblastoid cell lines.
The top 100 differentially expressed cellular genes in the RNA-seq analysis are shown. Names for each cell line, as well as the EBV type and strain are shown. Red indicates a gene is upregulated in corresponding cells and blue indicates it is down-regulated.
Fig 2
Fig 2. EBV gene expression in T2 virus- versus T1 virus-infected LCLs.
RNA-seq reads from LCLs infected with T1 or T2 viruses were aligned to the T1 or T2 EBV genomes, respectively. For each replication, wiggle tracks of normalized read depth are displayed using the UCSC genome browers. Annotation tracks for type 1 and type 2 virues showing latent (blue) genes and lytic (red) genes are displayed above.
Fig 3
Fig 3. Gene set enrichment analysis (GSEA) using Hallmark gene sets.
GSEA comparing T1 versus T2 LCL gene expression was performed using the different Hallmark gene set collection from MSigDB; positive enrichment scores correspond to gene sets enriched in T2 LCL upregulated genes and negative enrichement scores correspond to gene sets enriched in genes upregulated in T1 LCLs. Blue bars are significant with FDR<0.05.
Fig 4
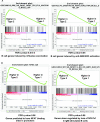
Fig 4. Gene set enrichment analysis (GSEA) suggests increased BCR and NFAT signaling in Type 2 LCLs.
(A) GSEA plots for the “Pre versus day 7 post TIV flu vaccine B cell up”, and “unstimulated versus anti-IGM stimulated B cells 24 hours up” (B). GSEA plots for “NFAT_Q6” and “WT versus NFATC1 KO 3 hour anti-IGM stimulation B cell down”.
Fig 5
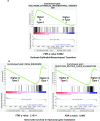
Fig 5. Gene set enrichment analysis (GSEA) suggests increased EMT in Type 2 LCLs.
(A) GSEA plot for “Hallmark mesenchymal epithelial cell transition.” (B). GSEA plots for “KEGG_RIBOSOME” and “REACTOME_PEPTIDE_CHAIN_ELONGATION”.
Fig 6
Fig 6. Type 2 LCLs express higher levels of ITGAX (CD11C) and NFAT inhibitors reverse this effect.
A) The level of surface CD11c expression on various Type 2 LCLs versus Type 1 LCLs was measured by flow cytometry using antibodies directed against CD11C or a control isotype antibody, as indicated. Quantification of the results is also shown (RU, relative units of CD11C mean fluorescence intensity per cell, with isotype control fluorescence subtracted). B) T1 or T2 LCLs were treated with NFAT inhibitory drugs, cyclosporin or FK506, or vehicle control for 15 days. Immunoblot was performed to examine expression levels of the CD11C protein, caspase 1, the EBV lytic protein Z, and loading control actin as indicated. C) Using the same cell lysates shown in Fig 5B, immunoblot was performed to examine expression of cellular protein ENPP2.
Fig 7
Fig 7. T2 LCLs express lower levels of IRF4 and EBF1 compared T1 LCLs.
Immunoblot analyses were performed to compare the protein expression levels of IRF4 (A) or EBF1 and Z (B) in T1 versus T2 LCLs as indicated (using the same cell lysates). Tubulin was used as loading control. The numbers below the IRF4 immunoblot quantify the results using Image Studio Lite software to normalize the level of IRF4 expression to tubulin expression. Results are presented as the ratio of IRF4 expression relative to tubulin, in T2 cells (averaged) relative to T1 cells (averaged). The T1 IRF4 value is set as 1. The transcript expression of IRF4 (as determined by RNA-seq) is also shown for various different Type 1 and Type 2 LCL lines, along with the log2FC fold change in gene expression in T2 versus T1 cell lines, and the adjusted p value.
Fig 8
Fig 8. Genes upregulated by IRF4 knockdown in Type 1 LCLs are enriched in unedited Type 2 versus Type 1 LCLs.
Gene Set Enrichment Analysis (GSEA) was performed on the bulk Type 2 versus Type 1 LCLs using a gene set constructed from previously published findings of genes upregulated in Type 1 LCLs targeted by IRF4 sgRNAs compared to control sgRNAs by CRISPR/Cas9 [39].
Fig 9
Fig 9. IRF4 suppresses lytic EBV reactivation.
(A) Akata LCLs were infected with lentiviruses expressing IRF4 targeted shRNAs or a control shRNA vector, selected with puromycin for 7 days, and then immunoblot analysis was performed to detect expression of IRF4, the lytic viral proteins BZLF1 (Z), BRLF1 (R), BMRF1, or tubulin as indicated. The numbers below each immunoblot quantify the results using Image Studio Lite software to normalize the levels of IRF4, R, BMRF1, and Z expression to tubulin expression. Results are presented as the ratio of IRF4, R, BMRF1, and Z expression relative to tubulin in shIRF4 cells relative to vector control (pLKO) cells. Vector control values are set as 1. (B) EBV positive Akata Burkitt lymphoma cells were stably infected with pLKO (vector control) or IRF4 lentiviruses. Both Akata BL lines were treated with or without anti-IgG for 24 hours to induce BCR signaling, and then harvested for immunoblot to detect expression of the lytic viral proteins Z, R, and BMRF1, IRF4, and tubulin loading control as indicated. (C) EBV negative BJAB Burkitt cells were nucleofected with a full-length Z promoter-luciferase construct and either vector control, an LMP2A expression vector, an IRF4 expression vector, or both LMP2A and IRF4 expression vectors and luciferase assays were performed 2 days later. The experiment was performed in triplicate and repeated twice with similar results. The amount of luciferase activity produced by each condition in one experiment is shown in the left panel. Immunoblot analysis of the LMP2A, IRF4, and tubulin proteins in each condition shown in the luciferase assay is shown in the right panel.
Fig 10
Fig 10. IRF4 inhibits NFATc1 and NFATc2 expression.
(A) EBV positive or negative Akata BLs stably infected with pLKO (vector control) or IRF4 lentiviruses were treated with or without anti-IgG for 30 minutes and then harvested for immunoblot to detect expression of NFATc1, NFATc2, phospho-ERK, and tubulin loading control as indicated. (B) EBV-negative BJAB B cells were nucleofected with vector control, an LMP2A expression vector or an IRF4 expression vector as indicated then harvested after 48 hours for immunoblot analysis of the NFATc1, NFATc2, IRF4, LMP2A, and actin proteins. The numbers below the NFATc1 and NFATc2 immunoblots quantify the results using Image Studio Lite software to normalize the levels of NFATc1 and NFATc2 expression to actin expression. Results are presented as the ratio of NFATc1 and NFATc2 expression relative to actin for each condition, then averaged for each duplicate, and divided by the vector control values. Vector control values are set as 1.
Fig 11
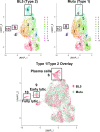
Fig 11. Both T1 and T2 LCLs can be separated into 11 separate clusters in scRNA-seq analysis.
Single cell projection onto 2 UMAP dimensions using high dimensional reduction (see Materials and Methods) separated by BL5 and Mutu samples (top) as well as together (bottom) with overlaid different colors are shown.
Fig 12
Fig 12. Both T1 and T2 LCLs can be separated into 11 separate clusters in scRNA-seq analysis.
4,879 BL5 and 5,124 Mutu cells analyzed after QC filtering (see Materials and Methods) were distributed across 11 clusters; frequencies of 11 clusters in Mutu and BL5 samples are shown.
Fig 13
Fig 13. BZLF1 (lytic gene expression) is limited to clusters 9 and 10, whereas latent proteins EBNA2 and LMP1 are expressed more broadly.
Expression values are based on log normalized counts. LMP1/BNFL2B expression (overlapping transcripts) was log transformed and averaged to show grouped expression and overcome 3’ prime bias with LMP1.
Fig 14
Fig 14. Cluster 10 is much more lytic than cluster 9.
A dot plot representing each of the EBV specific genes within the single cell analysis demonstrates lytic activation by scaled expression.
Fig 15
Fig 15. Gene expression analyses of Cluster 6.
Cluster 6, which was found to be enriched within the type 2 sample (Figs 11 and 12), has a gene expression signature of plasmablast-like cells (J chain, PRDM1, and XBP1 positive, and PAX5 negative).
Fig 16
Fig 16. Gene expression analyses of Cluster 9.
Violin plot of log normalized expression level of the top 10 differentially expressed genes sorted by average log2FC from MAST method (see Materials and Methods) across 11 identified clusters for Cluster 9 are shown.
Fig 17
Fig 17. Gene expression analyses of Cluster 10.
Violin plot of log normalized expression level of the top 10 differentially expressed genes sorted by average log2FC from MAST method (see Materials and Methods) across 11 identified clusters for Cluster 10 are shown.
Fig 18
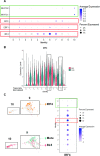
Fig 18. T2 LCLs have less IRF4 (Cluster 9) and more NFATc1 (Cluster 10) compared to latent cells, or T1 cells in Cluster 9. A.
Dot plot presentation of NFATc1/c2 expression across all 11 cell clusters. B. Violin plot presentation of IRF4 expression in all 11 clusters shown separately for the BL5 and Mutu samples. C. Overlaid UMAP for expression of IRF4 in Cluster 9 and 10 split by sample type and DotPlot of IRF4 across all 11 clusters.

Similar articles

Cited by

References

    1. Khan G, Hashim MJ. Global burden of deaths from Epstein-Barr virus attributable malignancies 1990–2010. Infect Agent Cancer. 2014;9: 38. doi: 10.1186/1750-9378-9-38 - DOI - PMC - PubMed
    1. Young LS, Yap LF, Murray PG. Epstein-Barr virus: more than 50 years old and still providing surprises. Nat Rev Cancer. 2016;16: 789–802. doi: 10.1038/nrc.2016.92 - DOI - PubMed
    1. Kieff E, Cohen JI, Longnecker R. Epstein-Barr Virus/Replication and Epstein-Barr Virus. 6th ed. In: Knipe DM, Howley PM, editors. Fields Virology. 6th ed. Philadelphia, PA: Lippincott Williams & Wilkins; 2013. pp. 1898–1959.
    1. Rosemarie Q, Sugden B. Epstein-Barr Virus: How Its Lytic Phase Contributes to Oncogenesis. Microorganisms. 2020;8: E1824. doi: 10.3390/microorganisms8111824 - DOI - PMC - PubMed
    1. Kenney SC, Mertz JE. Regulation of the latent-lytic switch in Epstein-Barr virus. Semin Cancer Biol. 2014;26: 60–68. doi: 10.1016/j.semcancer.2014.01.002 - DOI - PMC - PubMed

MeSH terms

Substances