

Accelerating Cardiac Diffusion Tensor Imaging With a U-Net Based Model: Toward Single Breath-Hold
- PMID: 35460138
- PMCID: PMC9790699
- DOI: 10.1002/jmri.28199
Accelerating Cardiac Diffusion Tensor Imaging With a U-Net Based Model: Toward Single Breath-Hold
Abstract
Background: In vivo cardiac diffusion tensor imaging (cDTI) characterizes myocardial microstructure. Despite its potential clinical impact, considerable technical challenges exist due to the inherent low signal-to-noise ratio.
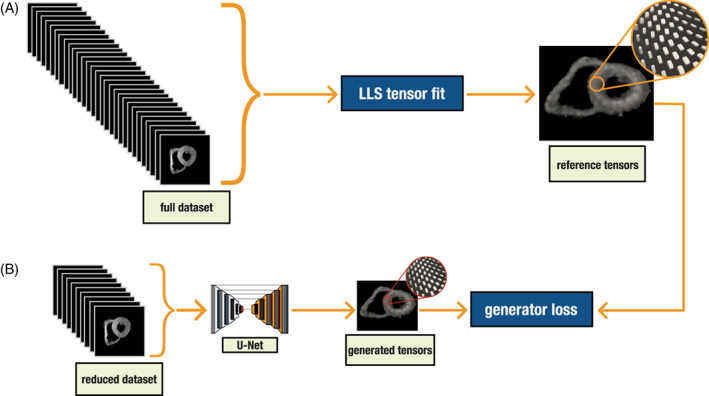
Purpose: To reduce scan time toward one breath-hold by reconstructing diffusion tensors for in vivo cDTI with a fitting-free deep learning approach.
Study type: Retrospective.
Population: A total of 197 healthy controls, 547 cardiac patients.
Field strength/sequence: A 3 T, diffusion-weighted stimulated echo acquisition mode single-shot echo-planar imaging sequence.
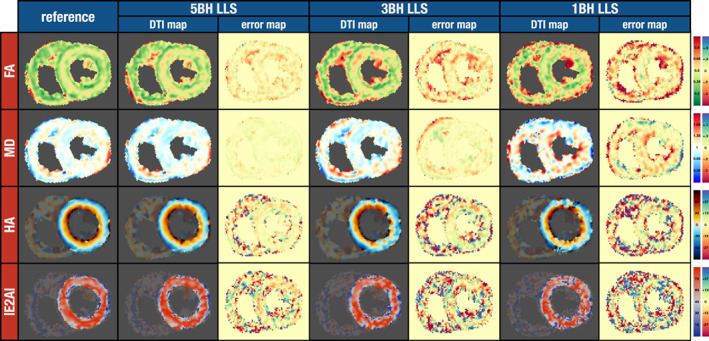
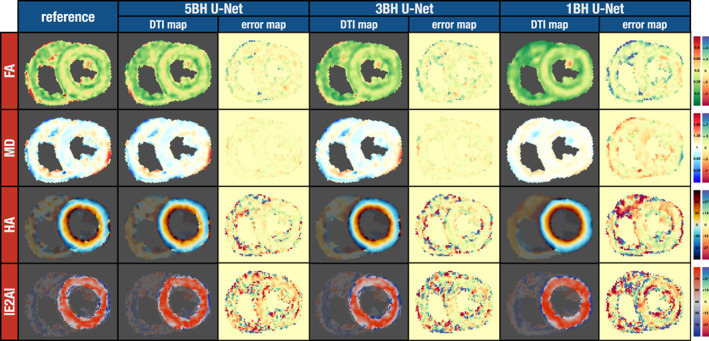
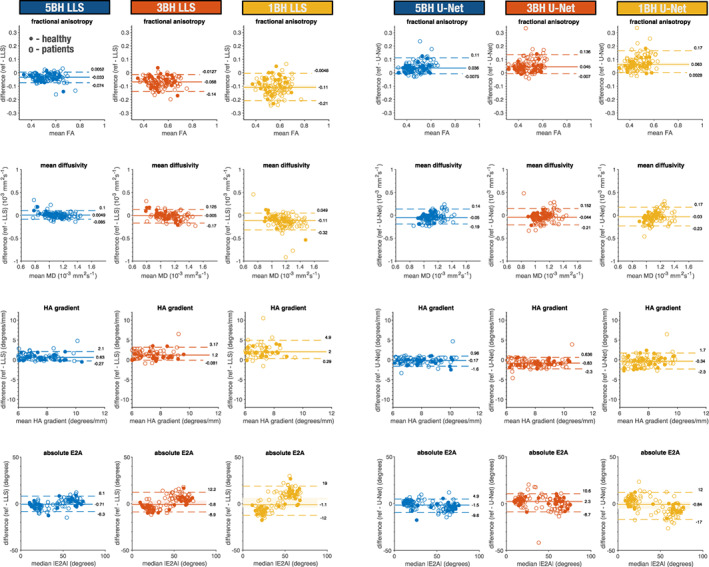
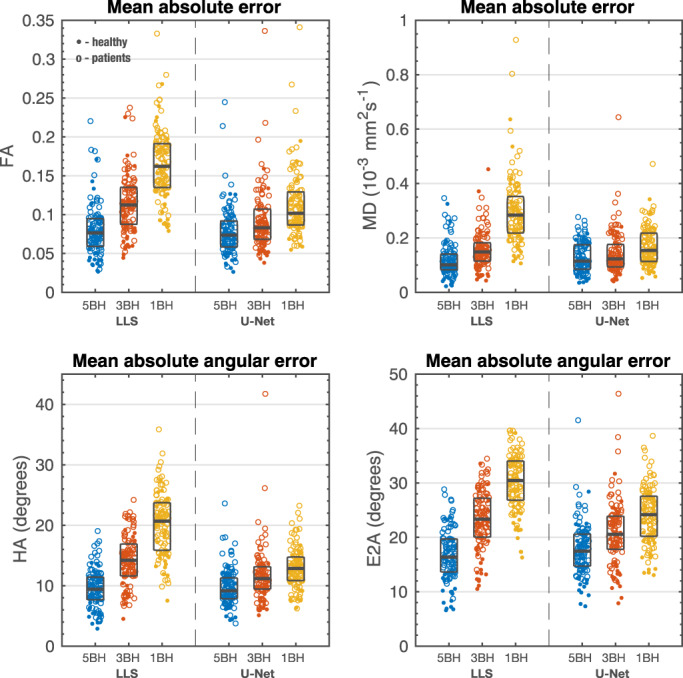
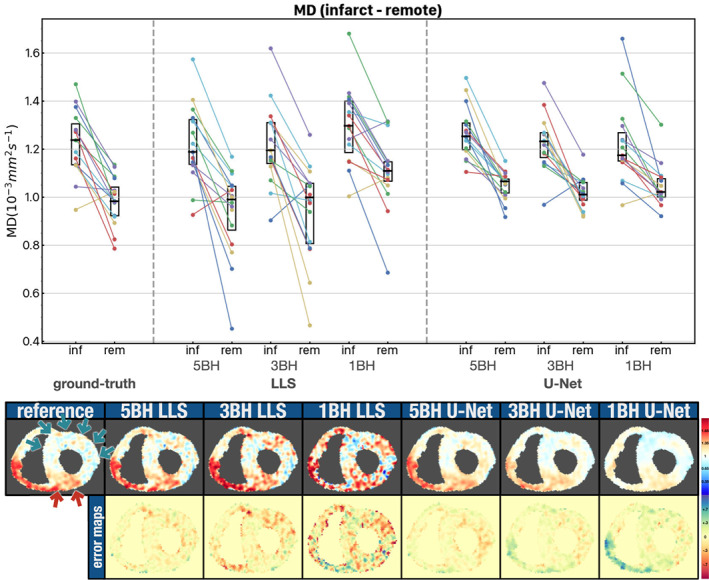
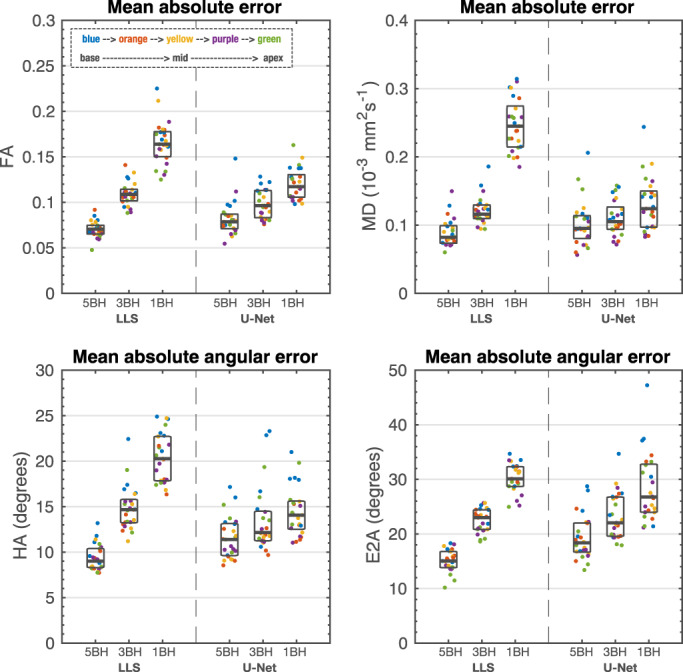
Assessment: A U-Net was trained to reconstruct the diffusion tensor elements of the reference results from reduced datasets that could be acquired in 5, 3 or 1 breath-hold(s) (BH) per slice. Fractional anisotropy (FA), mean diffusivity (MD), helix angle (HA), and sheetlet angle (E2A) were calculated and compared to the same measures when using a conventional linear-least-square (LLS) tensor fit with the same reduced datasets. A conventional LLS tensor fit with all available data (12 ± 2.0 [mean ± sd] breath-holds) was used as the reference baseline.
Statistical tests: Wilcoxon signed rank/rank sum and Kruskal-Wallis tests. Statistical significance threshold was set at P = 0.05. Intersubject measures are quoted as median [interquartile range].
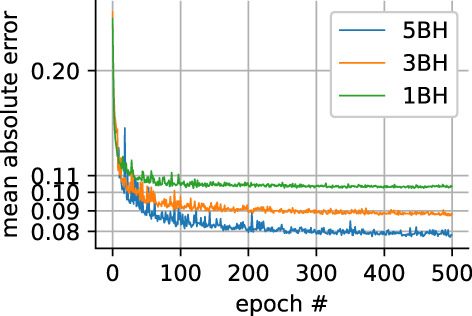
Results: For global mean or median results, both the LLS and U-Net methods with reduced datasets present a bias for some of the results. For both LLS and U-Net, there is a small but significant difference from the reference results except for LLS: MD 5BH (P = 0.38) and MD 3BH (P = 0.09). When considering direct pixel-wise errors the U-Net model outperformed significantly the LLS tensor fit for reduced datasets that can be acquired in three or just one breath-hold for all parameters.
Data conclusion: Diffusion tensor prediction with a trained U-Net is a promising approach to minimize the number of breath-holds needed in clinical cDTI studies.
Evidence level: 4 TECHNICAL EFFICACY: Stage 1.
Keywords: CNN; U-Net; cardiac; deep learning; diffusion tensor imaging.
© 2022 The Authors. Journal of Magnetic Resonance Imaging published by Wiley Periodicals LLC on behalf of International Society for Magnetic Resonance in Medicine.
Conflict of interest statement
Professor Dudley Pennell receives research support from Siemens and is a stockholder and director of Cardiovascular Imaging Solutions. The RBH CMR group receives research support from Siemens Healthineers
Figures
Comment in
-
Editorial for "Accelerating Cardiac Diffusion Imaging With a U-Net Based Model: Towards Single Breath-Hold".J Magn Reson Imaging. 2022 Dec;56(6):1705-1706. doi: 10.1002/jmri.28197. Epub 2022 Apr 13. J Magn Reson Imaging. 2022. PMID: 35416357 No abstract available.
Similar articles
-
An in-vivo comparison of stimulated-echo and motion compensated spin-echo sequences for 3 T diffusion tensor cardiovascular magnetic resonance at multiple cardiac phases.J Cardiovasc Magn Reson. 2018 Jan 3;20(1):1. doi: 10.1186/s12968-017-0425-8. J Cardiovasc Magn Reson. 2018. PMID: 29298692 Free PMC article.
-
Extracting diffusion tensor fractional anisotropy and mean diffusivity from 3-direction DWI scans using deep learning.Magn Reson Med. 2021 Feb;85(2):845-854. doi: 10.1002/mrm.28470. Epub 2020 Aug 18. Magn Reson Med. 2021. PMID: 32810351
-
In vivo diffusion tensor MRI of the human heart: reproducibility of breath-hold and navigator-based approaches.Magn Reson Med. 2013 Aug;70(2):454-65. doi: 10.1002/mrm.24488. Epub 2012 Sep 21. Magn Reson Med. 2013. PMID: 23001828 Free PMC article.
-
Diffusion tensor imaging (DTI) of the kidney at 3 tesla-feasibility, protocol evaluation and comparison to 1.5 Tesla.Invest Radiol. 2010 May;45(5):245-54. doi: 10.1097/RLI.0b013e3181d83abc. Invest Radiol. 2010. PMID: 20375845
-
The role of diffusion tensor imaging and fractional anisotropy in the evaluation of patients with idiopathic normal pressure hydrocephalus: a literature review.Neurosurg Focus. 2016 Sep;41(3):E12. doi: 10.3171/2016.6.FOCUS16192. Neurosurg Focus. 2016. PMID: 27581308 Review.
Cited by
-
STEAM-SASHA: a novel approach for blood- and fat-suppressed native T1 measurement in the right ventricular myocardium.MAGMA. 2024 Apr;37(2):295-305. doi: 10.1007/s10334-023-01141-8. Epub 2024 Jan 12. MAGMA. 2024. PMID: 38216813 Free PMC article.
-
Deep learning-based diffusion tensor cardiac magnetic resonance reconstruction: a comparison study.Sci Rep. 2024 Mar 7;14(1):5658. doi: 10.1038/s41598-024-55880-2. Sci Rep. 2024. PMID: 38454072 Free PMC article.
-
Mapping microarchitectural degeneration in the dilated ascending aorta with ex vivo diffusion tensor imaging.Eur Heart J Open. 2023 Dec 5;4(1):oead128. doi: 10.1093/ehjopen/oead128. eCollection 2024 Jan. Eur Heart J Open. 2023. PMID: 38162403 Free PMC article.
References
-
- Helm P, Beg MF, Miller MI, Winslow RL. Measuring and mapping cardiac fiber and laminar architecture using diffusion tensor MR imaging. Ann N Y Acad Sci 2005;1047:296‐307. - PubMed
-
- Scollan DF, Holmes A, Winslow R, Forder J. Histological validation of myocardial microstructure obtained from diffusion tensor magnetic resonance imaging. Am J Physiol 1998;275(6 Pt 2):H2308‐H2318. - PubMed
Publication types
MeSH terms
Grants and funding
LinkOut - more resources
Full Text Sources
