Relationship between Biodistribution and Tracer Kinetics of 11C-Erlotinib, 18F-Afatinib and 11C-Osimertinib and Image Quality Evaluation Using Pharmacokinetic/Pharmacodynamic Analysis in Advanced Stage Non-Small Cell Lung Cancer Patients
- PMID: 35453931
- PMCID: PMC9032381
- DOI: 10.3390/diagnostics12040883
Relationship between Biodistribution and Tracer Kinetics of 11C-Erlotinib, 18F-Afatinib and 11C-Osimertinib and Image Quality Evaluation Using Pharmacokinetic/Pharmacodynamic Analysis in Advanced Stage Non-Small Cell Lung Cancer Patients
Abstract
Background: Patients with non-small cell lung cancer (NSCLC) driven by activating epidermal growth factor receptor (EGFR) mutations are best treated with therapies targeting EGFR, i.e., tyrosine kinase inhibitors (TKI). Radiolabeled EGFR-TKI and PET have been investigated to study EGFR-TKI kinetics and its potential role as biomarker of response in NSCLC patients with EGFR mutations (EGFRm). In this study we aimed to compare the biodistribution and kinetics of three different EGFR-TKI, i.e., 11C-erlotinib, 18F-afatinib and 11C-osimertinib.
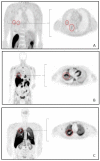
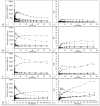
Methods: Data of three prospective studies and 1 ongoing study were re-analysed; data from thirteen patients (EGFRm) were included for 11C-erlotinib, seven patients for 18F-afatinib (EGFRm and EGFR wild type) and four patients for 11C-osimertinib (EGFRm). From dynamic and static scans, SUV and tumor-to-blood (TBR) values were derived for tumor, lung, spleen, liver, vertebra and, if possible, brain tissue. AUC values were calculated using dynamic time-activity-curves. Parent fraction, plasma-to-blood ratio and SUV values were derived from arterial blood data. Tumor-to-lung contrast was calculated, as well as (background) noise to assess image quality.
Results: 11C-osimertinib showed the highest SUV and TBR (AUC) values in nearly all tissues. Spleen uptake was notably high for 11C-osimertinib and to a lesser extent for 18F-afatinib. For EGFRm, 11C-erlotinib and 18F-afatinib demonstrated the highest tumor-to-lung contrast, compared to an inverse contrast observed for 11C-osimertinib. Tumor-to-lung contrast and spleen uptake of the three TKI ranked accordingly to the expected lysosomal sequestration.
Conclusion: Comparison of biodistribution and tracer kinetics showed that 11C-erlotinib and 18F-afatinib demonstrated the highest tumor-to-background contrast in EGFRm positive tumors. Image quality, based on contrast and noise analysis, was superior for 11C-erlotinib and 18F-afatinib (EGFRm) scans compared to 11C-osimertinib and 18F-afatinib (EGFR wild type) scans.
Keywords: 11C-erlotinib; 11C-osimertinib; 18F-afatinib; EGFR TKI PET/CT; biodistribution; non-small cell lung cancer.
Conflict of interest statement
E.A.v.d.S., M.Y., R.C.S., I.H.B., A.L., A.J.d.L. and N.H.H. have no financial interests to disclose. I.B. occasionally participates in advisory boards from Boehringer Ingelheim.
Figures


Similar articles
-
Physiologically Based Pharmacokinetic (PBPK) Modeling to Predict PET Image Quality of Three Generations EGFR TKI in Advanced-Stage NSCLC Patients.Pharmaceuticals (Basel). 2022 Jun 27;15(7):796. doi: 10.3390/ph15070796. Pharmaceuticals (Basel). 2022. PMID: 35890095 Free PMC article.
-
Identifying advanced stage NSCLC patients who benefit from afatinib therapy using 18F-afatinib PET/CT imaging.Lung Cancer. 2021 May;155:156-162. doi: 10.1016/j.lungcan.2021.03.016. Epub 2021 Mar 26. Lung Cancer. 2021. PMID: 33836373
-
Preclinical Comparison of Osimertinib with Other EGFR-TKIs in EGFR-Mutant NSCLC Brain Metastases Models, and Early Evidence of Clinical Brain Metastases Activity.Clin Cancer Res. 2016 Oct 15;22(20):5130-5140. doi: 10.1158/1078-0432.CCR-16-0399. Epub 2016 Jul 19. Clin Cancer Res. 2016. PMID: 27435396
-
First-line treatment of advanced epidermal growth factor receptor (EGFR) mutation positive non-squamous non-small cell lung cancer.Cochrane Database Syst Rev. 2016 May 25;(5):CD010383. doi: 10.1002/14651858.CD010383.pub2. Cochrane Database Syst Rev. 2016. Update in: Cochrane Database Syst Rev. 2021 Mar 18;3:CD010383. doi: 10.1002/14651858.CD010383.pub3 PMID: 27223332 Updated. Review.
-
Optimizing the sequencing of tyrosine kinase inhibitors (TKIs) in epidermal growth factor receptor (EGFR) mutation-positive non-small cell lung cancer (NSCLC).Lung Cancer. 2019 Nov;137:113-122. doi: 10.1016/j.lungcan.2019.09.017. Epub 2019 Sep 23. Lung Cancer. 2019. PMID: 31568888 Free PMC article. Review.
Cited by
-
Deciphering Tumor Response: The Role of Fluoro-18-d-Glucose Uptake in Evaluating Targeted Therapies with Tyrosine Kinase Inhibitors.J Clin Med. 2024 May 31;13(11):3269. doi: 10.3390/jcm13113269. J Clin Med. 2024. PMID: 38892979 Free PMC article.
-
Physiologically Based Pharmacokinetic (PBPK) Modeling to Predict PET Image Quality of Three Generations EGFR TKI in Advanced-Stage NSCLC Patients.Pharmaceuticals (Basel). 2022 Jun 27;15(7):796. doi: 10.3390/ph15070796. Pharmaceuticals (Basel). 2022. PMID: 35890095 Free PMC article.
-
An intrinsic purine metabolite AICAR blocks lung tumour growth by targeting oncoprotein mucin 1.Br J Cancer. 2023 May;128(9):1647-1664. doi: 10.1038/s41416-023-02196-z. Epub 2023 Feb 21. Br J Cancer. 2023. PMID: 36810913 Free PMC article.
References
-
- Planchard D., Popat S., Kerr K., Novello S., Smit E.F., Faivre-Finn C., Mok T.S., Reck M., Van Schil P.E., Hellmann M.D., et al. Metastatic non-small cell lung cancer: ESMO Clinical Practice Guidelines for diagnosis, treatment and follow-up. Ann. Oncol. 2018;29((Suppl. 4)):iv192–iv237. doi: 10.1093/annonc/mdy275. - DOI - PubMed
Grants and funding
LinkOut - more resources
Full Text Sources
Research Materials
Miscellaneous

