. 2022 Apr 26;119(17):e2203172119.
doi: 10.1073/pnas.2203172119. Epub 2022 Apr 22.

Structural basis of protein substrate processing by human mitochondrial high-temperature requirement A2 protease

Affiliations

Structural basis of protein substrate processing by human mitochondrial high-temperature requirement A2 protease

Yuki Toyama et al. Proc Natl Acad Sci U S A. .

Abstract

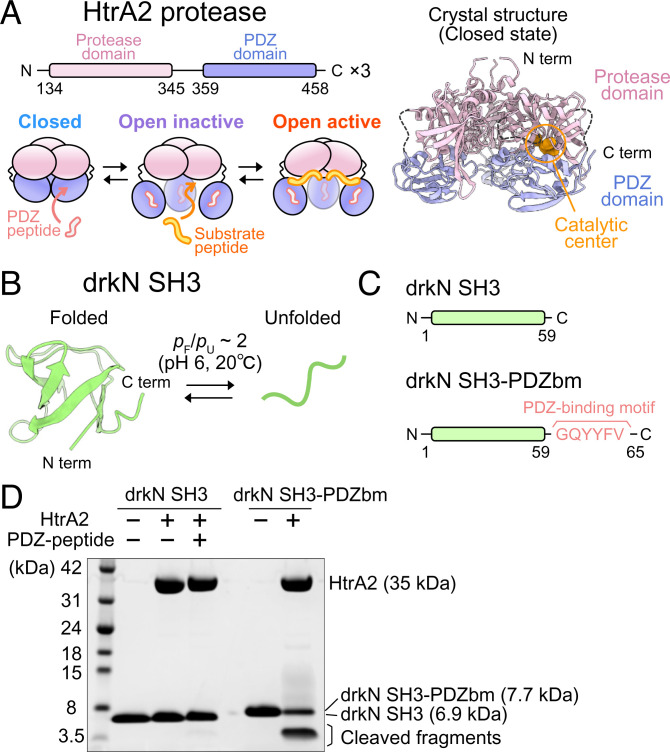
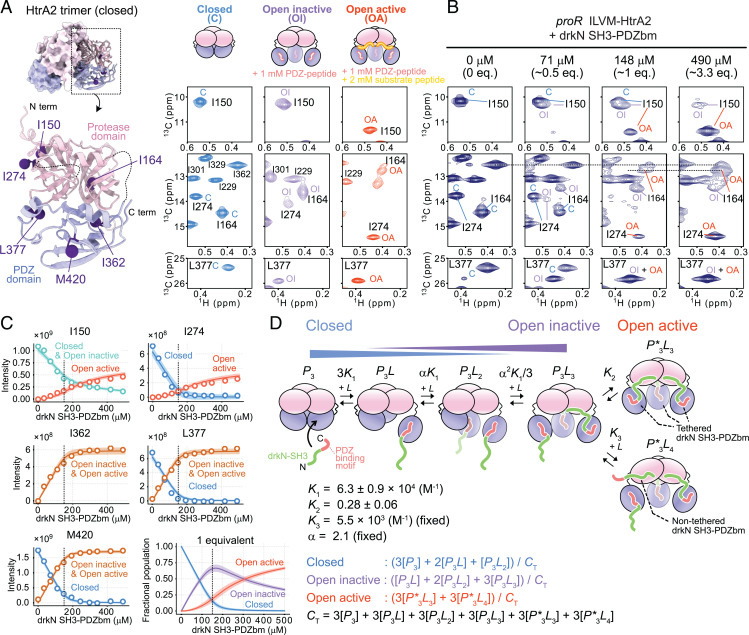
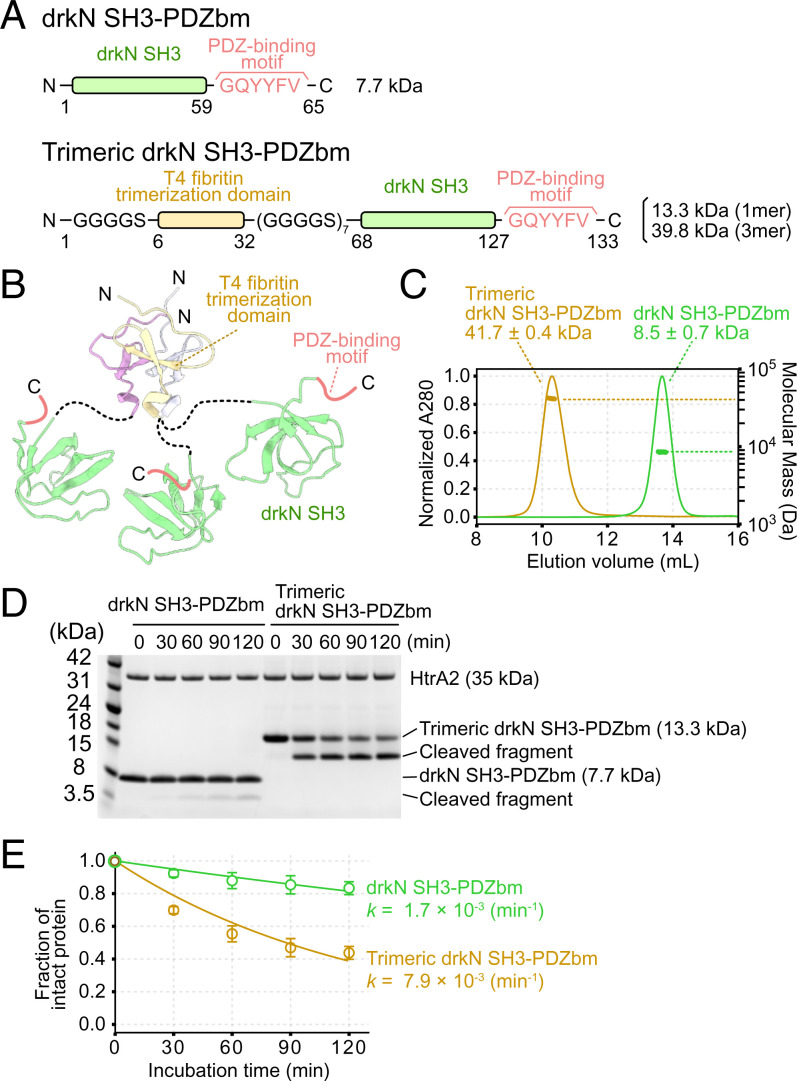
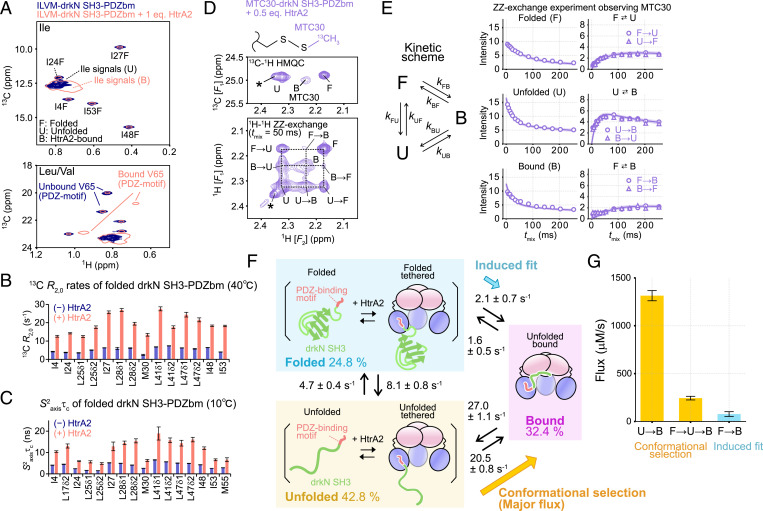
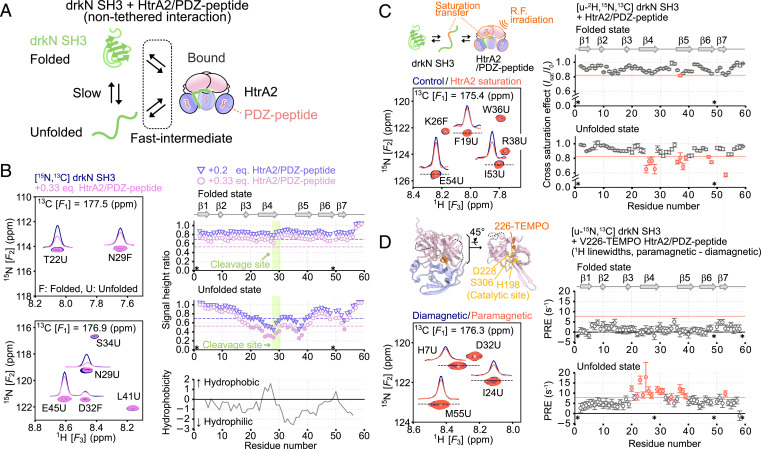
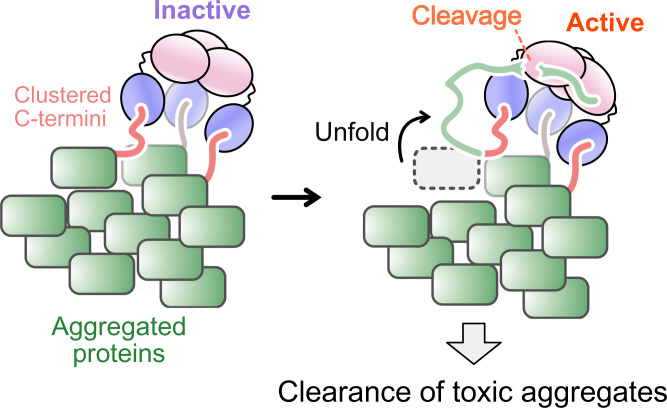
The human high-temperature requirement A2 (HtrA2) protein is a trimeric protease that cleaves misfolded proteins to protect cells from stresses caused by toxic, proteinaceous aggregates, and the aberrant function of HtrA2 is closely related to the onset of neurodegenerative disorders. Our methyl-transverse relaxation optimized spectroscopy (TROSY)–based NMR studies using small-peptide ligands have previously revealed a stepwise activation mechanism involving multiple distinct conformational states. However, very little is known about how HtrA2 binds to protein substrates and if the distinct conformational states observed in previous peptide studies might be involved in the processing of protein clients. Herein, we use solution-based NMR spectroscopy to investigate the interaction between the N-terminal Src homology 3 domain from downstream of receptor kinase (drk) with an added C-terminal HtrA2-binding motif (drkN SH3-PDZbm) that exhibits marginal folding stability and serves as a mimic of a physiological protein substrate. We show that drkN SH3-PDZbm binds to HtrA2 via a two-pronged interaction, involving both its C-terminal PDZ-domain binding motif and a central hydrophobic region, with binding occurring preferentially via an unfolded ensemble of substrate molecules. Multivalent interactions between several clients and a single HtrA2 trimer significantly stimulate the catalytic activity of HtrA2, suggesting that binding avidity plays an important role in regulating substrate processing. Our results provide a thermodynamic, kinetic, and structural description of the interaction of HtrA2 with protein substrates and highlight the importance of a trimeric architecture for function as a stress-protective protease that mitigates aggregation.

Keywords: conformational selection; ligand-binding thermodynamics; methyl transverse relaxation optimized NMR spectroscopy; mitochondrial proteostasis; protein–protein interaction.


Conflict of interest statement

The authors declare no competing interest.

Figures

Fig. 1.
Fig. 1.
drkN SH3-PDZbm, but not drkN SH3, is cleaved by HtrA2. (A) Domain organization of HtrA2 (Left Upper) and cartoon representations of three states of HtrA2 (Left Lower) (31, 32). (A, Right) The crystal structure of trimeric HtrA2 (Protein Data Bank [PDB] ID code 1LCY) in the closed state is shown. The protease (residues 134 to 345) and PDZ (residues 359 to 458) domains are colored pink and light blue, respectively. The region containing residues 282 to 290 (β8–β9 linker) and 344 to 358 (interdomain linker) are shown with dotted lines. The catalytic center residues (residues 198, 228, and 306) are shown as orange spheres in one of the subunits. (B) NMR structure of drkN SH3 T22G mutant (PDB ID code 2A36) (37) and schematic representation of the equilibrium between the folded and unfolded states of the domain. (C) Schematic representations of the drkN SH3 constructs (drkN SH3 and drkN SH3-PDZbm) used in this study. (D) Gel-based proteolytic activity assays of HtrA2 against drkN SH3 or drkN SH3-PDZbm. The assignments of each band are shown to the right.
Fig. 2.
Fig. 2.
Binding model of drkN SH3-PDZbm to HtrA2. (A, Left) Close-up view of HtrA2 monomer structure showing methyl probes used in the titration analyses as purple spheres (PDB ID code 1LCY). (A, Right) The 13C-1H HMQC correlation maps of the methyl signals that show distinct chemical shift differences between the C (blue), OI (purple), and OA (red) states. The cartoon representations of each state are shown on top of the spectra. The spectra of OI and OA states were recorded in the presence of 1 mM PDZ-peptide (OI) or both 1 mM PDZ-peptide and 2 mM substrate peptide (OA) (40 °C and 23.5 Tesla). (B) The 13C-1H HMQC correlation maps of 150 μM (monomer concentration) U-2H, proR ILVM-13CH3 S306A/I441V HtrA2 with varying concentrations of U-2H,15N drkN SH3-PDZbm (40 °C and 18.8 Tesla). (C) Plots of the intensities of methyl correlations as a function of the concentration of drkN SH3-PDZbm. The solid lines are the fitted curves, and the 95% CI of each fitted curve is contained within the thick line estimated from Monte Carlo error analyses (84). The fractional populations of the C, OI, and OA states calculated from the fitted parameters are shown in C, Right Bottom. In each plot, the concentration of one equivalent added ligand is indicated as a dotted vertical line. (D) Thermodynamic binding model along with cartoon representations of each state used in fits of the titration data. The best-fit values and the estimated errors of the parameters are shown below the model (see Stepwise Binding of drkN SH3-PDZbm Induces the Formation of the Catalytically Active Conformation of HtrA2 for details). Equations for fractional populations of the C, OI, and OA states and the total protein concentration are also listed. Eq., equivalent; N term, N terminus; C term, C terminus.
Fig. 3.
Fig. 3.
Trimeric drkN SH3-PDZbm is cleaved more readily than the monomeric form. (A) Schematic representations of drkN SH3-PDZbm (Upper) and trimeric drkN SH3-PDZbm (Lower) constructs used in this study. (B) Cartoon model of trimeric drkN SH3-PDZbm. NMR-based structures of the trimerization domain (PDB ID code 1RFO) and drkN SH3 (PDB ID code 2A36) are shown. (C) SEC-MALS profiles of drkN SH3-PDZbm (green) and trimeric drkN SH3-PDZbm (gold). Curves show absorbance at 280 nm (left y axis) and the dots indicate molecular masses (right y axis, log scale). (D) Gel-based proteolytic activity assays monitoring the degradation of drkN SH3-PDZbm (Left) or trimeric drkN SH3-PDZbm (Right) by WT HtrA2. The time course of the reaction was monitored by SDS-PAGE. (E) Plots of the fraction of intact protein, as measured by intensities on an SDS-PAGE gel, as a function of incubation time. The intensities were normalized to those obtained at 0 min, and the profiles were fit to a single exponential decay function. The apparent cleavage rates (k) are shown. Error bars correspond to one SD based on triplicate measurements.
Fig. 4.
Fig. 4.
Structural characterization of drkN SH3-PDZbm bound to HtrA2. (A) The 13C-1H HMQC correlation maps of Ile (Upper) and Leu/Val (Lower) regions of 150 μM U-2H, ILVM drkN SH3-PDZbm with (pink, single contour) and without (navy, multiple contours) 150 μM (monomer concentration) U-2H, S306A/I441V HtrA2. The folded, unfolded, and HtrA2-bound states are denoted as F, U, and B, respectively. (B) Plots of 13C single-quantum transverse relaxation rates using a 2-kHz Carr–Purcell–Meiboom–Gill field, with (pink) and without (navy) U-2H, S306A/I441V HtrA2 (40 °C and 23.5 Tesla). (C) Plots of the order parameter squared multiplied by the rotational correlation time (S2axisτc) of methyl threefold symmetry axes (folded state of drkN SH3-PDZbm) with (pink) and without (navy) U-2H, S306A/I441V HtrA2 (10 °C and 23.5 Tesla). (D) The 13C-1H HMQC (Upper) and 13C-edited 1H[t1]-tmix-1H[t2] ZZ-exchange [Lower (68)] datasets recorded on 150 μM U-2H, ILV-13CH3, M30C 13C-MMTS-labeled drkN SH3-PDZbm in the presence of 75 μM (monomer concentration) U-2H S306A/I441V HtrA2 (50-ms mixing time, 23.5 Tesla, and 40 °C). The asterisk denotes a signal from an impurity. The chemical structure of the MTC group is shown above the spectra. (E, Left) Triangular kinetic scheme showing the interconversion between F, U, and B states of drkN SH3-PDZbm. (E, Right) ZZ-exchange profiles of diagonal and exchange cross-peaks as a function of mixing time. The solid lines are the fitted curves, and the 95% CI of each fitted curve is contained within the thick line estimated from Monte Carlo error analyses. The two symmetric cross-peaks (e.g., U→F and F→U) are plotted separately as circles and triangles. (F) Cartoon representations of the kinetic scheme describing the binding of drkN SH3-PDZbm to HtrA2. The best-fit values and the estimated errors of the rate constants of each transition and the associated equilibrium populations of the F (blue background), U (yellow background), and B (pink background) states are shown (see drkN SH3-PDZbm Binds to HtrA2 via a Conformational Selection Mechanism for details). The flux directions corresponding to induced fit (blue) and conformational selection (orange) are shown. (G) Flux values from U to B (Left), F to U to B (Center), and F to B (Right). Errors were calculated from the SD of parameter distributions obtained from Monte Carlo error analyses of the ZZ-exchange profiles. Eq., equivalent.
Fig. 5.
Fig. 5.
Mapping of HtrA2 interaction sites on drkN SH3. (A) Schematic cartoon describing the nontethered interaction between drkN SH3 without the C-terminal PDZ-binding motif and the open, inactive state of HtrA2 bound to PDZ-peptide. (B, Left) The 15N-1H planes from 3D HNCO spectra of U-15N,13C drkN SH3 with (pink) or without (navy) unlabeled S306A/I441V HtrA2 bound to PDZ-peptide. F and U denote the folded and unfolded states of drkN SH3. (B, Right Top and Middle) Plots of signal height ratios of drkN SH3 correlations in the presence of 0.2 (triangle, purple) or 0.33 (pink circle) equivalents of HtrA2. The signal heights were normalized against those in the absence of HtrA2. The secondary structure elements in the folded state are shown above the plots. The average − SD values are indicated as dotted horizontal lines (average over all residues, both from F and U states). Residues with ratios below the average − SD are shown as filled symbols. (B, Right Bottom). Plot of hydrophobicity calculated based on the Kyte–Doolittle scale using an averaging window size of 7 (71). (C, Left Upper) Schematic representation of the TCS experiment. (C, Left Lower) The 15N-1H planes from 3D TROSY-HNCO spectra of U-2H,15N,13C drkN SH3 with (orange) or without (navy) 1H radio-frequency (R.F.) irradiation of S306A/I441V HtrA2 bound to PDZ-peptide. A ratio of drkN SH3:HtrA2/PDZ-peptide of 2:1 (monomer) was used. (C, Right) Plots of the cross-saturation effects for the folded and unfolded states of drkN SH3. The average − SD values are indicated by orange horizontal lines. Residues with a ratio below average − SD are colored orange. (D, Left Upper) A close-up view of the structure of the catalytic center of HtrA2 (PDB ID code 1LCY). The catalytic residues (residues 198, 228, and 306) are shown as yellow sticks, and the beta carbon of V226 where the TEMPO-modification was introduced is shown as an orange sphere. (D, Left Lower) The 15N-1H planes from 3D HNCO spectra of U-15N,13C drkN SH3 with a diamagnetic (navy) or paramagnetic (orange) label on HtrA2 (drkN SH3:HtrA2 monomer concentrations in a ratio of 2:1). (D, Right) Plots of PRE rates of the folded and unfolded states of drkN SH3. Average + SD values are indicated as orange horizontal lines. Residues with PRE rates larger than average + SD are colored orange. All of the measurements were performed at 10 °C and 14.0 Tesla. Asterisks indicate the Pro residue (P49) or residues that were not analyzed due to signal overlap or broadening. Eq., equivalent.
Fig. 6.
Fig. 6.
Proposed mechanism for the clearance of toxic aggregates by HtrA2. HtrA2 binds to the clustered C termini of aggregated proteins via a tripartite interaction formed through its three PDZ domains. Hydrophobic regions of unfolded proteins forming the aggregate are recognized by the exposed catalytic center of HtrA2, leading to degradation. In our model (Fig. 2D), the active HtrA2 state is only formed when all three catalytic sites are occupied by substrates.

Similar articles

Cited by

References

    1. Dobson C. M., Getting out of shape. Nature 418, 729–730 (2002). - PubMed
    1. Gregersen N., Bross P., Vang S., Christensen J. H., Protein misfolding and human disease. Annu. Rev. Genomics Hum. Genet. 7, 103–124 (2006). - PubMed
    1. Chiti F., Dobson C. M., Protein misfolding, functional amyloid, and human disease. Annu. Rev. Biochem. 75, 333–366 (2006). - PubMed
    1. Clausen T., Kaiser M., Huber R., Ehrmann M., HTRA proteases: Regulated proteolysis in protein quality control. Nat. Rev. Mol. Cell Biol. 12, 152–162 (2011). - PubMed
    1. Skorko-Glonek J., et al. , HtrA protease family as therapeutic targets. Curr. Pharm. Des. 19, 977–1009 (2013). - PubMed

Publication types

MeSH terms

Substances

Grants and funding

LinkOut - more resources