mtDNA-STING Axis Mediates Microglial Polarization via IRF3/NF-κB Signaling After Ischemic Stroke
- PMID: 35450066
- PMCID: PMC9017276
- DOI: 10.3389/fimmu.2022.860977
mtDNA-STING Axis Mediates Microglial Polarization via IRF3/NF-κB Signaling After Ischemic Stroke
Abstract
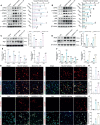
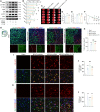
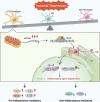
Neuroinflammation is initiated in response to ischemic stroke, and is usually characterized by microglial activation and polarization. Stimulator of interferon genes (STING) has been shown to play a critical role in anti-tumor immunity and inflammatory diseases. Nevertheless, the effect and underlying mechanisms of STING on microglial polarization after ischemic stroke remain unclarified. In this study, acute ischemic stroke was simulated using a model of middle cerebral artery occlusion (MCAO) at adult male C57BL/6 mice in vivo and the BV2 microglia oxygen-glucose deprivation/reperfusion (OGD/R) model in vitro. The specific STING inhibitor C-176 was administered intraperitoneally at 30min after MCAO. We found that the expression of microglial STING was increased following MCAO and OGD/R. Pharmacologic inhibition of STING with C-176 reduced the ischemia/reperfusion (I/R)-induced brain infarction, edema and neuronal injury. Moreover, blockade of STING improved neurological performance and cognitive function and attenuated neuronal degeneration in the hippocampus after MCAO. Mechanistically, both in vivo and in vitro, we delineated that STING could promote the polarization of microglia towards the M1 phenotype and restrain M2 microglia polarization via downstream pathways, including interferon regulatory factor 3 (IRF3) and nuclear factor-κB (NF-κB). In addition, mitochondrial DNA (mtDNA), which is released to microglial cytoplasm induced by I/R injury, could facilitate microglia towards M1 modality through STING signaling pathway. Treatment with C-176 abolished the detrimental effects of mtDNA on stroke outcomes. Taken together, these findings suggest that STING, activated by mtDNA, could polarize microglia to the M1 phenotype following MCAO. Inhibition of STING may serve as a potential therapeutic strategy to mitigate neuroinflammation after ischemic stroke.
Keywords: STING; ischemia/reperfusion (I/R) injury; microglia; neuroinflammation; polarization.
Copyright © 2022 Kong, Li, Chang, Wang, Shen, Xu, Wang, Zhang, Sun, Hu, Xu and Liu.
Conflict of interest statement
The authors declare that the research was conducted in the absence of any commercial or financial relationships that could be construed as a potential conflict of interest.
Figures


Similar articles
-
cGAS knockdown promotes microglial M2 polarization to alleviate neuroinflammation by inhibiting cGAS-STING signaling pathway in cerebral ischemic stroke.Brain Res Bull. 2021 Jun;171:183-195. doi: 10.1016/j.brainresbull.2021.03.010. Epub 2021 Mar 18. Brain Res Bull. 2021. PMID: 33745949
-
Shikonin attenuates cerebral ischemia/reperfusion injury via inhibiting NOD2/RIP2/NF-κB-mediated microglia polarization and neuroinflammation.J Stroke Cerebrovasc Dis. 2024 Jun;33(6):107689. doi: 10.1016/j.jstrokecerebrovasdis.2024.107689. Epub 2024 Mar 26. J Stroke Cerebrovasc Dis. 2024. PMID: 38527567
-
Loureirin B protects against cerebral ischemia/reperfusion injury through modulating M1/M2 microglial polarization via STAT6 / NF-kappaB signaling pathway.Eur J Pharmacol. 2023 Aug 15;953:175860. doi: 10.1016/j.ejphar.2023.175860. Epub 2023 Jun 16. Eur J Pharmacol. 2023. PMID: 37331681 Review.
-
High-frequency repetitive transcranial magnetic stimulation (rTMS) protects against ischemic stroke by inhibiting M1 microglia polarization through let-7b-5p/HMGA2/NF-κB signaling pathway.BMC Neurosci. 2022 Aug 4;23(1):49. doi: 10.1186/s12868-022-00735-7. BMC Neurosci. 2022. PMID: 35927640 Free PMC article.
-
Downregulation of Nogo-B ameliorates cerebral ischemia/reperfusion injury in mice through regulating microglia polarization via TLR4/NF-kappaB pathway.Neurochem Int. 2023 Jul;167:105553. doi: 10.1016/j.neuint.2023.105553. Epub 2023 May 23. Neurochem Int. 2023. PMID: 37230196 Review.
Cited by
-
Dual-tDCS Ameliorates Cerebral Injury and Promotes Motor Function Recovery via cGAS-STING Signaling Pathway in a Rat Model of Ischemic Stroke.Mol Neurobiol. 2024 Oct 26. doi: 10.1007/s12035-024-04574-x. Online ahead of print. Mol Neurobiol. 2024. PMID: 39455539
-
IRF3 regulates neuroinflammatory responses and the expression of genes associated with Alzheimer's disease.J Neuroinflammation. 2024 Aug 30;21(1):212. doi: 10.1186/s12974-024-03203-7. J Neuroinflammation. 2024. PMID: 39215356 Free PMC article.
-
Control of innate immunity and lipid biosynthesis in neurodegeneration.Front Mol Neurosci. 2024 Jul 25;17:1402055. doi: 10.3389/fnmol.2024.1402055. eCollection 2024. Front Mol Neurosci. 2024. PMID: 39156128 Free PMC article. Review.
-
Mitochondrial Dysfunction is a Crucial Immune Checkpoint for Neuroinflammation and Neurodegeneration: mtDAMPs in Focus.Mol Neurobiol. 2024 Aug 8. doi: 10.1007/s12035-024-04412-0. Online ahead of print. Mol Neurobiol. 2024. PMID: 39115673 Review.
-
Cytosolic Escape of Mitochondrial DNA Triggers cGAS-STING Pathway-Dependent Neuronal PANoptosis in Response to Intermittent Hypoxia.Neurochem Res. 2024 Aug;49(8):2228-2248. doi: 10.1007/s11064-024-04151-7. Epub 2024 Jun 4. Neurochem Res. 2024. PMID: 38833090
References
-
- Feigin VL, Nichols E, Alam T, Bannick MS, Beghi E, Blake N, et al. . Global, Regional, and National Burden of Neurological Disorders, 1990-2016: A Systematic Analysis for the Global Burden of Disease Study 2016. Lancet Neurol (2019) 18(5):459–80. doi: 10.1016/s1474-4422(18)30499-x - DOI - PMC - PubMed
Publication types
MeSH terms
Substances
LinkOut - more resources
Full Text Sources
Medical
Research Materials

