

Network Pharmacology-Based Strategy to Identify the Pharmacological Mechanisms of Pulsatilla Decoction against Crohn's Disease
- PMID: 35450039
- PMCID: PMC9016333
- DOI: 10.3389/fphar.2022.844685
Network Pharmacology-Based Strategy to Identify the Pharmacological Mechanisms of Pulsatilla Decoction against Crohn's Disease
Abstract
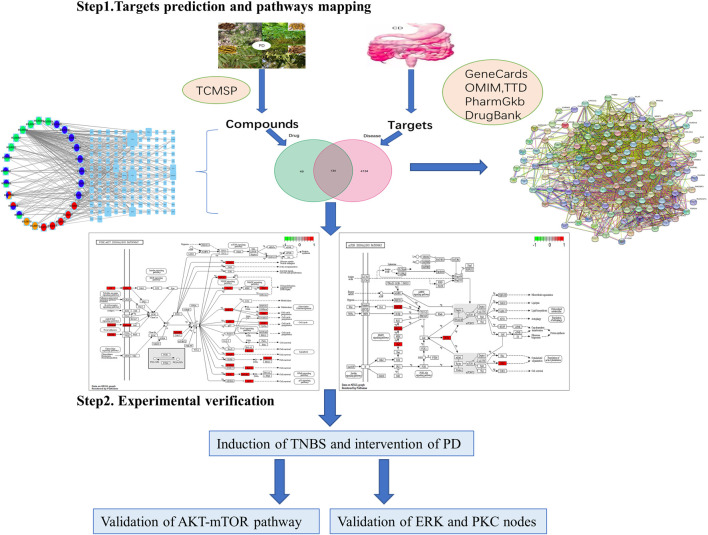
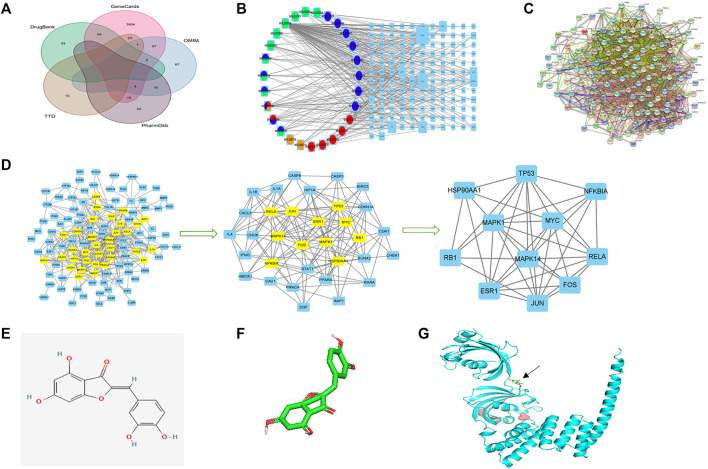
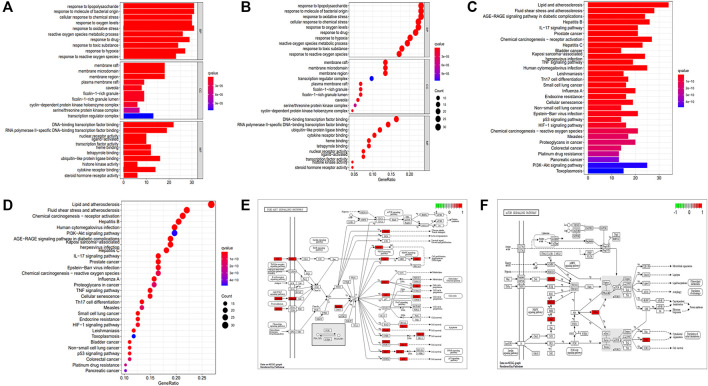
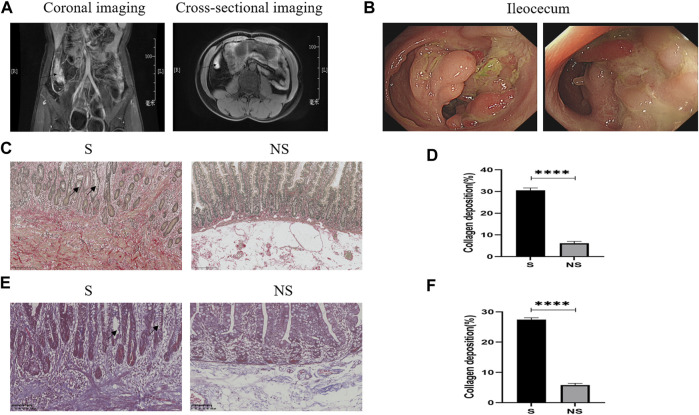
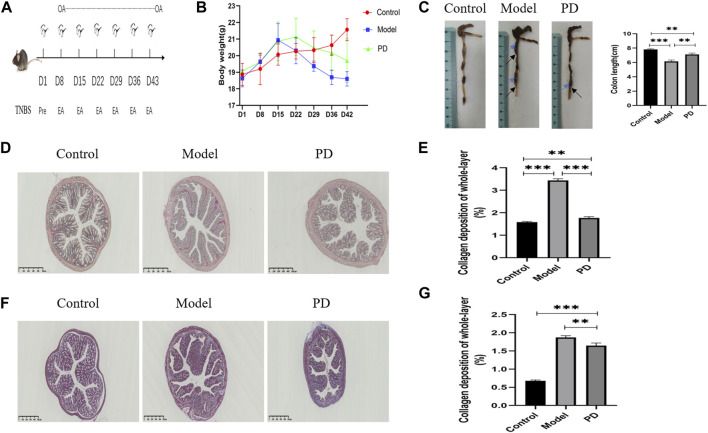
Purpose: To explore pharmacological mechanisms of Pulsatilla decoction (PD) against Crohn's disease (CD) via network pharmacology analysis followed by experimental validation. Methods: Public databases were searched to identify bioactive compounds and related targets of PD as well as related genes in patients with CD. Analyses using the drug-compound-target-disease network, the protein-protein interaction (PPI) network, and Gene Ontology (GO) and Kyoto Encyclopedia of Genes and Genomes (KEGG) enrichment analyses were performed to predict the core targets and pathways of PD against CD. Colon tissue resected from patients with CD and tissue samples from a mouse model of CD fibrosis treated with PD were assessed to verify the major targets of PD in CD predicted by network pharmacologic analysis. Results: A search of the targets of bioactive compounds in PD and targets in CD identified 134 intersection targets. The target HSP90AA1, which was common to the drug-compound-target-disease and PPI networks, was used to simulate molecular docking with the corresponding bioactive compound. GO and KEGG enrichment analyses showed that multiple targets in the antifibrotic pathway were enriched and could be experimentally validated in CD patients and in a mouse model of CD fibrosis. Assays of colon tissues from CD patients showed that intestinal fibrosis was greater in stenoses than in nonstenoses, with upregulation of p-AKT, AKT, p-mTOR, mTOR, p-ERK1/2, ERK1/2, p-PKC, and PKC targets. Treatment of CD fibrosis mice with PD reduced the degree of fibrosis, with downregulation of the p-AKT, AKT, p-mTOR, mTOR, p-ERK1/2, ERK1/2, and PKC targets. Conclusion: Network pharmacology analysis was able to predict bioactive compounds in PD and their potential targets in CD. Several of these targets were validated experimentally, providing insight into the pharmacological mechanisms underlying the biological activities of PD in patients with CD.
Keywords: Crohn’s disease; Pulsatilla decoction; fibrosis; network pharmacology; pharmacological mechanisms.
Copyright © 2022 Liu, Zhang, Wang, Chen, Feng, He and Zhang.
Conflict of interest statement
The authors declare that the research was conducted in the absence of any commercial or financial relationships that could be construed as a potential conflict of interest.
Figures


Similar articles
-
Network pharmacology and molecular docking to elucidate the mechanism of pulsatilla decoction in the treatment of colon cancer.Front Pharmacol. 2022 Aug 8;13:940508. doi: 10.3389/fphar.2022.940508. eCollection 2022. Front Pharmacol. 2022. PMID: 36003525 Free PMC article.
-
Pharmacological Mechanism of Sancao Yuyang Decoction in the Treatment of Oral Mucositis Based on Network Pharmacology and Experimental Validation.Drug Des Devel Ther. 2023 Jan 13;17:55-74. doi: 10.2147/DDDT.S391978. eCollection 2023. Drug Des Devel Ther. 2023. PMID: 36660249 Free PMC article.
-
Network Pharmacology and Experimental Validation to Reveal the Pharmacological Mechanisms of Liuwei Dihuang Decoction Against Intervertebral Disc Degeneration.Drug Des Devel Ther. 2021 Dec 2;15:4911-4924. doi: 10.2147/DDDT.S338439. eCollection 2021. Drug Des Devel Ther. 2021. PMID: 34880601 Free PMC article.
-
Exploration of the mechanism of Zisheng Shenqi decoction against gout arthritis using network pharmacology.Comput Biol Chem. 2021 Feb;90:107358. doi: 10.1016/j.compbiolchem.2020.107358. Epub 2020 Aug 8. Comput Biol Chem. 2021. PMID: 33243703 Review.
-
Network pharmacology prediction and molecular docking-based strategy to explore the potential mechanism of Huanglian Jiedu Decoction against sepsis.Comput Biol Med. 2022 May;144:105389. doi: 10.1016/j.compbiomed.2022.105389. Epub 2022 Mar 9. Comput Biol Med. 2022. PMID: 35303581 Review.
Cited by
-
Network pharmacology and molecular docking reveal the mechanism of Qinghua Xiaoyong Formula in Crohn's disease.Korean J Physiol Pharmacol. 2023 Jul 1;27(4):365-374. doi: 10.4196/kjpp.2023.27.4.365. Korean J Physiol Pharmacol. 2023. PMID: 37386834 Free PMC article.
-
Pulsatilla decoction alleviates DSS-induced UC by activating FXR-ASBT pathways to ameliorate disordered bile acids homeostasis.Front Pharmacol. 2024 Jun 21;15:1399829. doi: 10.3389/fphar.2024.1399829. eCollection 2024. Front Pharmacol. 2024. PMID: 38974033 Free PMC article.
-
Role of Mitophagy in Regulating Intestinal Oxidative Damage.Antioxidants (Basel). 2023 Feb 14;12(2):480. doi: 10.3390/antiox12020480. Antioxidants (Basel). 2023. PMID: 36830038 Free PMC article. Review.
-
Mechanism underlying the effect of Pulsatilla decoction in hepatocellular carcinoma treatment: a network pharmacology and in vitro analysis.BMC Complement Med Ther. 2023 Nov 10;23(1):405. doi: 10.1186/s12906-023-04244-w. BMC Complement Med Ther. 2023. PMID: 37950195 Free PMC article.
-
Determining the mechanism of pulsatilla decoction for treating gastric cancer: a network pharmacology-based study.Front Oncol. 2023 Jun 9;13:1174848. doi: 10.3389/fonc.2023.1174848. eCollection 2023. Front Oncol. 2023. PMID: 37361599 Free PMC article.
References
LinkOut - more resources
Full Text Sources
Miscellaneous