. 2022 Apr 21;13(1):2174.
doi: 10.1038/s41467-022-29850-z.

Snf7 spirals sense and alter membrane curvature

Affiliations

Snf7 spirals sense and alter membrane curvature

Nebojsa Jukic et al. Nat Commun. .

Abstract

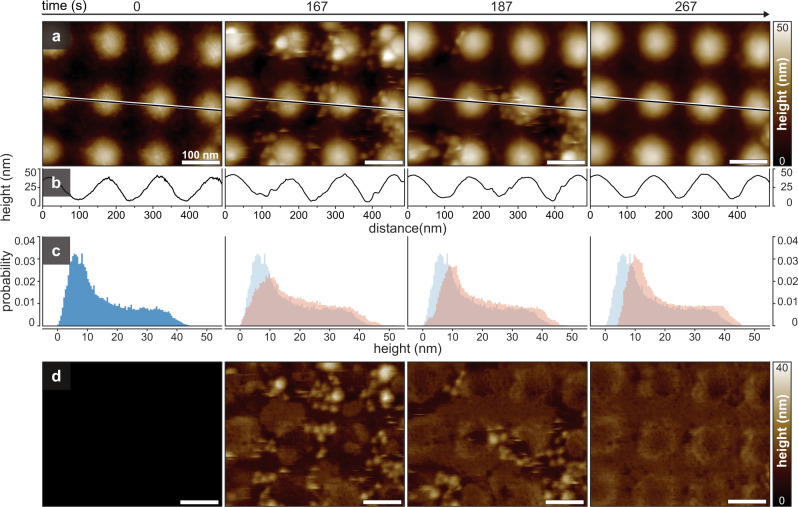
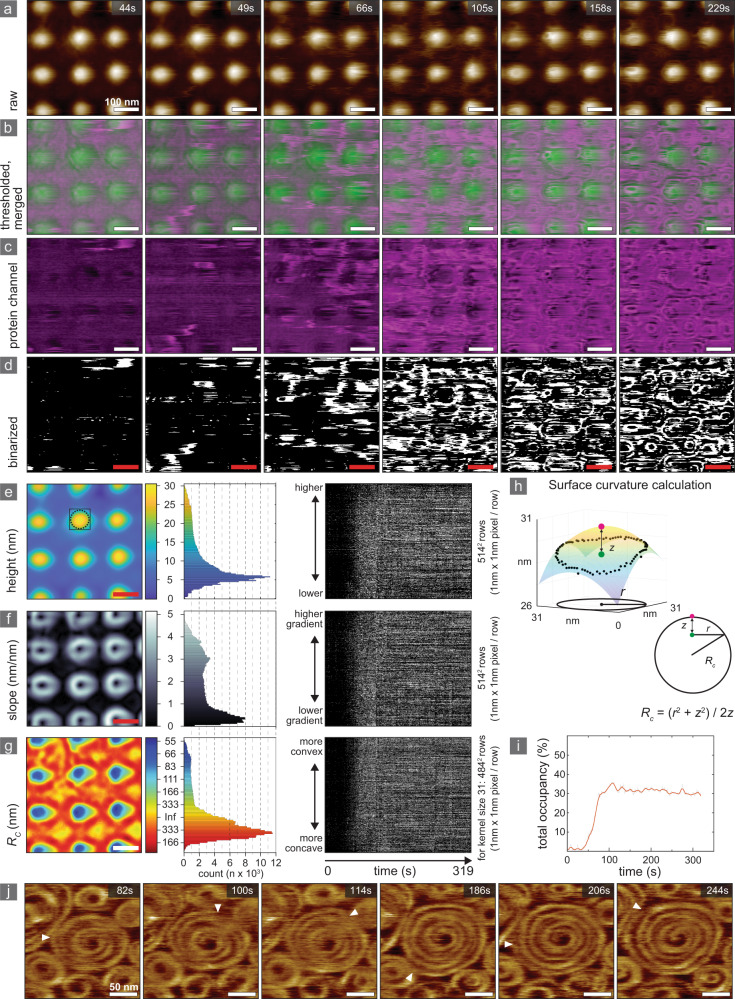
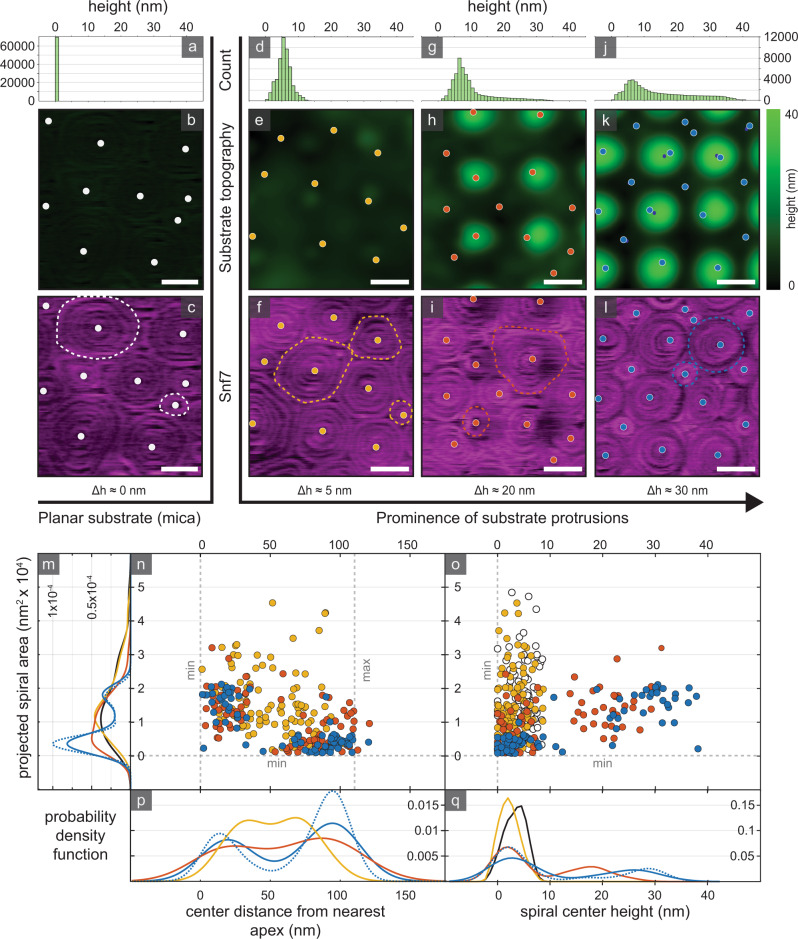
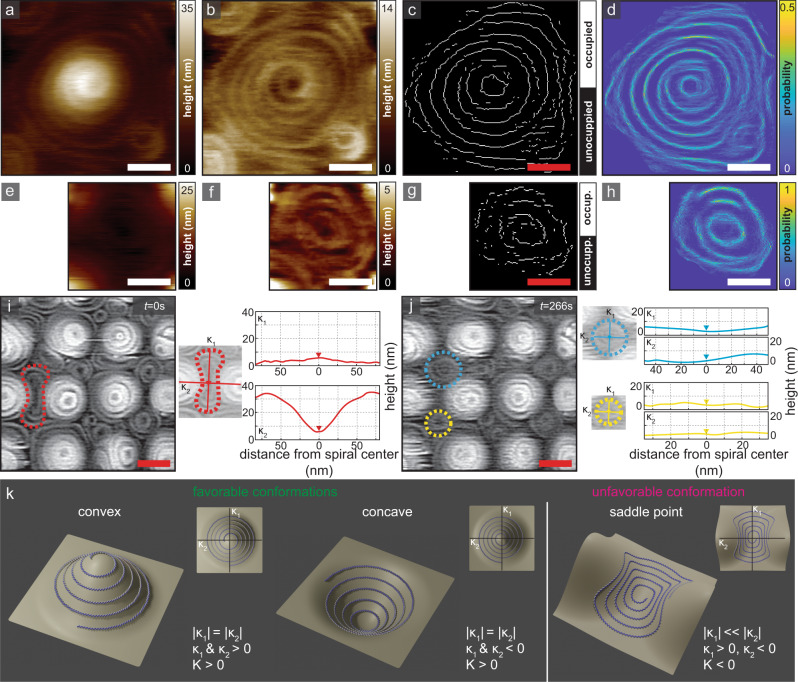
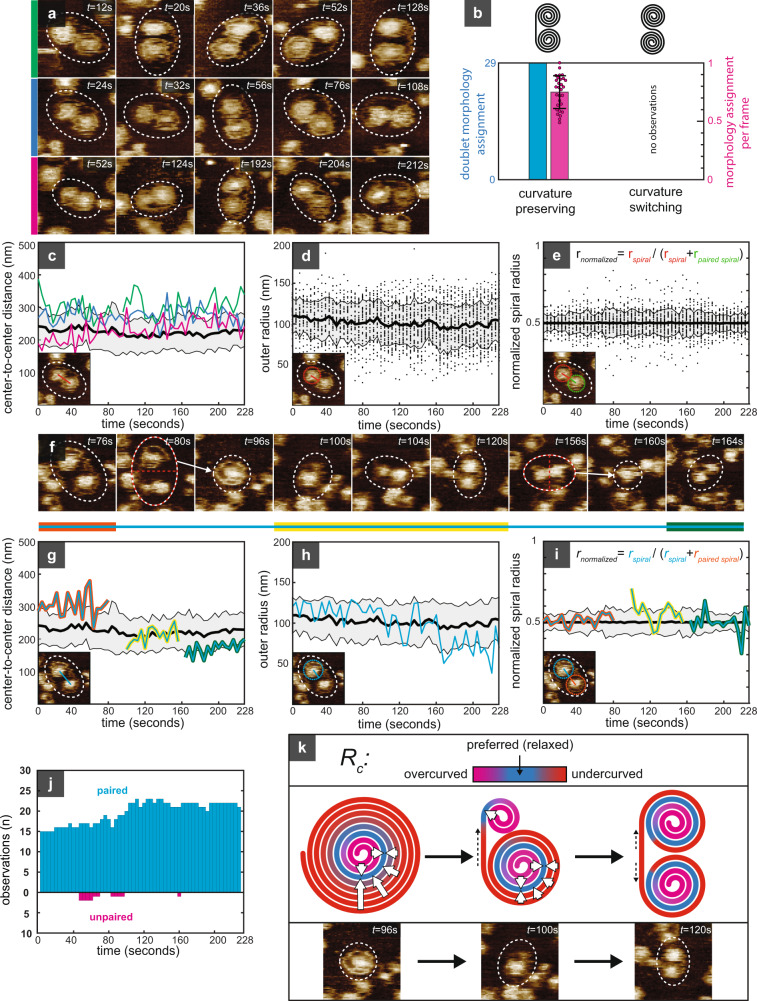
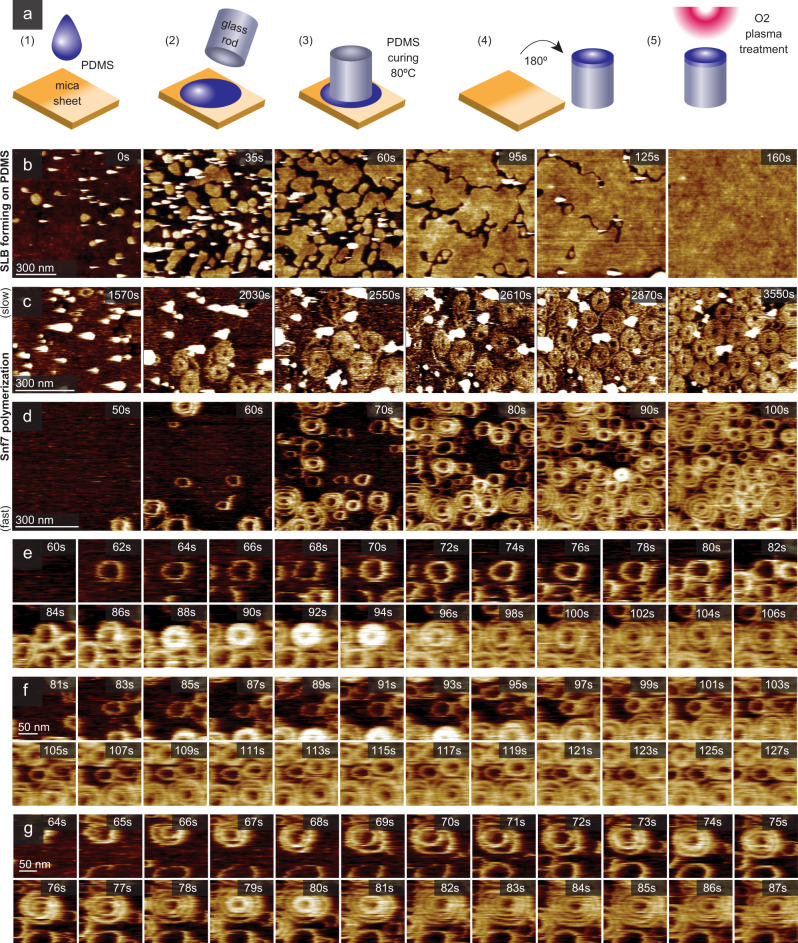
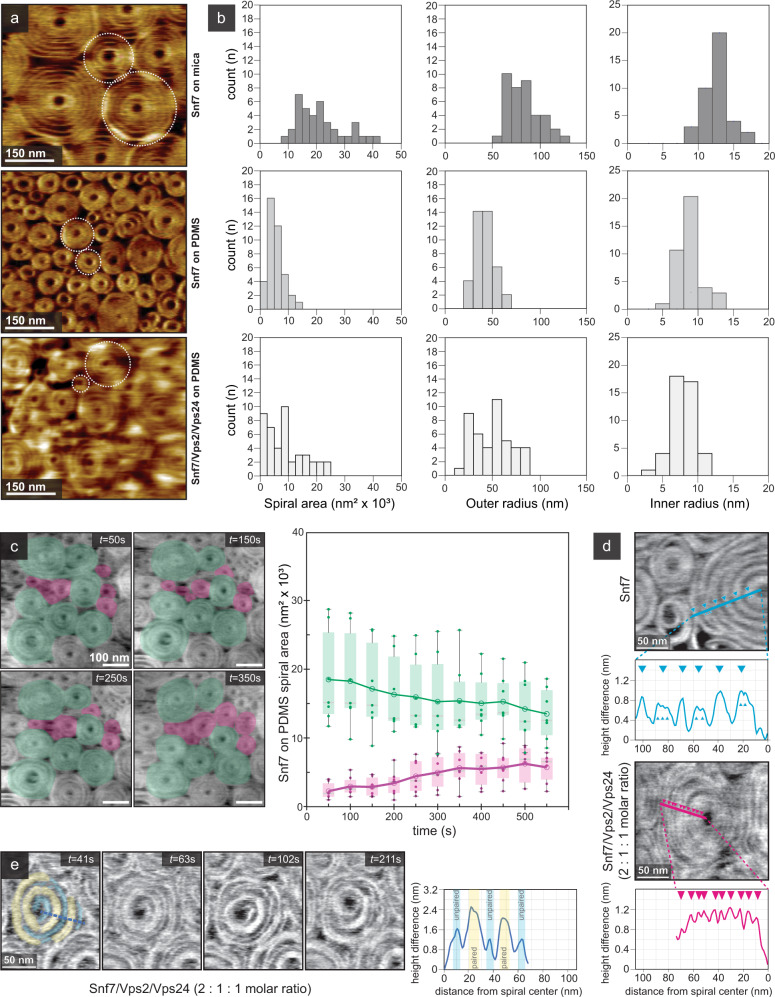
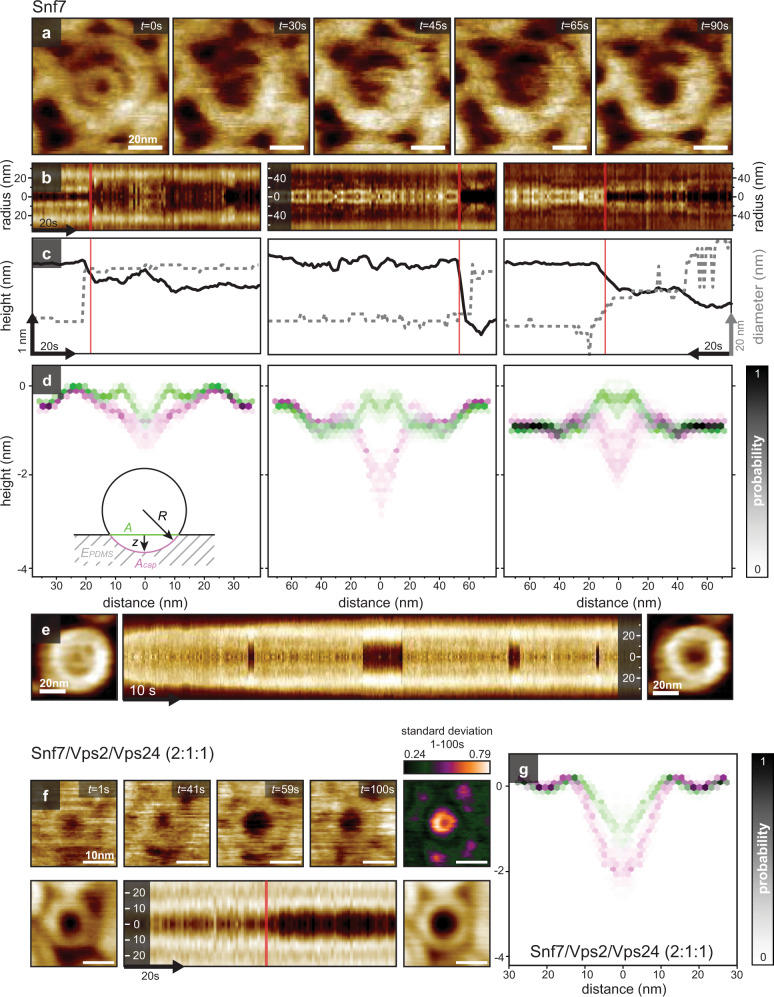
Endosomal Sorting Complex Required for Transport III (ESCRT-III) is a conserved protein system involved in many cellular processes resulting in membrane deformation and scission, topologically away from the cytoplasm. However, little is known about the transition of the planar membrane-associated protein assembly into a 3D structure. High-speed atomic force microscopy (HS-AFM) provided insights into assembly, structural dynamics and turnover of Snf7, the major ESCRT-III component, on planar supported lipid bilayers. Here, we develop HS-AFM experiments that remove the constraints of membrane planarity, crowdedness, and support rigidity. On non-planar membranes, Snf7 monomers are curvature insensitive, but Snf7-spirals selectively adapt their conformation to membrane geometry. In a non-crowded system, Snf7-spirals reach a critical radius, and remodel to minimize internal stress. On non-rigid supports, Snf7-spirals compact and buckle, deforming the underlying bilayer. These experiments provide direct evidence that Snf7 is sufficient to mediate topological transitions, in agreement with the loaded spiral spring model.


Conflict of interest statement

The authors declare no competing interests.

Figures

Fig. 1
Fig. 1. Time-lapse of SLB formation on undulated (concave-convex) nanopatterned HS-AFM supports.
a HS-AFM frames (Supplementary Movie 1) of the bilayer formation process: t = 0 s: Non-flat sample surface before addition of lipid. t = 167 s: SUVs deposit on the surface. t = 187 s: Vesicles start to spread and fuse to form a SLB. t = 267 s: The entire surface is membrane covered. b Line profiles along the dashed lines in a. c Height distribution histograms of the images shown in a: Height values shifted over time by the thickness of a bilayer (~4 nm; compare blue and orange height distributions at t = 0 s and t = 267 s, respectively. d Nanopattern-subtracted images of the images shown in a. Source data are provided as a Source Data file.
Fig. 2
Fig. 2. Snf7 adsorption and polymerization has no curvature preference.
HS-AFM images (Supplementary Movie 2) showing the polymerization of Snf7 on an undulated (concave-convex) nanopatterned support covered with a SLB: Raw data HS-AFM frames (a), merged support-channel (green) and Snf7 protein-channel (magenta) (b), separate Snf7 protein-channel (magenta) (c) and binarized protein-channel (d). Left: Substrate height (e), slope (f), and curvature (g) maps calculated from the support-channel. Middle: Binned histograms of height (e), slope (f) and curvature (g), respectively, with bin area proportional to the number of pixels of a given characteristic. Right: Unbinned occupancy of individual pixels by Snf7 (d) as a function of time (horizontal axis) and sorted by surface characteristic height (e), slope (f) and curvature (g). Each row represents an individual pixel, and each column represents a timepoint. h Schematic of spherical cap fitting procedure for surface curvature calculation. A sphere is fit to a ring of pixels with a user-defined radius (r, in this case, 15 pixels) from the central pixel. The radius of the fitted sphere (Rc) is determined from the ring radius (r) and the difference (z) between the mean height value of the pixels within the ring (green dot) and the height of the central pixel (magenta dot). The example shown in h corresponds to the outline in e. i Snf7 surface occupancy as a function of time, shown as percentage of the total frame pixel number. j HS-AFM visualization of spiral growth: the filament grows at the spiral periphery (Supplementary Movie 3). Source data are provided as a Source Data file.
Fig. 3
Fig. 3. Snf7 spirals are membrane curvature sensitive.
Height distributions of a planar support (a) and three different undulated supports (d, g, j). Support-channel of planar (b) and undulated supports of low (Δh ≈ 8 nm, e), moderate (Δh ≈ 25 nm, h), and prominent (Δh ≈ 35 nm, k) protrusions. (c, f, i, l) Protein-channel of Snf7 spirals on substrates (b, e, h, k), with representative spirals highlighted (dashed outlines). m Distributions of 2D-projected Snf7 spiral areas. Scatter plots of Snf7 spirals, with 2D-projected area versus spiral center distance from nearest apex (n) and versus spiral center height (o). Distributions of spiral center distance from nearest apex (p), and spiral center height (q). White: n = 99 spirals, 5 different imaging areas. Yellow: n = 98 spirals, 5 different imaging areas. Red: n = 80 spirals, 4 different imaging areas. Blue: n = 78 spirals, 5 different imaging areas. Scale bars: 100 nm. Plots (mq) are shown separated by substrate in Supplementary Fig. 3. Source data are provided as a Source Data file.
Fig. 4
Fig. 4. Membrane curvature-dependent Snf7 spiral stability and reshaping.
a HS-AFM, b Gaussian fitting flattened, c binarized, and d probability map of a single, large apical Snf7 spiral. The spiral displayed no reshaping over ∼5 min HS-AFM observation (Supplementary Movie 4). e HS-AFM, f Gaussian fitting flattened, g binarized, and h probability map of a single interstitial Snf7 spiral. The spiral displayed no reshaping over the ∼2 min HS-AFM observation (Supplementary Movie 5). Scale bars: (ah) 50 nm. i, j HS-AFM images of Snf7 spirals on an undulated support. A spiral on a saddle-shaped region (outlined in red in i) remodels into interstitial spirals (yellow and cyan in j) (Supplementary Movie 6). The line profiles (right) show the principal curvatures of the spirals. k Schematic illustrating an isolated Snf7 spiral adapting to convex and concave membrane geometry with rotationally symmetric principal curvatures (left and center, respectively) and a saddle point, where principal curvatures are of opposite signs and different magnitude (right). Source data are provided as a Source Data file.
Fig. 5
Fig. 5. Snf7 filaments minimize bending energy in non-crowded conditions.
a Time-lapse HS-AFM images of three representative spiral doublets (Supplementary Movie 7). b Morphology assignment of the doublets; curvature-preserving morphology could be assigned to all doublets at least once (cyan), and to 75 ± 14% of assemblies in each frame (magenta). No S-shaped doublets were observed. Error bars represent mean ± standard deviation of per-frame morphology assignment for n = 29 spiral doublets; magenta dots indicate percentage of frames in which morphology could be clearly assigned for each individual assembly. c Center-to-center distance between paired spirals. Colored lines show traces of doublets in a (mean ± sd of all observations: 225 ± 7 nm). d Distribution of spiral outer radii (black dots) over time. e Symmetry of spiral doublets: Distribution of normalized spiral radii (black dots) over time. f Time-lapse of a spiral doublet (dotted outline) that splits into one new spiral doublet and an isolated spiral (t = 96 s), which eventually reestablished doublet symmetry (t = 120 s), splits again into two doublets, which relaxed into symmetrical doublets (t = 164 s). Cyan line: spiral followed throughout the experiment. Multi-colored lines (cyan with red, yellow and green): periods reestablishing spiral pairing. g Multi-colored lines: center-to-center distance of successive doublets in f over time. Background trace as in c. h Outer radius of spiral in f over time. Background trace as in d. i Normalized spiral radius of the doublets formed by the spiral in f. Nascent spirals grow at the expense of the pre-existing spirals, reestablishing symmetry. j Histogram over time of paired (cyan) and unpaired (magenta) spirals. Unpaired spirals are only short-lived. k Middle: schematic of the proposed mechanism of doublet formation: Deviation from preferred spiral radius is penalized (red) and unpaired spirals rearrange into doublets to minimize undercurved filament length, thus reducing stress. Top: false-color scale for representation of local radius of curvature. Bottom: Experimental example of filament minimizing bending penalty. ce, gi Thick black lines and shaded areas represent mean ± sd of doublets in each frame. Dotted outlines of doublets or individual spirals are a guide to the eye. Source data are provided as a Source Data file.
Fig. 6
Fig. 6. PDMS sample support design, SLB formation and Snf7 spirals on a soft surface.
a Preparation of a soft PDMS sample support for HS-AFM. (1) A PDMS drop is pipetted onto atomically flat mica. (2) The HS-AFM sample stage is deposited on the PDMS droplet. (3) PDMS curing. (4) HS-AFM sample stage with PDMS layer is separated from mica sheet. (5) PDMS surface is O2-plasma treated to enhance hydrophilicity. The PDMS had a Young’s modulus of ~270 kPa (Supplementary Fig. 4). b SLB formation through SUV spreading and fusion (Supplementary Movie 8). c HS-AFM images of slow Snf7 polymerization on a PDMS-SLB (Supplementary Movie 9). d HS-AFM images of rapid Snf7 spiral polymerization on a PDMS-SLB (Supplementary Movie 10). HS-AFM time-lapse of a Snf7 spiral (e) polymerizing into a spiral of increased protrusion height, followed by a collapse into plane and spiral growth, (f) forming a closed stunted Snf7 ring unable of further growth, and (g) polymerizing into a large spiral displaying dynamics of the innermost turn.
Fig. 7
Fig. 7. Snf7 spiral dynamics on SLBs on a soft substrate.
a HS-AFM image of Snf7 spirals on mica (top), on PDMS (middle) and on PDMS after addition of Vps2/Vps24 to pre-polymerized Snf7 spirals (bottom). b Area (left), outer radius (center) and inner radius (right) distributions of Snf7 spirals on mica (top), on PDMS (middle) and on PDMS after addition of Vps2/Vps24 to pre-polymerized Snf7 spirals (bottom). c Left: HS-AFM time-lapse images of Snf7 spirals on PDMS-SLB (top right corner: time after Snf7-addition; overlays: spirals formed during initial polymerization (green, n = 7) and newly formed spirals (magenta, n = 7)(Supplementary Movie 11). Right: Box plot of Snf7 spiral area over time. Individual spiral areas are plotted as dots. Shaded boxes indicate 2nd and 3rd quartile. The whiskers of each boxplot extend to the most extreme data points. Empty circles connected by lines are the mean of each group; median of each group is represented by faint gray lines. d Top: Snf7 spiral on PDMS-SLB with line profile (cyan) showing height of spiral turns. Large cyan triangles show centers of turns, small cyan triangles point towards minor peaks within turns, corresponding to individual strands. Bottom: Spiral on PDMS-SLB after Vps2/Vps24 addition to pre-polymerized Snf7 spirals with line profile (magenta) showing height of individual spiral turns. Magenta triangles point towards individual filament peaks. e Left: Time lapse of individual spiral after addition of Vps2/Vps24 to pre-polymerized Snf7 spiral. Yellow overlays denote turns consisting of paired filaments, light blue overlays denote turns consisting of unpaired filaments. Right: height profile of the spiral taken at t = 41 s, with higher peaks (yellow) corresponding to paired filament turns, and lower peaks (light blue) corresponding to unpaired filament turns. Source data are provided as a Source Data file.
Fig. 8
Fig. 8. HS-AFM time-lapse images of a flat spiral to dome transition.
a HS-AFM images of a Snf7 spiral. b Three kymographs across the spiral center extracted from three different spirals transitioning to a dome (Supplementary Movies 13–15). c Height profiles along the center in the kymograph (black). Diameter of the innermost Snf7 filament (gray dashed line). d Height profiles extracted from b before (green) and after (magenta) the transition. Inset: Spherical dome model for membrane deformation (same color code as the height profiles). e Snf7 spiral undergoing reversible out-of-plane into-plane transitions during HS-AFM movie acquisition (Supplementary Movie 16). Left: in-plane configuration. Right: out-of-plane configuration of the same spiral. Center: Kymograph of the spiral morphology over time. f Top: HS-AFM images of a pre-polymerized Snf7 spiral after addition of Vps2/Vps24 (Supplementary Movie 17). Top right: Standard deviation map of the HS-AFM images. Bottom left: in-plane configuration (average over 50 frames). Bottom right: Out-of-plane configuration (average over 50 frames). Bottom center: Kymograph of the spiral morphology over time. g Height profiles extracted from f before (green) and after (magenta) the transition. Source data are provided as a Source Data file.

Similar articles

Cited by

References

    1. Baumgart T, Hess ST, Webb WW. Imaging coexisting fluid domains in biomembrane models coupling curvature and line tension. Nature. 2003;425:821–824. doi: 10.1038/nature02013. - DOI - PubMed
    1. Semrau S, Schmidt T. Membrane heterogeneity – from lipid domains to curvature effects. Soft. Matter. 2009;5:3174–3186. doi: 10.1039/b901587f. - DOI
    1. Ford MGJ, et al. Curvature of clathrin-coated pits driven by epsin. Nature. 2002;419:361–366. doi: 10.1038/nature01020. - DOI - PubMed
    1. Eitzen G. Actin remodeling to facilitate membrane fusion. Biochim. Biophys. Acta Mol. Cell Res. 2003;1641:175–181. doi: 10.1016/S0167-4889(03)00087-9. - DOI - PubMed
    1. Giardini PA, Fletcher DA, Theriot JA. Compression forces generated by actin comet tails on lipid vesicles. Proc. Natl Acad. Sci. 2003;100:6493. doi: 10.1073/pnas.1031670100. - DOI - PMC - PubMed

Publication types

MeSH terms

Substances