. 2022 Apr 21;13(1):2172.
doi: 10.1038/s41467-022-29694-7.

Emergence of novel cephalopod gene regulation and expression through large-scale genome reorganization

Affiliations

Emergence of novel cephalopod gene regulation and expression through large-scale genome reorganization

Hannah Schmidbaur et al. Nat Commun. .

Abstract

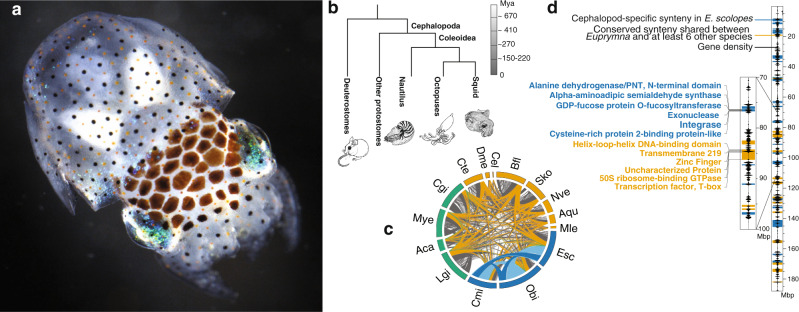
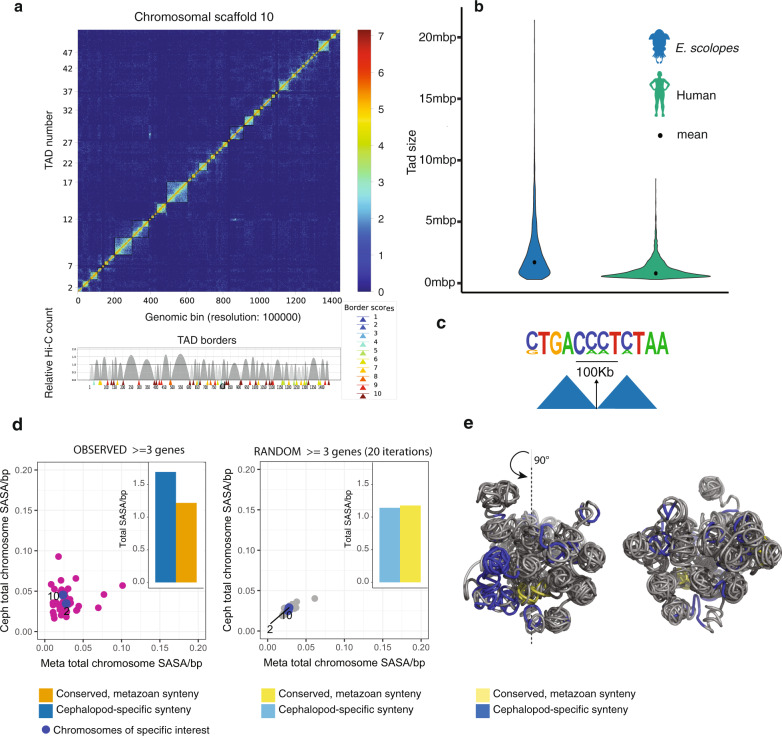
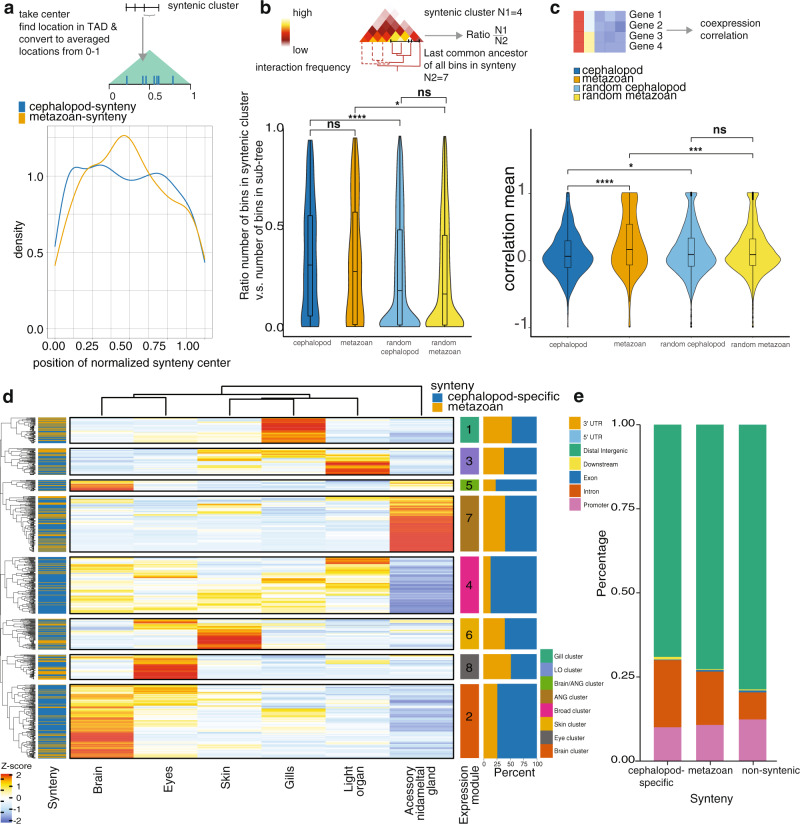
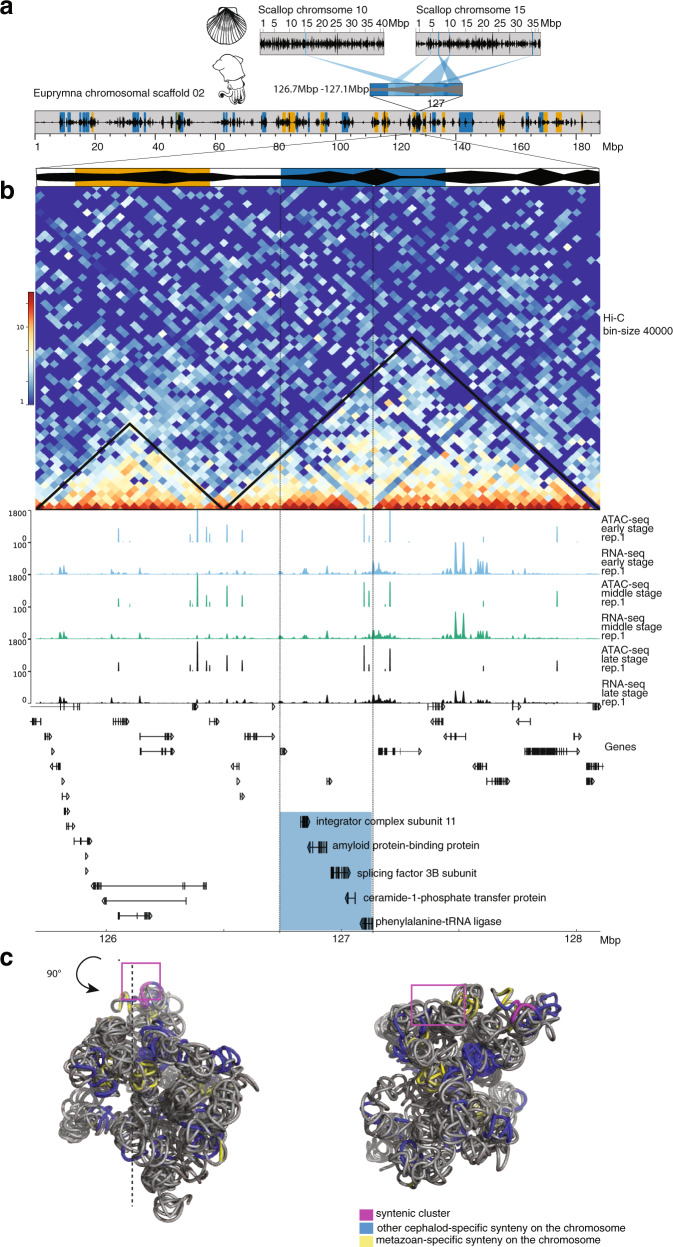
Coleoid cephalopods (squid, cuttlefish, octopus) have the largest nervous system among invertebrates that together with many lineage-specific morphological traits enables complex behaviors. The genomic basis underlying these innovations remains unknown. Using comparative and functional genomics in the model squid Euprymna scolopes, we reveal the unique genomic, topological, and regulatory organization of cephalopod genomes. We show that coleoid cephalopod genomes have been extensively restructured compared to other animals, leading to the emergence of hundreds of tightly linked and evolutionary unique gene clusters (microsyntenies). Such novel microsyntenies correspond to topological compartments with a distinct regulatory structure and contribute to complex expression patterns. In particular, we identify a set of microsyntenies associated with cephalopod innovations (MACIs) broadly enriched in cephalopod nervous system expression. We posit that the emergence of MACIs was instrumental to cephalopod nervous system evolution and propose that microsyntenic profiling will be central to understanding cephalopod innovations.


Conflict of interest statement

The authors declare no competing interests.

Figures

Fig. 1
Fig. 1. Large-scale syntenic reorganization of cephalopod genomes.
a Photograph of an Euprymna scolopes hatchling. b Schematic tree with divergence times of major cephalopod lineages from deuterostomes and other protostomes,. c Circos plot showing loss of syntenies conserved in other metazoans and the emergence of a large number of novel, cephalopod-specific microsyntenies within cephalopods. Each line represents a syntenic cluster shared between different species. Orange lines indicate syntenic clusters shared between at least seven out of these 24 species (ancestral, metazoan clusters); green lines represent novel molluscan syntenies, shared between five or more molluscs but not present in any non-molluscan species. Blue lines represent cephalopod-specific syntenies shared between either all three cephalopod species (dark blue) or two of the three cephalopod species (light blue) but not present in any non-cephalopod species; gray lines represent other syntenies that do not fall in either of the previous categories. Abbreviations: Aca - Acanthaster planci, Aqu – Amphimedon queenslandica, Bfl - Branchiostoma floridae,Cel - Caenorhabditis elegans, Cgi - Crassostrea gigas, Cmi - Callistoctopus minor, Cte - Capitella teleta, Dme - Drosophila melanogaster, Esc – Euprymna scolopes, Lgi - Lottia gigantea, Mle - Mnemiopsis leidyi, Mye - Mizuhopecten yessoensis, Nve - Nematostella vectensis, Obi – Octopus bimaculoides, Sko - Saccoglossus kowalevskii d Example of one whole chromosomal-scale scaffold (right) of E. scolopes showing the distribution of gene density, cephalopod-specific (blue) and conserved, metazoan (orange) syntenies. Inset (left) with locations of genes within two specific syntenic blocks.
Fig. 2
Fig. 2. Topological and spatial organization of the cephalopod genome.
a Top: Hi-C normalized interaction matrix at 100 kb resolution for chromosomal scaffold 10. Bottom: Relative Hi-C count and TAD boundary scores as predicted by tadbit (1 = lowest, 10 = highest). b Violin plot of TAD size distributions for human and Euprymna scolopes computed at 100 kb resolution, plotted in 100 kb bins. c CTCF binding motif as identified by homer motif search in 100 kbp of predicted TAD boundaries. d Solvent area surface exposure (SASA) per bp for individual chromosomal scaffolds (observed and random). Conserved metazoan synteny on x-axis, cephalopod-specific microsynteny on y-axis. e Three-dimensional model of chromosomal scaffold 10 with novel (blue) and conserved (yellow) microsynteny locations labeled. Left and right models are the same, shifted by 90°.
Fig. 3
Fig. 3. Novel cephalopod microsyntenies and their regulatory properties in Euprymna scolopes.
a Ratio between densities of the center of observed and randomized microsynteny locations within normalized TADs. Ratio increases towards the center of TADs for metazoan syntenies and decreases for cephalopod synteny. b Compactness of novel and metazoan microsynteny, compared to random simulations. Microsyntenic clusters must contain at least 3 genes, if fewer genes were annotated to the tree, these clusters were excluded. Plotted are the ratios between the number of bins (at 40 kb Hi-C resolution, cephalopod micrysynteny bins n = 143,969, metazoan microsynteny bins n = 82,417, random cephalopod microsynteny bins n = 3,499,849, random metazoan microsynteny bins n = 1,889,687) in microsyntenic clusters (within 7 and 25 bins, valid microsyntenies: cephalopod n = 265, metazoan n = 125, random cephalopod n = 4265, random metazoan n = 2180) and the number of “descendant” bins from the last common ancestor of those microsyntenic bins (“Methods”, cephalopod n = 143,969, metazoan n = 82,417, random cephalopod n = 3,499,849, random metazoan n = 1,889,687). The ratio (n = 6835) of the number of bins in a cluster and the number of bins in the sub-tree were compared by two sided Wilcoxon rank-sum test comparing the linked groups (****p < 0.0001, * < 0.05, ns: not significant). The closer the ratio to 1, the lower is the difference between the size of the syntenic block and the number of bins in an extracted tree. Violin plots—distribution, boxes—interquartile range (cephalopod = lower 0.06, upper 0.56, metazoan = lower 0.01, upper 0.58, random cephalopod = lower 0.01, upper 0.49, random metazoan = lower 0.01, upper 0.46), bars—median (cephalopod = 0.31, metazoan = 0.28, random cephalopod = 0.18, random metazoan = 0.17), whiskers—furthest sample within 1.5x interquartile range (cephalopod = min 0.002, max 0.94, metazoan = min 0.002, max 0.95, random cephalopod = min 0.002, max 0.96, random metazoan = min 0.002, max 0.96), maximum and minimum ratios: cephalopod = min 0.00189, max = 0.941, metazoan = min 0.00217, max = 0.952, random cephalopod = min 0.00151, max 0.962, random metazoan = min 0.00150, max 0.96. c Co-expression correlation of genes in microsyntenic clusters (cephalopod n = 476, metazoan n = 236, random cephalopod n = 6925, random metazoan n = 4038). The co-expression correlation of metazoan syntenies is higher than that of cephalopod-specific syntenies or random clusters (****p < 0.0001, ***p < 0.001, * < 0.05). Violin plots—distribution, boxes—furthest sample within 1.5x interquartile range (cephalopod = min −0.69, max 0.87, metazoan = min −0.63, max 1.0, random cephalopod = min −0.72, max 0.95, random metazoan min −0.66, max 0.9), bars—median (cephalopod = 0.05, metazoan = 0.15, random cephalopod = 0.07670835, random metazoan = 0.07) outliers were excluded from these numbers. Maximum and minimum values: −1 and 1 in all cases. d Clustering of mean expression per synteny cluster, color-coded by synteny type, expression among Euprymna scolopes adult tissues. Syntenic clusters form eight expression modules with specific expression patterns. Expression matrix is z-score normalized. Light organ—E. scolopes-specific organ harboring symbionts, accessory nidamental gland—female-specific reproductive organ of some squid species. e Annotation of ATAC peak location in late organogenesis. Peaks annotated as associated with cephalopod-specific microsyntenies are more often found in intronic regions. Promotor defined as +10 kb and −10 kb predicted transcription start site.
Fig. 4
Fig. 4. Emergence of compact clusters and their unique expression patterns in nervous tissues.
a Location of orthologous genes of one of the MACIs in Mizuhopecten yessoensis. The genes are located on two separate chromosomes (top—whole chromosome, bottom—zoom in, black—gene density, blue—location of orthologous genes) with many intervening genes in-between. Scallop orthologs of genes in the microsyntenic cluster are plotted at the bottom highlighted in blue. b Genes of the same cluster in Euprymna scolopes. The genes (highlighted in blue) are tightly packed on one chromosomal scaffold with only one intervening gene (top—whole chromosomal scaffold, bottom—zoom in, orange—conserved, metazoan microsyntenic clusters, blue—cephalopod-specific microsyntenic clusters). The cluster is located within a TAD. Two major ATAC-seq peaks are present in intronic regions of the last gene of the cluster in three developmental stages (y-axis—signal value). RNA-seq read count of three developmental stages shows several small peaks in the region of the cluster (y-axis—read count). Early-stage—early organogenesis, stage 20, middle stage—late organogenesis, stage 24/25, late stage—close to hatching, stage 28/29. c Three-dimensional reconstruction of chromosomal scaffold 2. The cephalopod-specific syntenic cluster is located on the surface. Left and right views are shifted by 90°.
Fig. 5
Fig. 5. Expression of genes in a representative MACI in late developmental stages of E. scolopes.
a Heatmap showing expression of orthologous genes of the cephalopod-specific cluster in adult scallop and E. scolopes tissues showing neuronal expression in both species. Scale bar shows z-score normalized expression levels per row. b Scheme of late stage (Stage 27–29) E. scolopes anatomy and section of hatchling. c Expression of MACI genes in nervous tissues and inner organs of late developmental stages of E. scolopes. All genes show expression in different lobes of the brain, most dominantly the ASM and PSM. Light expression patterns are present in the optic lobes, the digestive gland and intestines in most genes. Expression patterns differ to Beta-tubulin, which was chosen as a control for its pan-neuronal expression domain, in its intensity and distribution. Scale bars = 100 µm. ASM anterior subesophageal mass, DG digestive gland, ES esophagus, FT funnel organ, GI gills, INT intestine, IS ink sack, IYO internal yolk, OL optic lobe, PSM posterior subesophageal mass, ST statocyst. Dotted circles - color trapping.

Similar articles

Cited by

References

    1. Ritschard EA, et al. Coupled genomic evolutionary histories as signatures of organismal innovations in cephalopods: co-evolutionary signatures across levels of genome organization may shed light on functional linkage and origin of cephalopod novelties. BioEssays N. Rev. Mol. Cell. Dev. Biol. 2019;41:e1900073. - PubMed
    1. Albertin CB, et al. The octopus genome and the evolution of cephalopod neural and morphological novelties. Nature. 2015;524:220–224. doi: 10.1038/nature14668. - DOI - PMC - PubMed
    1. Belcaid M, et al. Symbiotic organs shaped by distinct modes of genome evolution in cephalopods. Proc. Natl Acad. Sci. USA. 2019;116:3030–3035. doi: 10.1073/pnas.1817322116. - DOI - PMC - PubMed
    1. Engström PG, Ho Sui SJ, Drivenes O, Becker TS, Lenhard B. Genomic regulatory blocks underlie extensive microsynteny conservation in insects. Genome Res. 2007;17:1898–1908. doi: 10.1101/gr.6669607. - DOI - PMC - PubMed
    1. Irimia M, et al. Extensive conservation of ancient microsynteny across metazoans due to cis-regulatory constraints. Genome Res. 2012;22:2356–2367. doi: 10.1101/gr.139725.112. - DOI - PMC - PubMed

Publication types