. 2022 Apr 18;9(4):177.
doi: 10.3390/bioengineering9040177.

HLA-A2 Promotes the Therapeutic Effect of Umbilical Cord Blood-Derived Mesenchymal Stem Cells in Hyperoxic Lung Injury

Affiliations

HLA-A2 Promotes the Therapeutic Effect of Umbilical Cord Blood-Derived Mesenchymal Stem Cells in Hyperoxic Lung Injury

Jihye Kwak et al. Bioengineering (Basel). .

Abstract

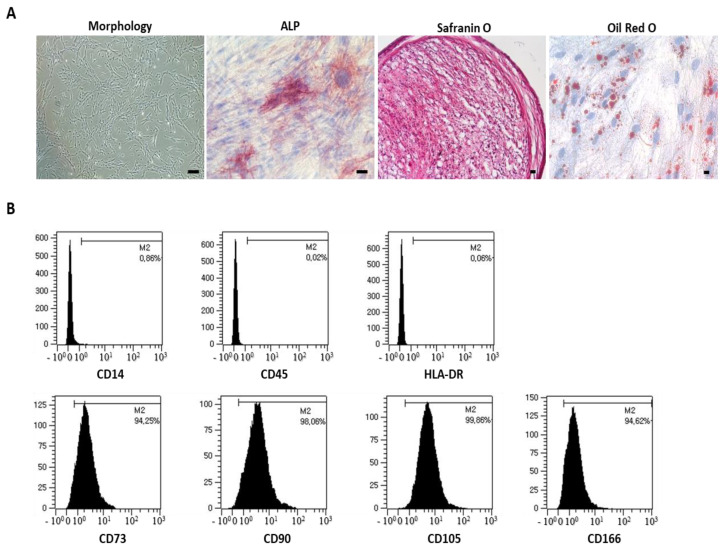
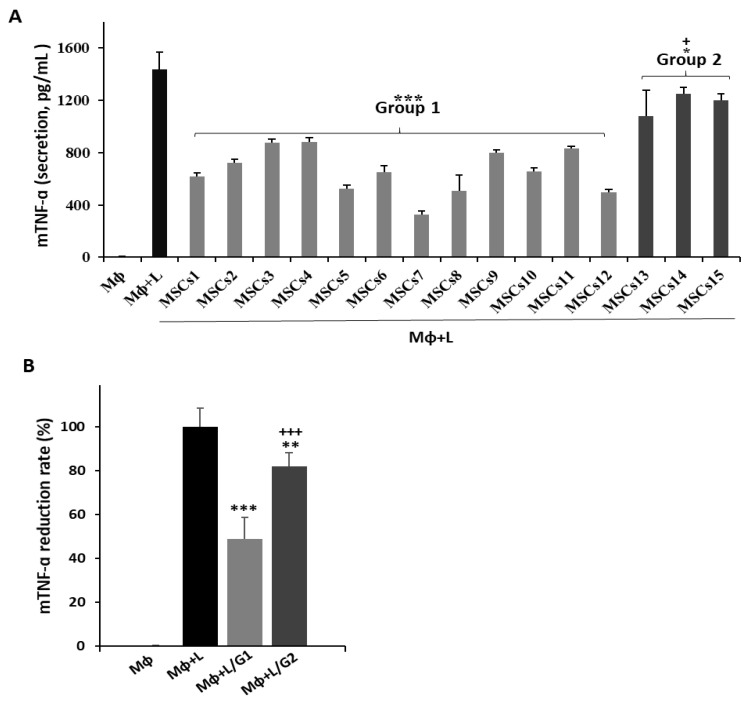
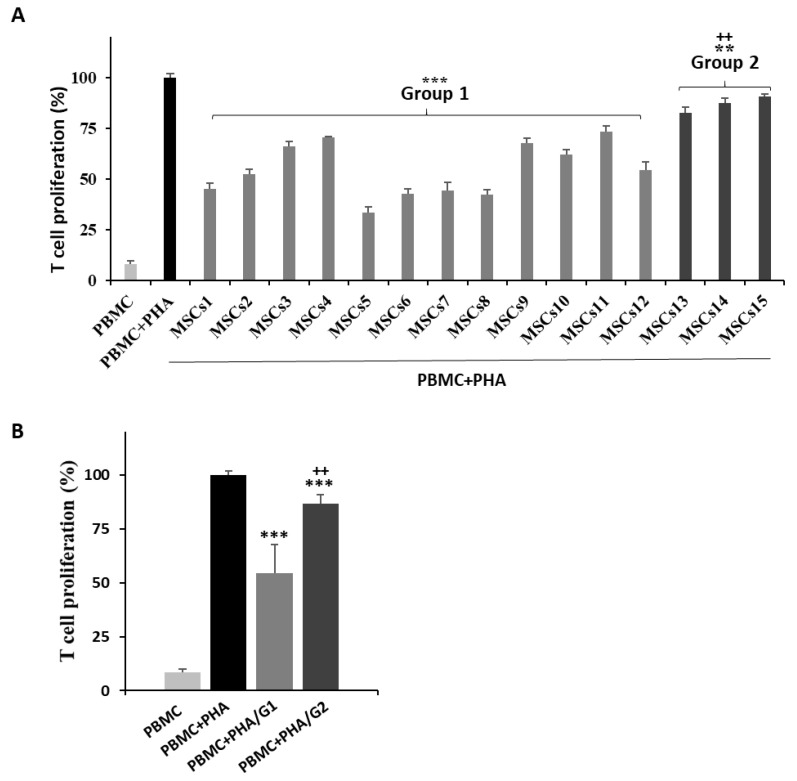
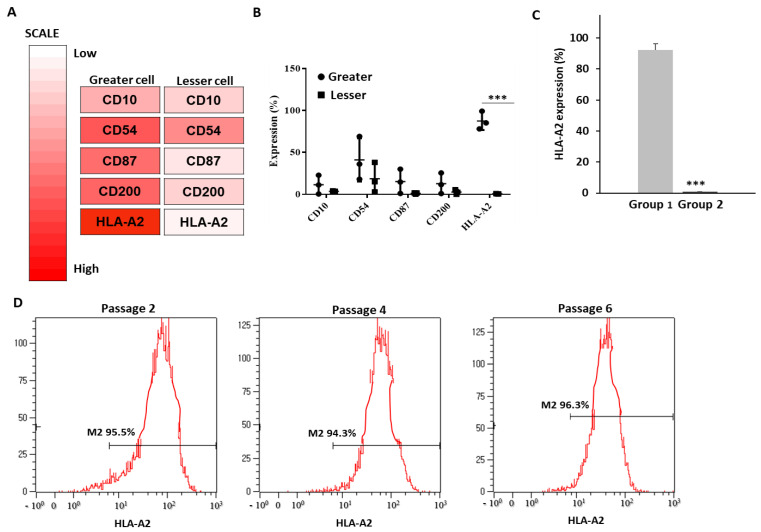
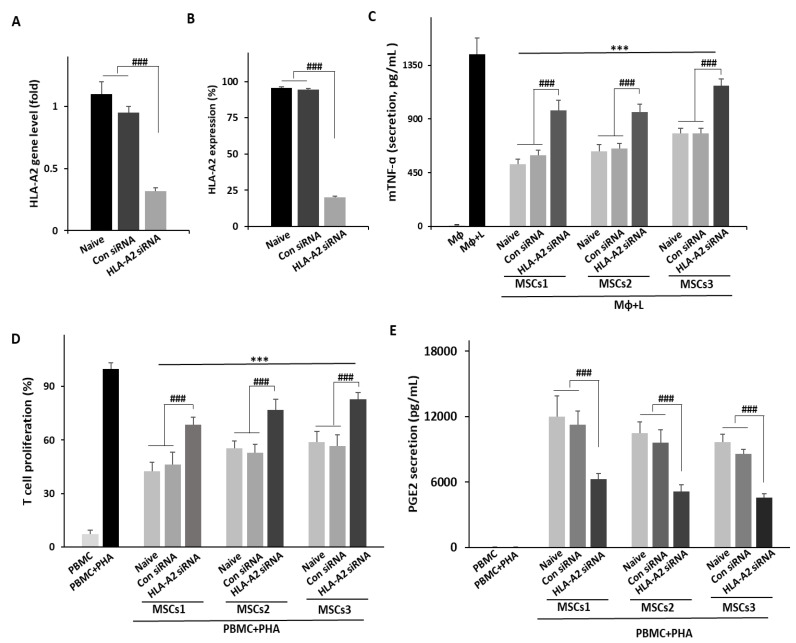
Mesenchymal stem cells (MSCs) are one of the most extensively studied stem cell types owing to their capacity for differentiation into multiple lineages as well as their ability to secrete regenerative factors and modulate immune functions. However, issues remain regarding their further application for cell therapy. Here, to demonstrate the superiority of the improvement of MSCs, we divided umbilical cord blood-derived MSCs (UCB-MSCs) from 15 donors into two groups based on efficacy and revealed donor-dependent variations in the anti-inflammatory effect of MSCs on macrophages as well as their immunoregulatory effect on T cells. Through surface marker analyses (242 antibodies), we found that HLA-A2 was positively related to the anti-inflammatory and immunoregulatory function of MSCs. Additionally, HLA-A2 mRNA silencing in MSCs attenuated their therapeutic effects in vitro; namely, the suppression of LPS-stimulated macrophages and phytohemagglutinin-stimulated T cells. Moreover, HLA-A2 silencing in MSCs significantly decreased their therapeutic effects in a rat model of hyperoxic lung damage. The present study provides novel insights into the quality control of donor-derived MSCs for the treatment of inflammatory conditions and diseases.

Keywords: HLA-A2; T cell suppression; UCB-MSCs; anti-inflammation; hyperoxic lung damage; quality control; surface maker array.


Conflict of interest statement

The authors declare no conflict of interest.

Figures

Figure 1
Figure 1
Characterization of MSCs at P6. (A) Morphological analysis shows adherent spindle-shaped cells. During incubation in a specialized induction medium, multilineage potential was demonstrated by staining typical multilineage markers. Osteogenic cells were analyzed based on ALP levels. Chondrogenic cells accumulated sulfated proteoglycans stained with Safranin O. Adipogenic cells exhibited increased lipid vacuoles within the cytoplasm via Oil Red O staining. Nuclei were counterstained with hematoxylin. Scale bar: 100 µm. (B) Flow cytometric analysis of cells based on the cell surface expression of typical MSC markers. Cells were negative for CD14, CD45, and HLA-DR but strongly positive for CD73, CD90, CD105, and CD166. M2-related expression was noted.
Figure 2
Figure 2
Anti-inflammatory effect of UCB-MSCs in LPS-stimulated macrophages. RAW 264.7 cells were exposed to LPS and co-cultured with UCB-MSCs for 2 days. (A,B) Cell supernatants were analyzed for inflammatory cytokine TNF-α levels via ELISA. Fifteen different MSC lots were evaluated, all of which exhibited anti-inflammatory effects. MSCs were divided into two groups based on the extent of TNF-α suppression; namely, Group 1 (MSCs1 to MSCs12) and Group 2 (MSCs13 to MSCs15). (A) Error bars represent the means ± SD, n = 5 per group; *** p < 0.001, ** p < 0.01, * p < 0.05 vs. MΦ + L, +++ p < 0.001, + p < 0.05 vs. Group 1. (B) Data are presented as the mean ± SD for n = 5 (MΦ, MΦ + L), n = 60 (MΦ + L/G1), or n = 12 (MΦ + L/G2) per group; *** p < 0.001 vs. MΦ + L, + p < 0.05 vs. MΦ + L/G1. MΦ: macrophage; L: LPS; G1: Group 1; G2: Group 2.
Figure 3
Figure 3
Effect of UCB-MSCs on human T cell proliferation in the MLR assay. PHA-stimulated PBMCs were co-cultured with MSCs for 3 days. (A,B) The proliferation of T cells is shown as a percentage relative to the positive control (PBMC + PHA; set to 100%). Fifteen different MSCs were evaluated to confirm their T cell-suppressive effects. All MSCs suppressed T cell proliferation. Based on MLR assay results, MSCs were classified two groups depending on the extent of T cell suppression; namely, Group 1 (MSCs1 to MSCs12) and Group 2 (MSCs13 to MSCs15). (A) Error bars represent means ± SD, n = 5 per group; *** p < 0.001, ** p < 0.01 vs. PBMC + PHA, ++ p < 0.01 vs. Group 1. (B) Data are presented as the mean ± SD for n = 5 (PBMC, PBMC + PHA), n = 60 (PBMC + PHA/G1), or n = 12 (PBMC + PHA/G2) per group; *** p < 0.001 vs. PBMC + PHA, ++ p < 0.01 vs. PBMC + PHA/G1. PBMC: peripheral blood mononuclear cell; PHA: phytohemagglutinin; G1: Group 1; G2: Group 2.
Figure 4
Figure 4
Screening for UCB-MSC cell surface markers. We prepared three lots from each group, labeling those from Group 1 as greater cells and those from Group 2 as lesser cells. (A) Heat map analysis showing cell surface markers upregulated in greater compared with lesser cells. (B) To confirm the increase in surface protein expression observed during screening, the CD10, CD54, CD200, and HLA-A2 expression was assessed via flow cytometry (means ± SD, n = 3; *** p < 0.01). HLA-A2 expression was lowest in lesser cells. (C) To confirm the downregulation of cell surface proteins shown in panel B, HLA-A2 expression on UCB-MSCs from 15 different donors (Group 1 and Group 2) was analyzed via flow cytometry. HLA-A2 expression was significantly higher in Group 1 compared with Group 2. Data are presented as mean ± SD for n = 36 (Group 1) or n = 9 (Group 2) per group. *** p < 0.001. (D) During expansion, HLA-A2 expression was measured via flow cytometry at the indicated passages. Positive M2-related expression was noted.
Figure 5
Figure 5
HLA-A2 knockdown in MSCs attenuates their therapeutic effects in vitro. Cells were transfected with control siRNA or HLA-A2 siRNA. (A) Gene expression and (B) protein levels of HLA-A2 were compared relative to those in non-transfected MSCs (naïve). (A,B) Error bars represent means ± SD, n = 3 per group; ### p < 0.001. (C,E) MSCs from three different lots of Group 1 were evaluated to confirm their therapeutic effects in vitro. (C) HLA-A2 siRNA-treated MSCs were co-cultured with LPS-induced RAW 246.7 cells and TNF-α levels were assessed via ELISA. Lower levels of TNF-α were detected in media from HLA-A2 knockdown MSCs. Error bars represent means ± SD, n = 3 per group; ### p < 0.001, *** p < 0.001 vs. MΦ + L. (D) Proliferation of human T cells based on MLR assays. PBMCs were co-cultured with MSCs. The proliferation of responding cells is shown as a percentage relative to the positive control (PBMC + PHA; set to 100%). (E) Levels of PGE2 in the culture media of cells from the MLR assay. Lower levels of PGE2 were noted in media from HLA-A siRNA MSCs. (D,E) Error bars represent means ± SD, n = 3 per group; ### p < 0.001, *** p < 0.001 vs. PBMC + PHA. MΦ: macrophage; L: LPS; PBMC: peripheral blood mononuclear cell; PHA: phytohemagglutinin.
Figure 6
Figure 6
HLA-A2 knockdown suppressed the therapeutic efficacy of MSCs by inhibiting macrophage polarization. HLA-A2 siRNA-treated MSCs were intratracheally injected in BPD rats. (A) HLA-A2 siRNA-transfected MSCs were intratracheally injected on Day 5. Daily survival rates during a 14-day period from birth are presented as Kaplan–Meier survival curves. Lung tissues obtained on Day 14 were compared with those from the control group (Normal). (B) The mean linear intercept (MLI) values were evaluated by the degree of alveolarization. (C) Lung tissues were sectioned and stained with H&E. Results are presented as the mean ± SD for n = 11 (Normal), n = 15 (BPD, BPD with naïve MSC), or n = 14 (con siRNA MSCs, HLA-A2 siRNA MSCs) per group. (D,F) Immunofluorescence analysis for (D) CD11b/c or (F) CD163 in lung tissues. (D) Nuclei were stained with Hoechst 33342 (blue). Red (CD11b) and green (CD163) staining indicates positive cells. Scale bar: 10 µm. Expression of (E) CD11b/c and CD163 (F) was assessed as the percentage of positively stained cells. The levels of (H) TNF-α and (i) IL-10 in the BALF were analyzed by ELISA on Day 14. (C,EI) Data are presented as the mean ± SD, n = 3 per group. *** p < 0.001, ** p < 0.01, * p < 0.05 vs. normal, ### p < 0.001, ## p < 0.001, # p < 0.05 vs. BPD, # p < 0.05 vs. BPD, ++ p < 0.01 vs control group (naïve MSCs or con siRNA MSCs). BPD: bronchopulmonary dysplasia; BLAF: bronchoalveolar lavage fluid.

Similar articles

References

    1. Samsonraj R.M., Raghunath M., Nurcombe V., Hui J.H., van Wijnen A.J., Cool S.M. Concise Review: Multifaceted Characterization of Human Mesenchymal Stem Cells for Use in Regenerative Medicine. Stem Cells Transl. Med. 2017;6:2173–2185. doi: 10.1002/sctm.17-0129. - DOI - PMC - PubMed
    1. Pittenger M.F., Discher D.E., Péault B.M., Phinney D.G., Hare J.M., Caplan A.I. Mesenchymal stem cell perspective: Cell biology to clinical progress. NPJ. Regen. Med. 2019;4:22. doi: 10.1038/s41536-019-0083-6. - DOI - PMC - PubMed
    1. Lee M., Jeong S.Y., Ha J., Kim M., Jin H.J., Kwon S.J., Chang J.W., Choi S.J., Oh W., Yang Y.S., et al. Low immunogenicity of allogeneic human umbilical cord blood-derived mesenchymal stem cells in vitro and in vivo. Biochem. Biophys. Res. Commun. 2014;446:983–989. doi: 10.1016/j.bbrc.2014.03.051. - DOI - PubMed
    1. Um S., Ha J., Choi S.J., Oh W., Jin H.J. Prospects for the therapeutic development of umbilical cord blood-derived mesenchymal stem cells. World J. Stem. Cells. 2020;12:1511–1528. doi: 10.4252/wjsc.v12.i12.1511. - DOI - PMC - PubMed
    1. Wu X., Jiang J., Gu Z., Zhang J., Chen Y., Liu X. Mesenchymal stromal cell therapies: Immunomodulatory properties and clinical progress. Stem Cell Res. Ther. 2020;11:345. doi: 10.1186/s13287-020-01855-9. - DOI - PMC - PubMed