. 2022 Apr;1(4):344-360.
doi: 10.1038/s44161-022-00027-7. Epub 2022 Mar 28.

TRPM2 deficiency in mice protects against atherosclerosis by inhibiting TRPM2-CD36 inflammatory axis in macrophages

Affiliations

TRPM2 deficiency in mice protects against atherosclerosis by inhibiting TRPM2-CD36 inflammatory axis in macrophages

Pengyu Zong et al. Nat Cardiovasc Res. 2022 Apr.

Erratum in

Abstract

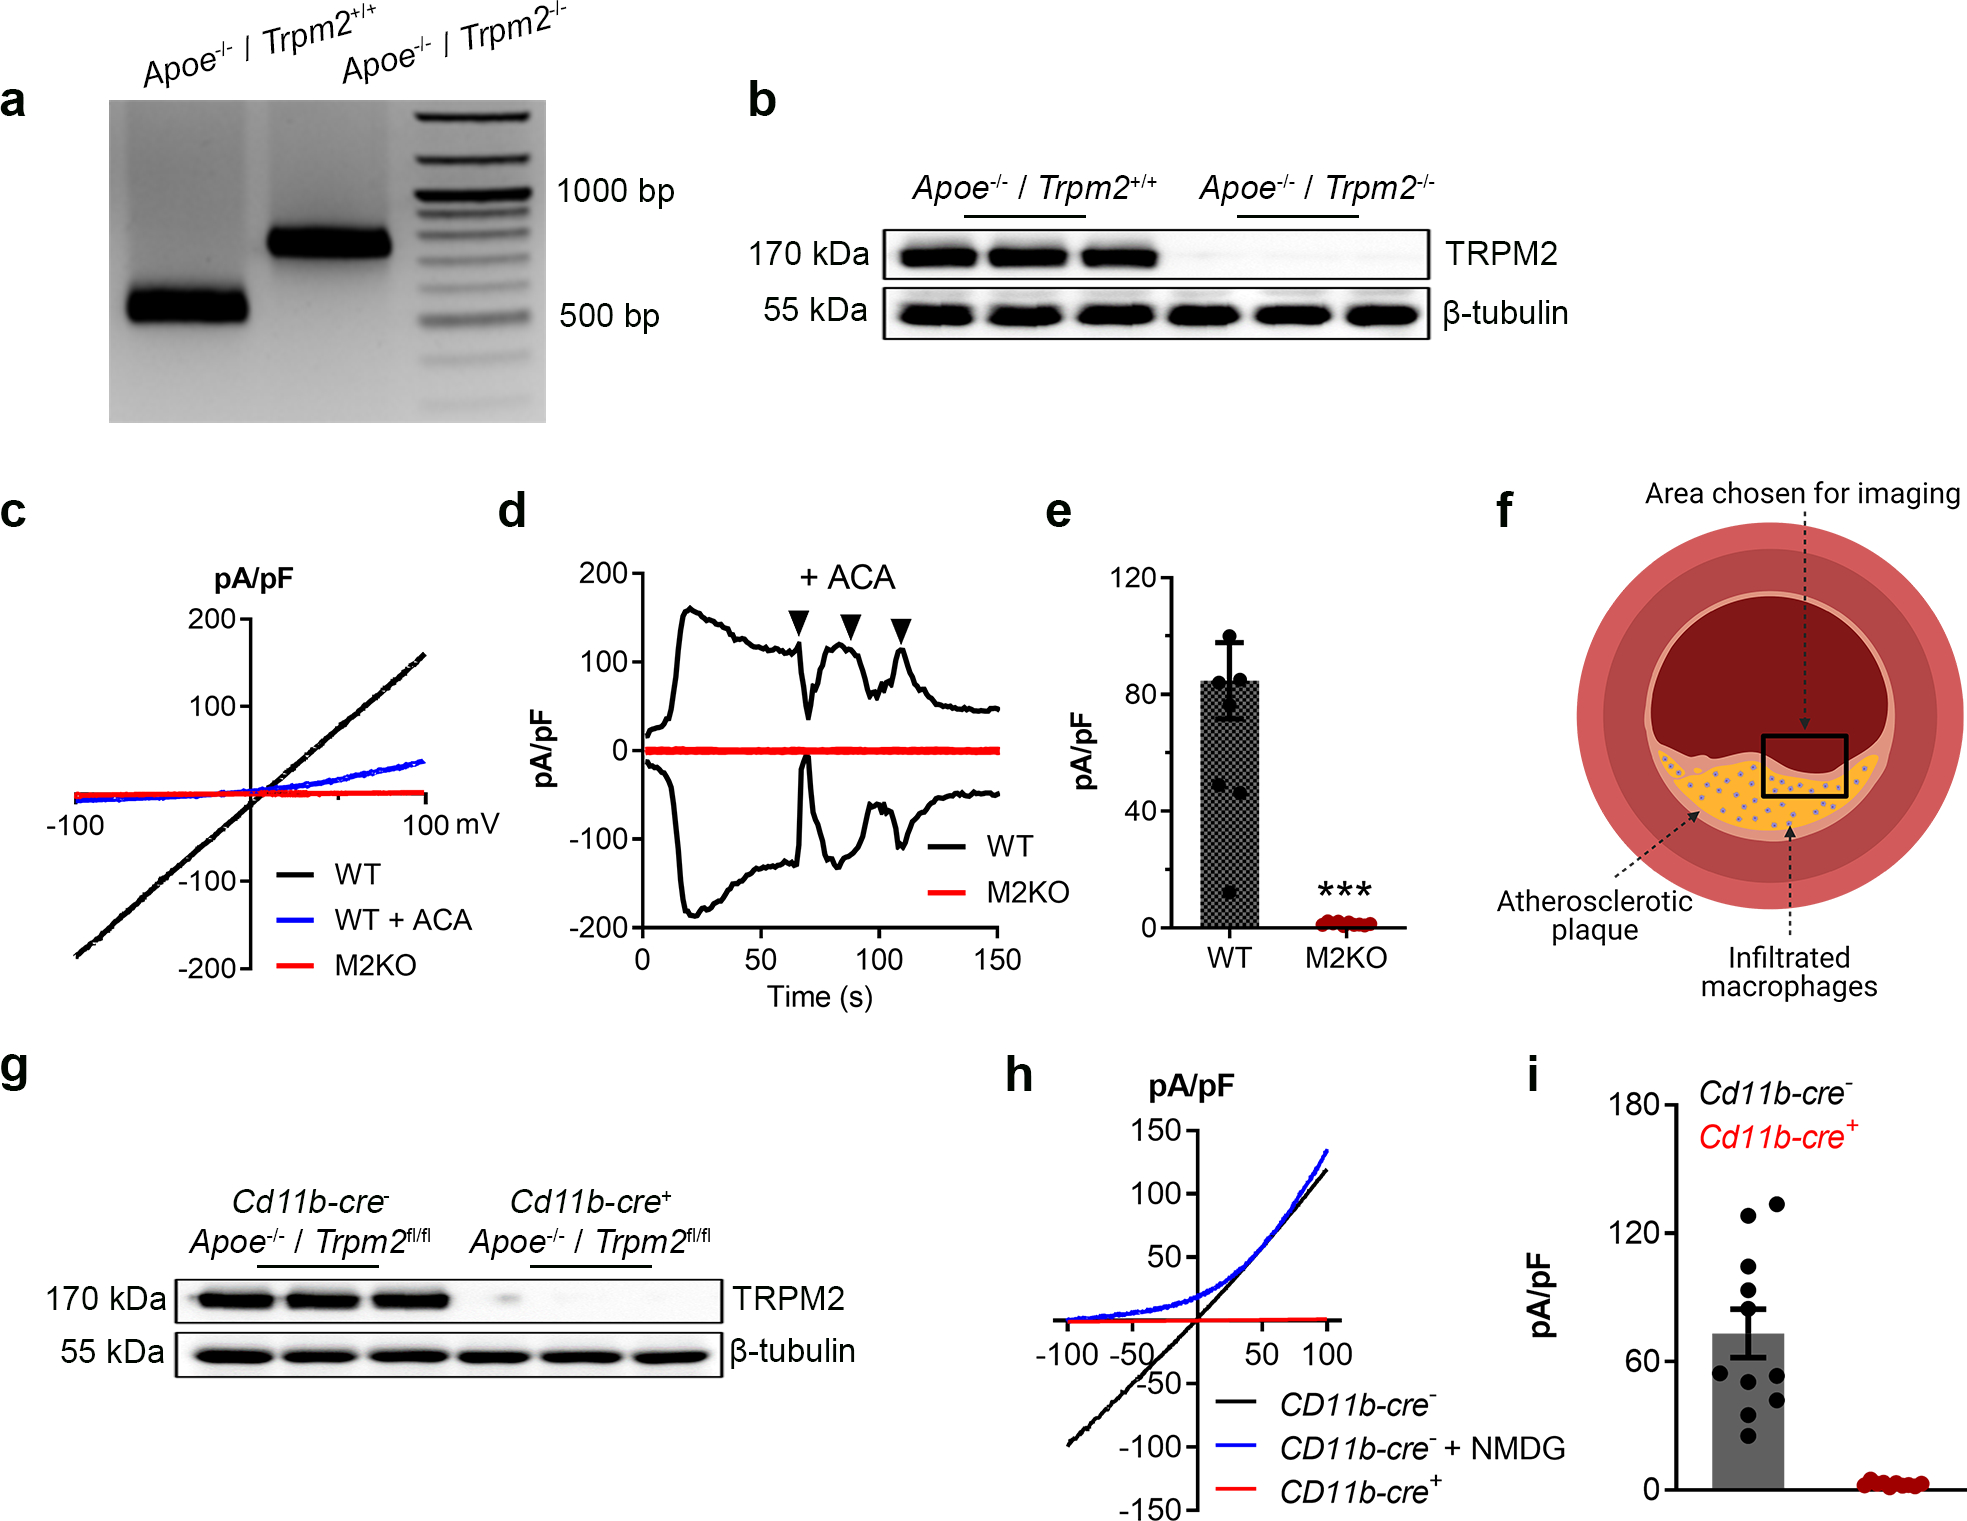
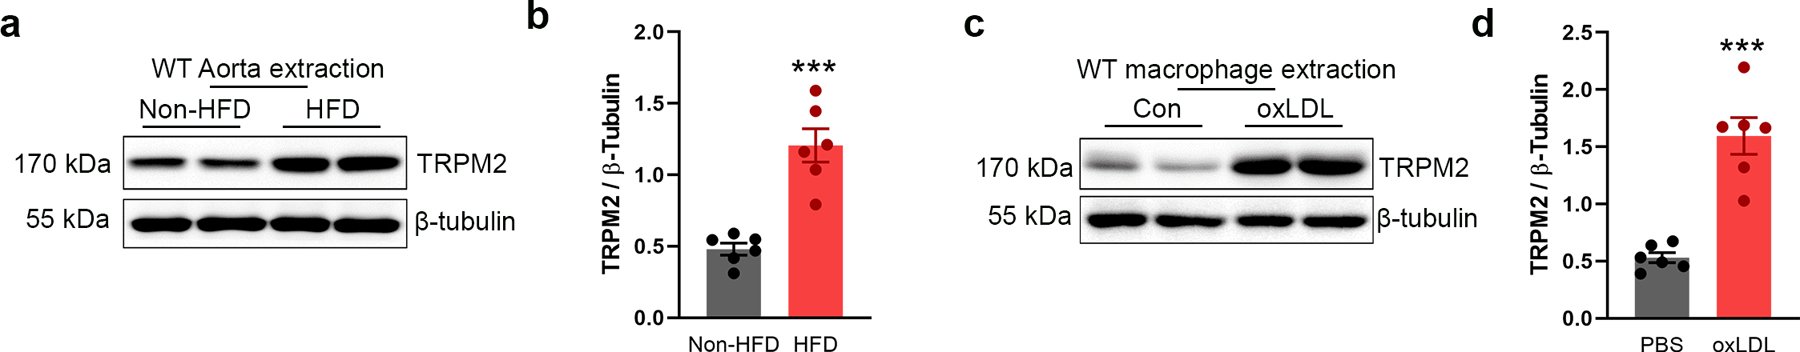
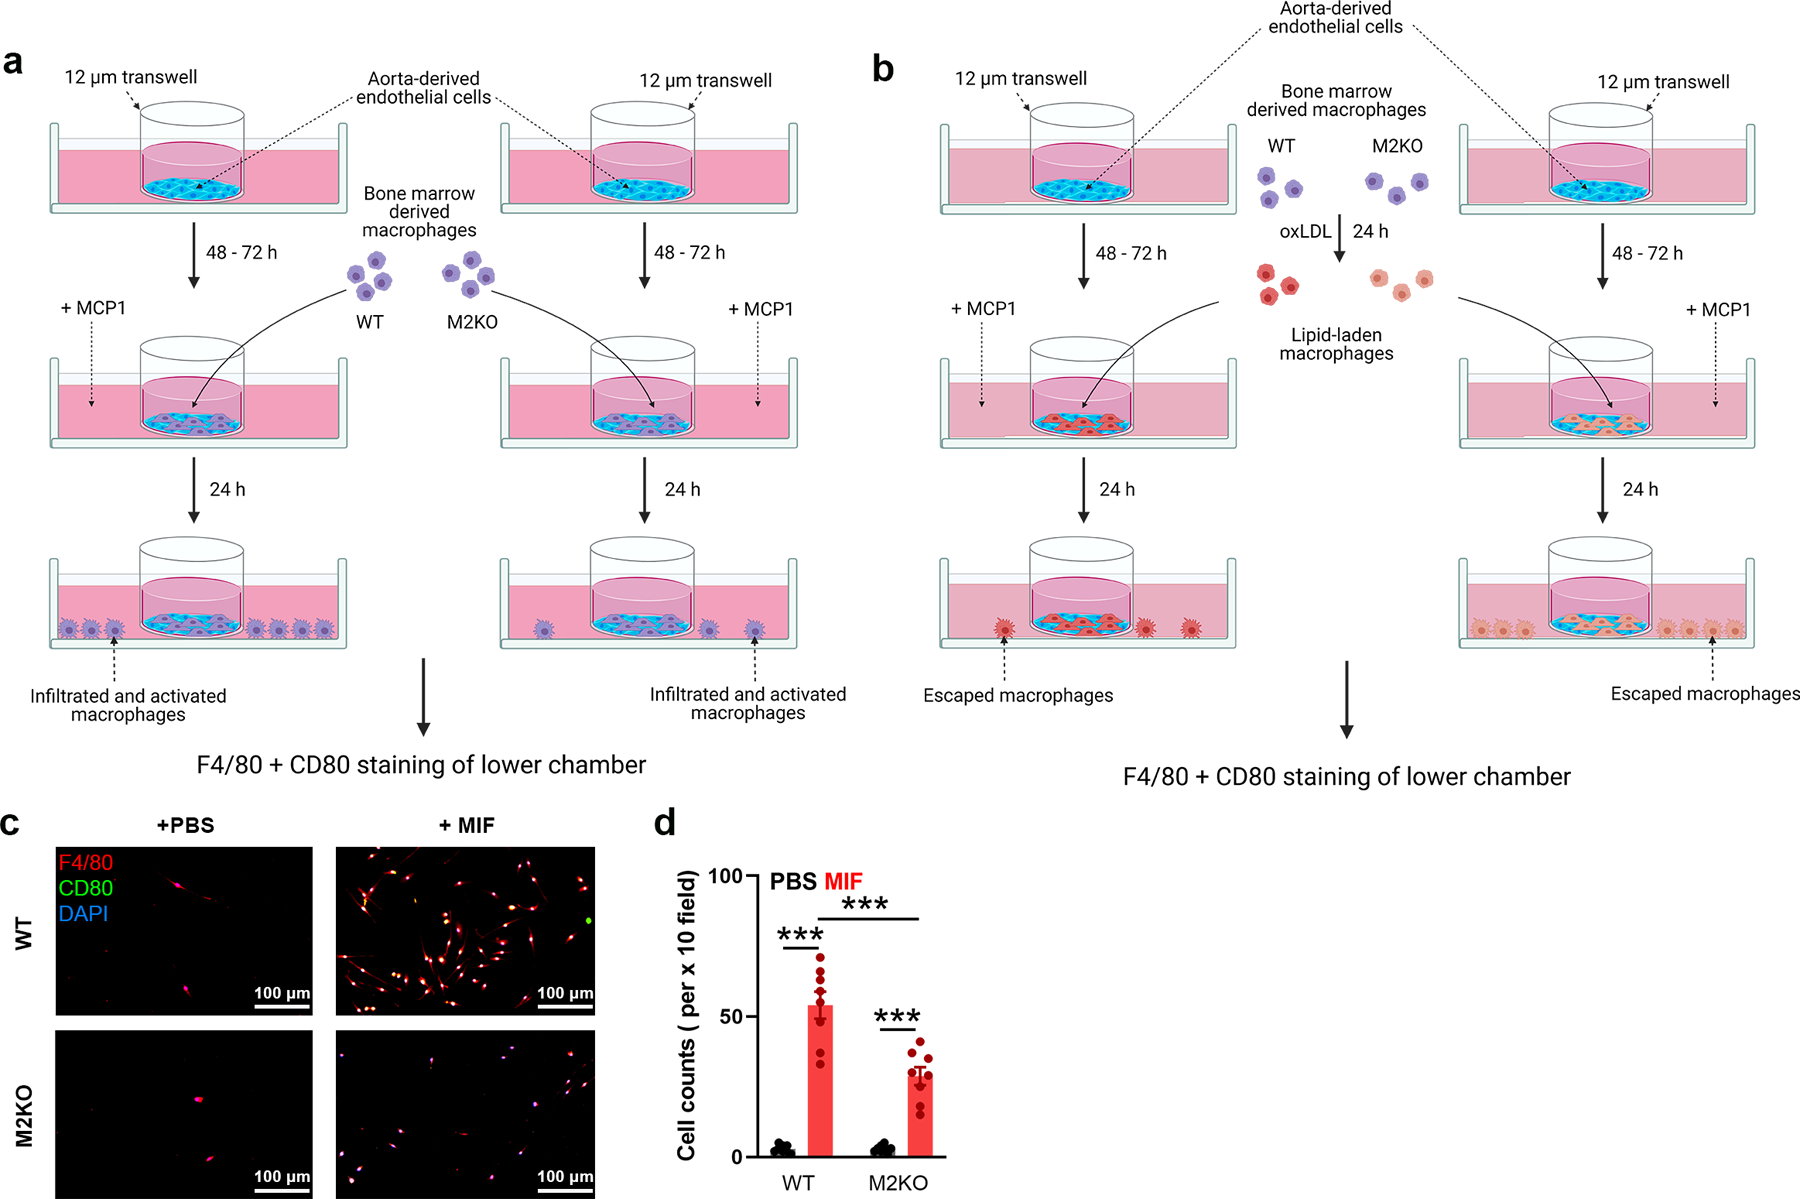
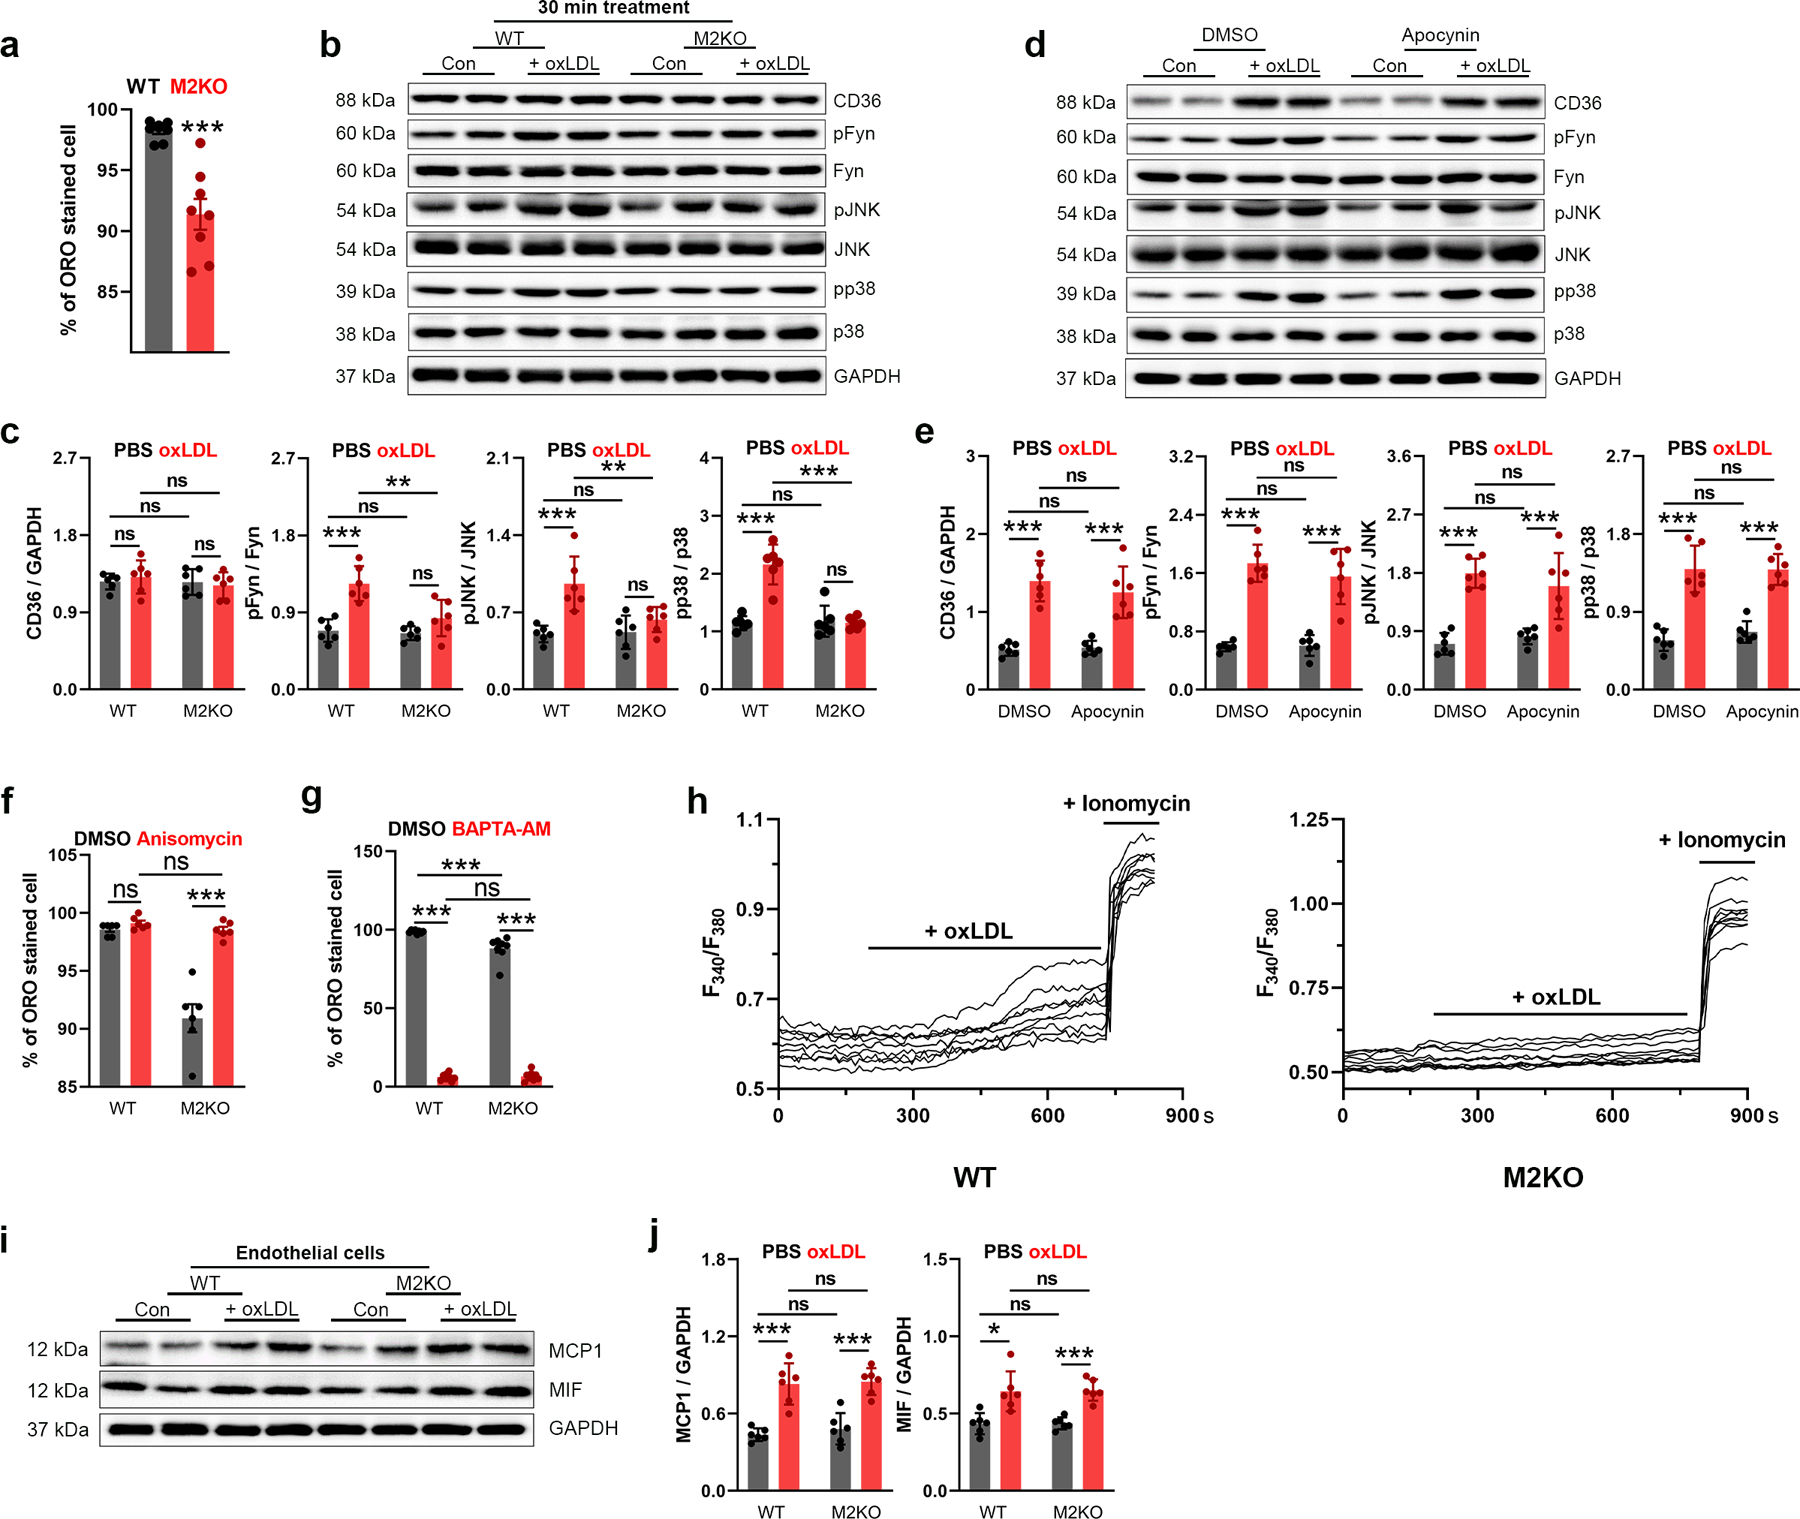
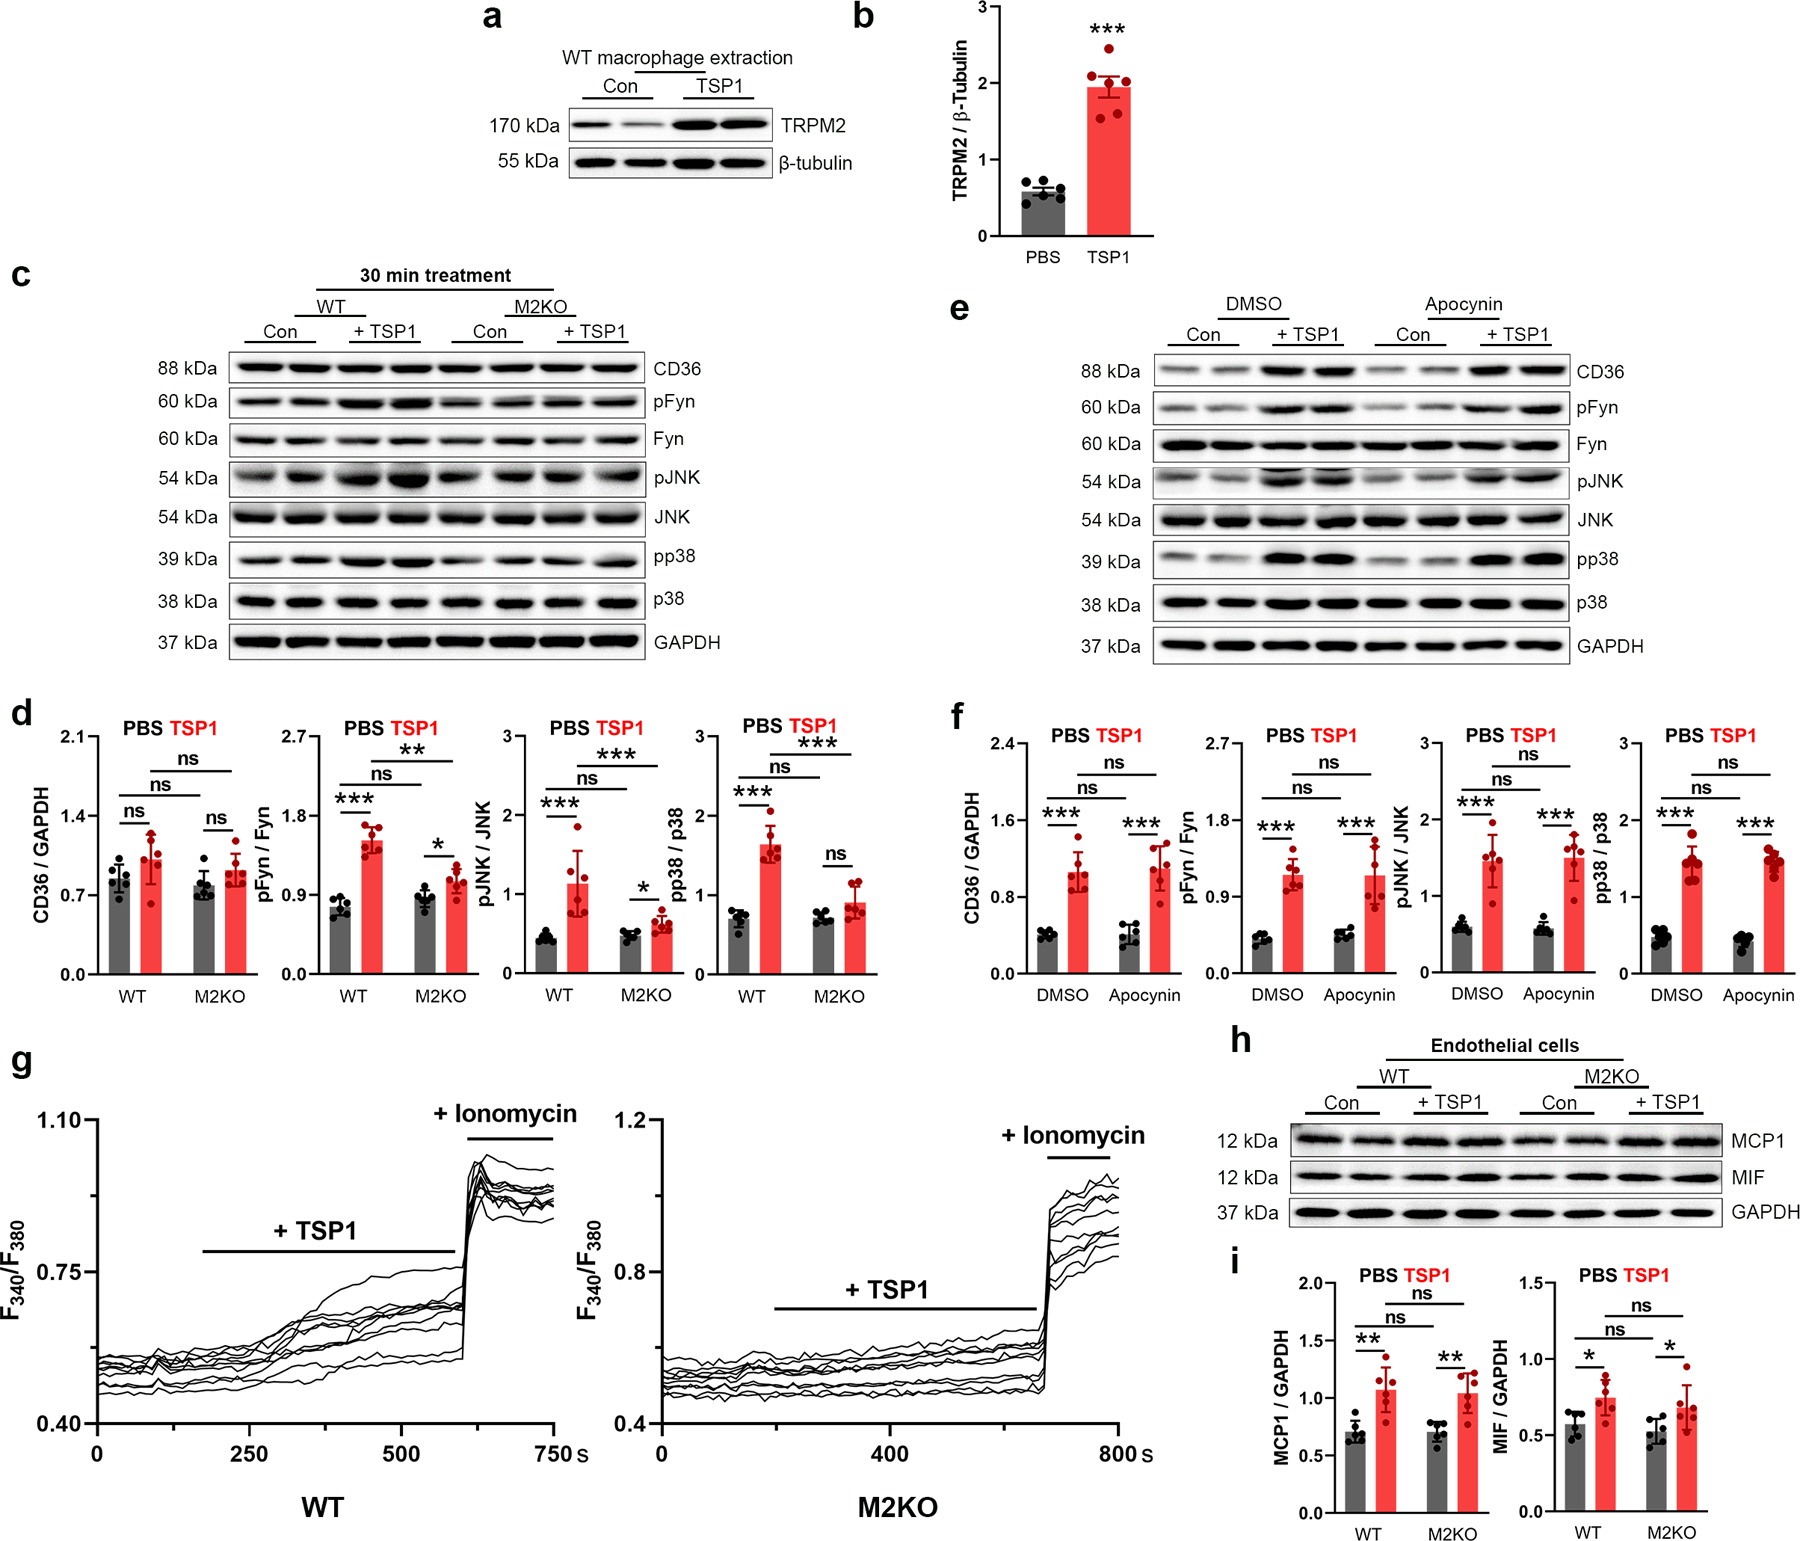
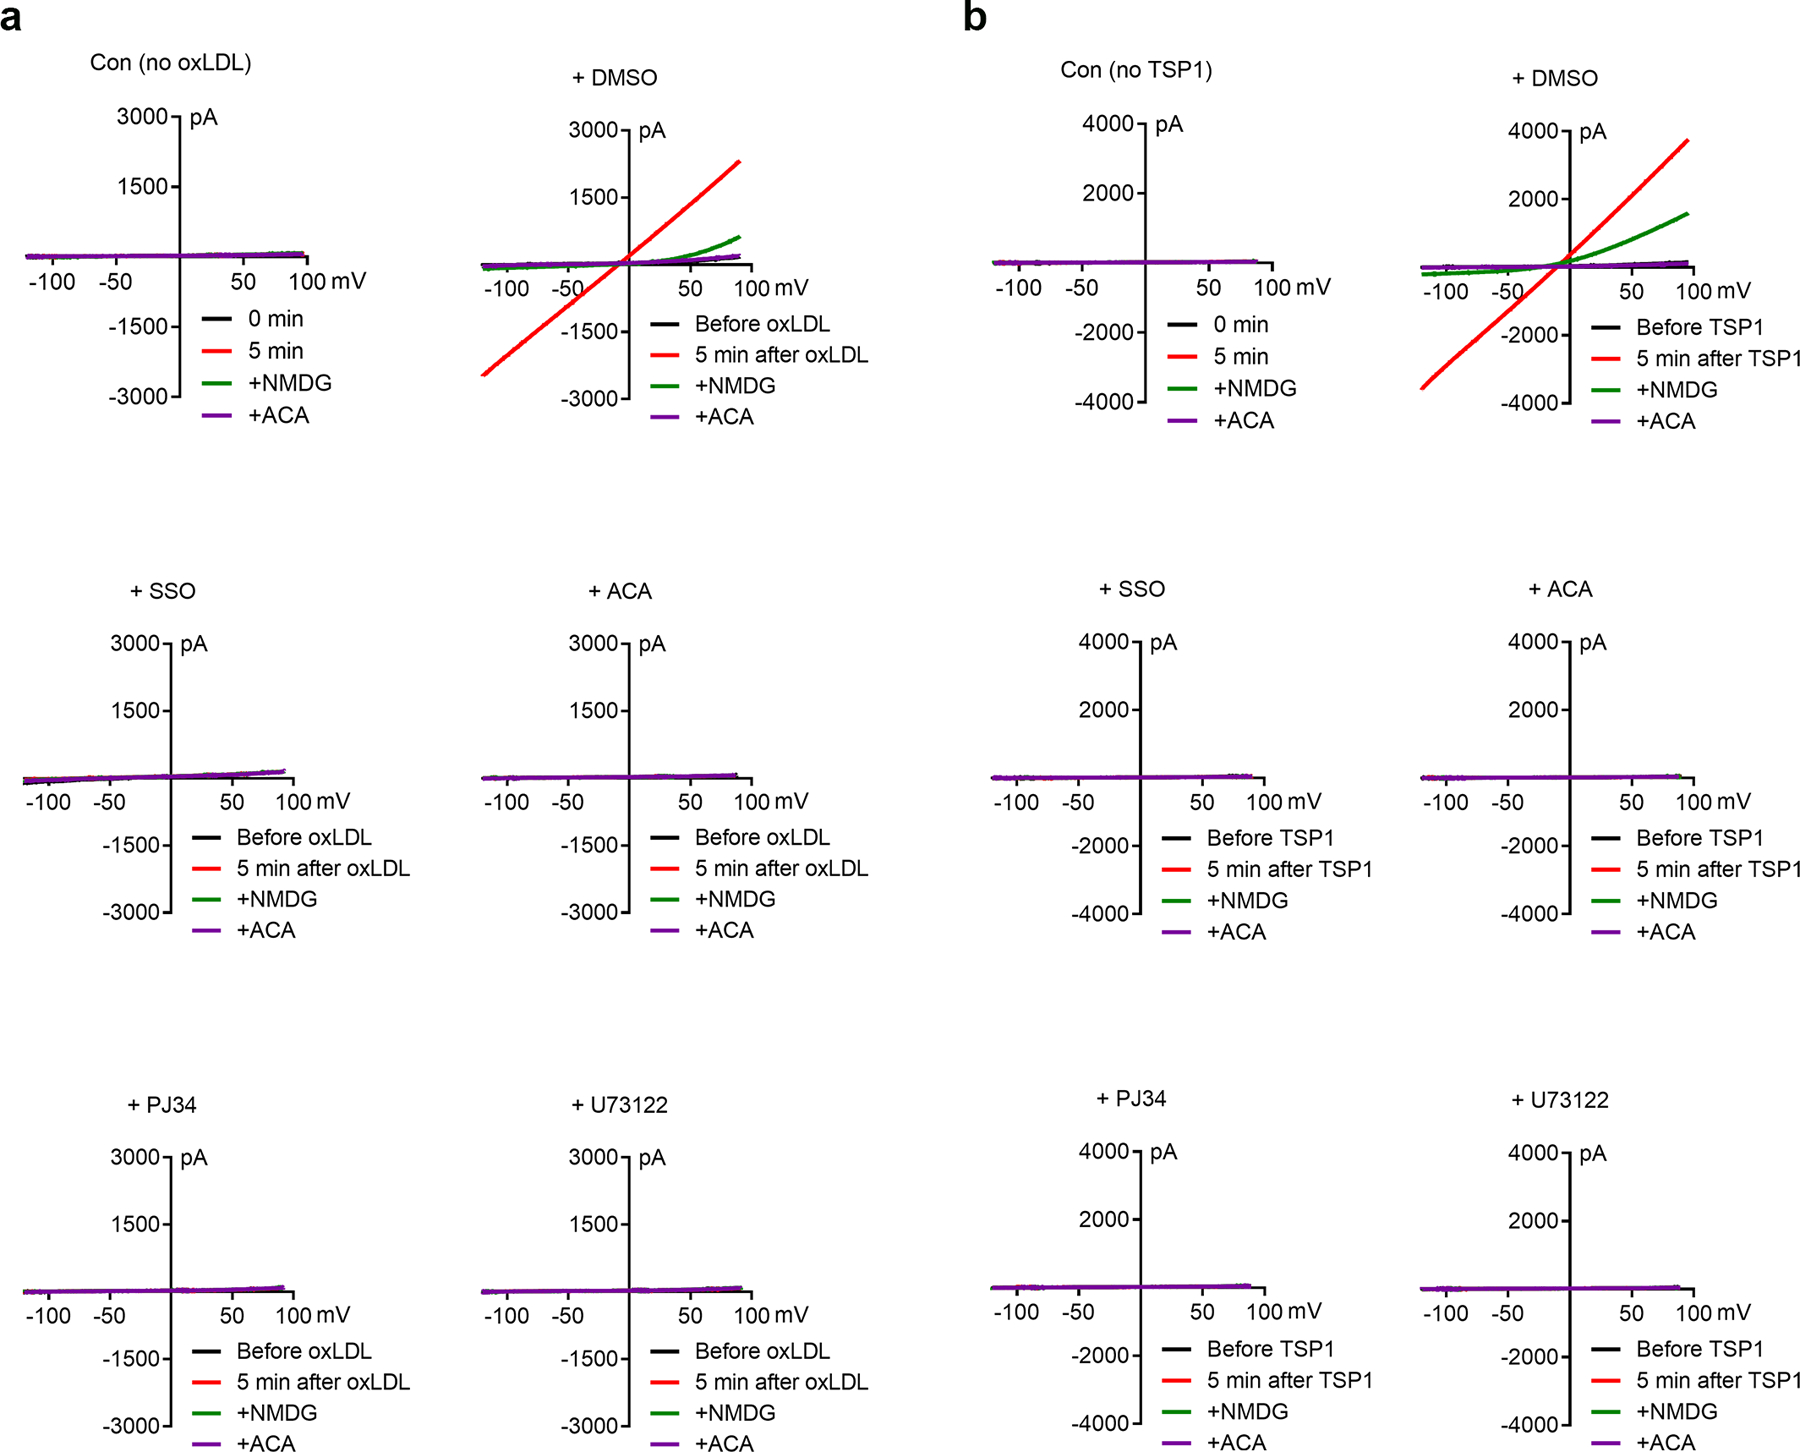
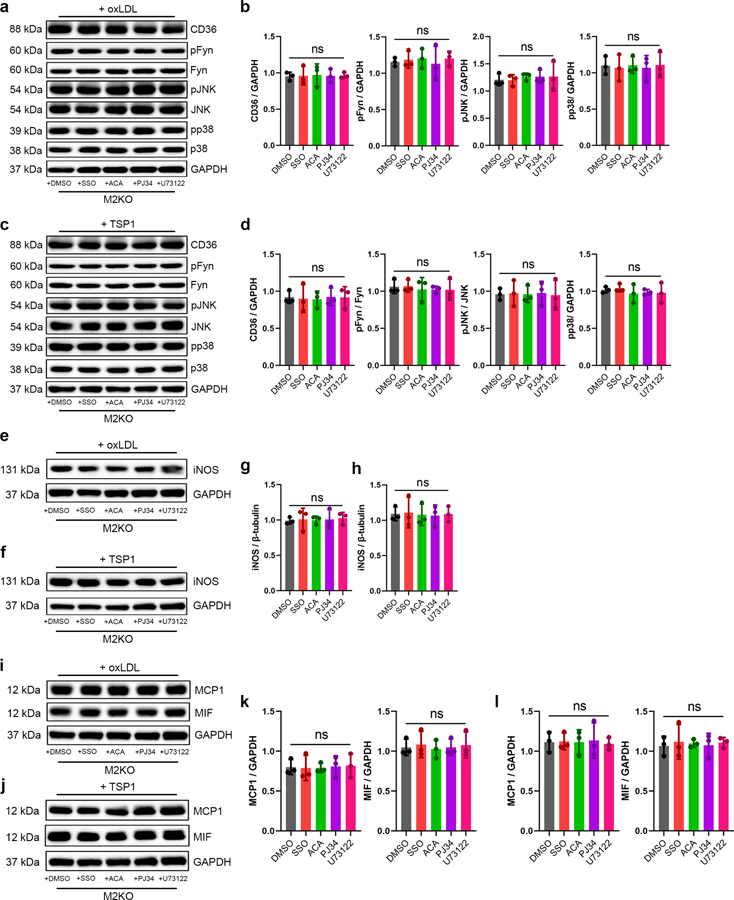
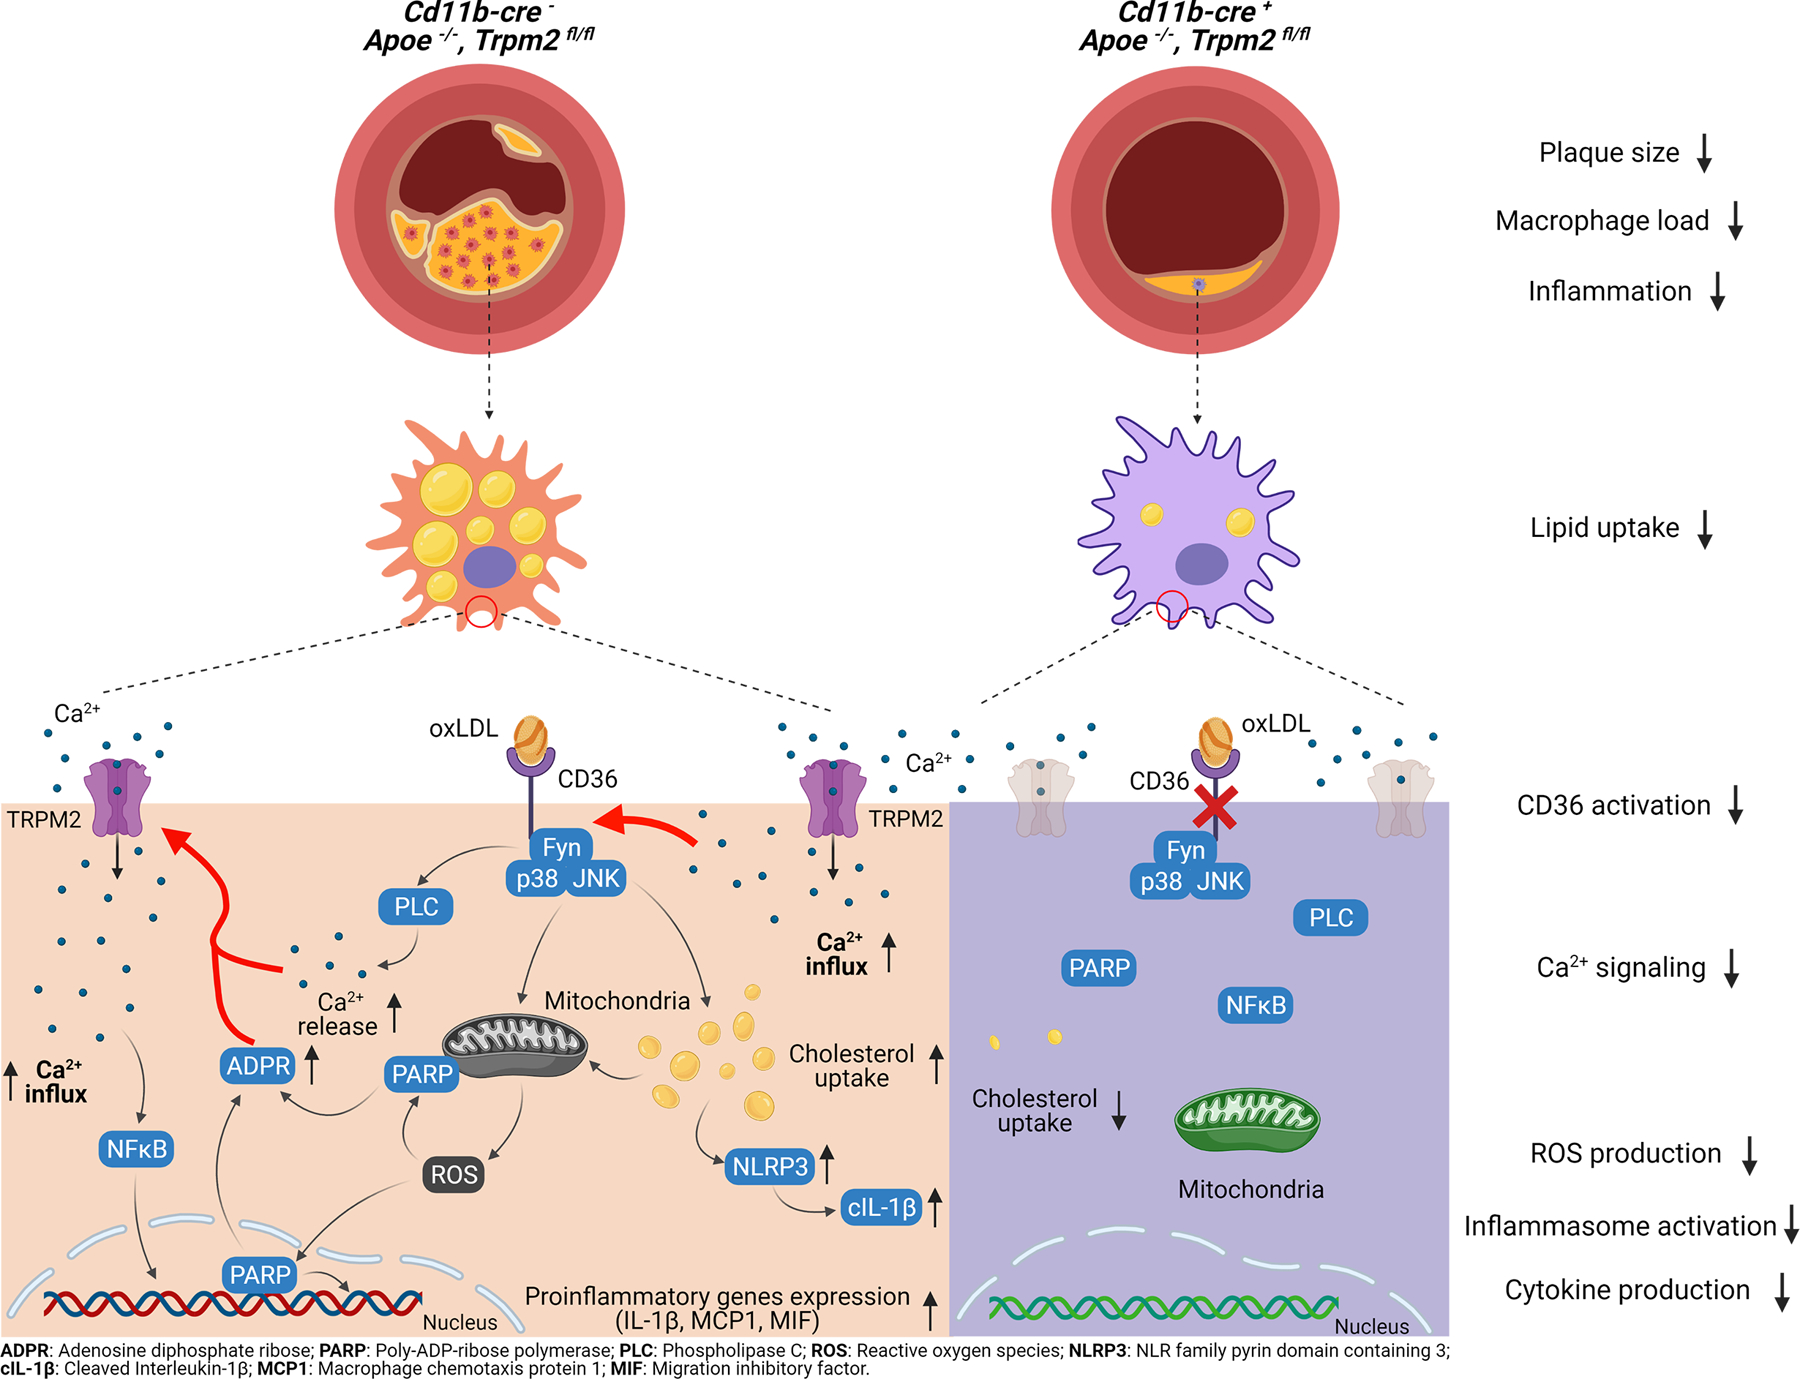
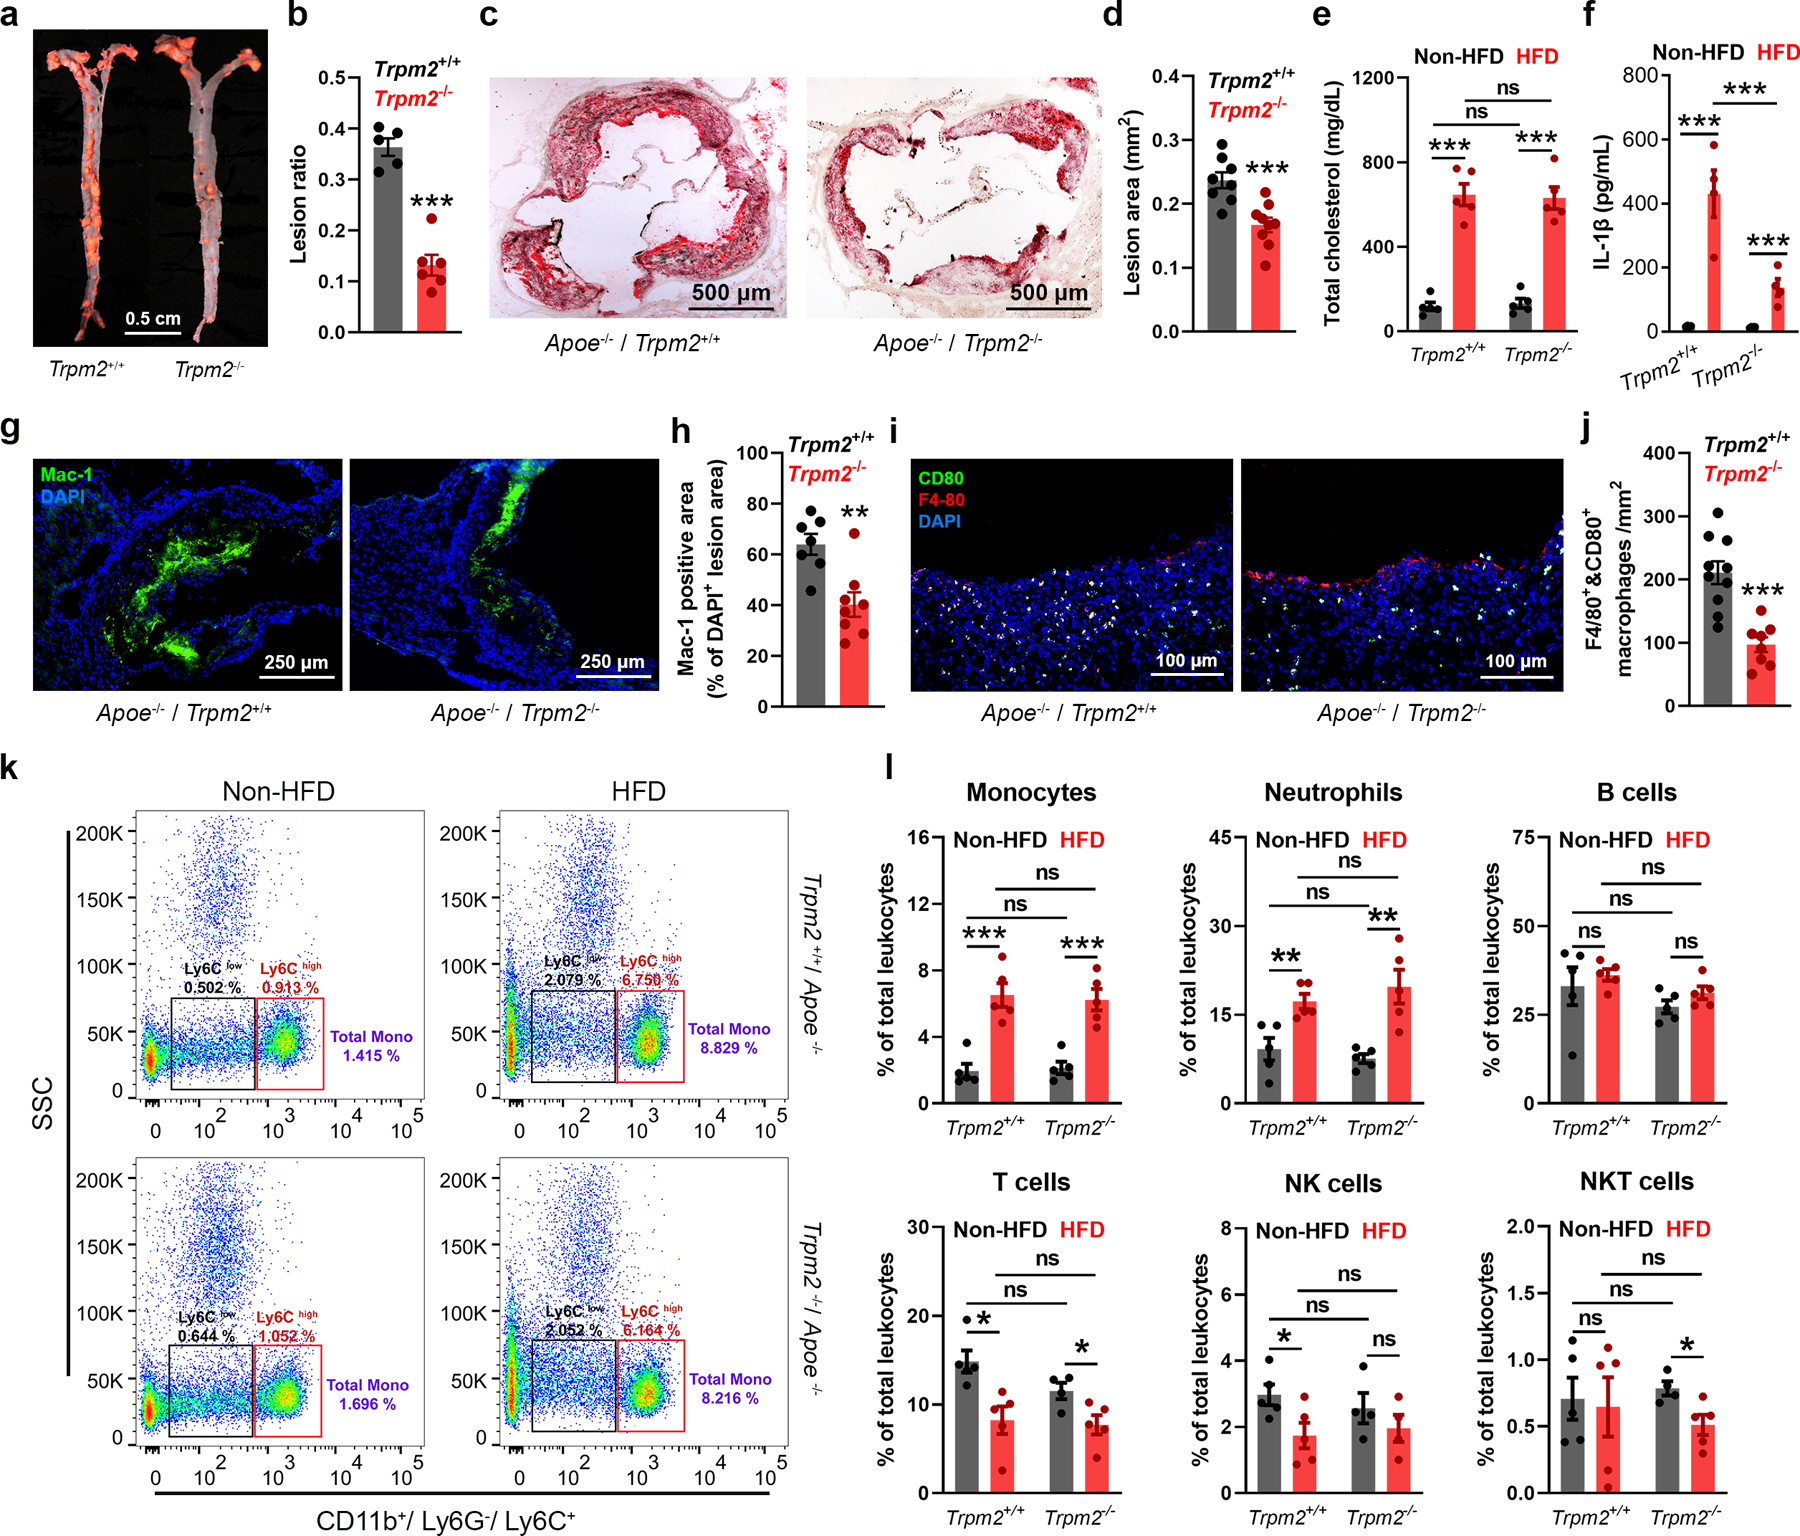
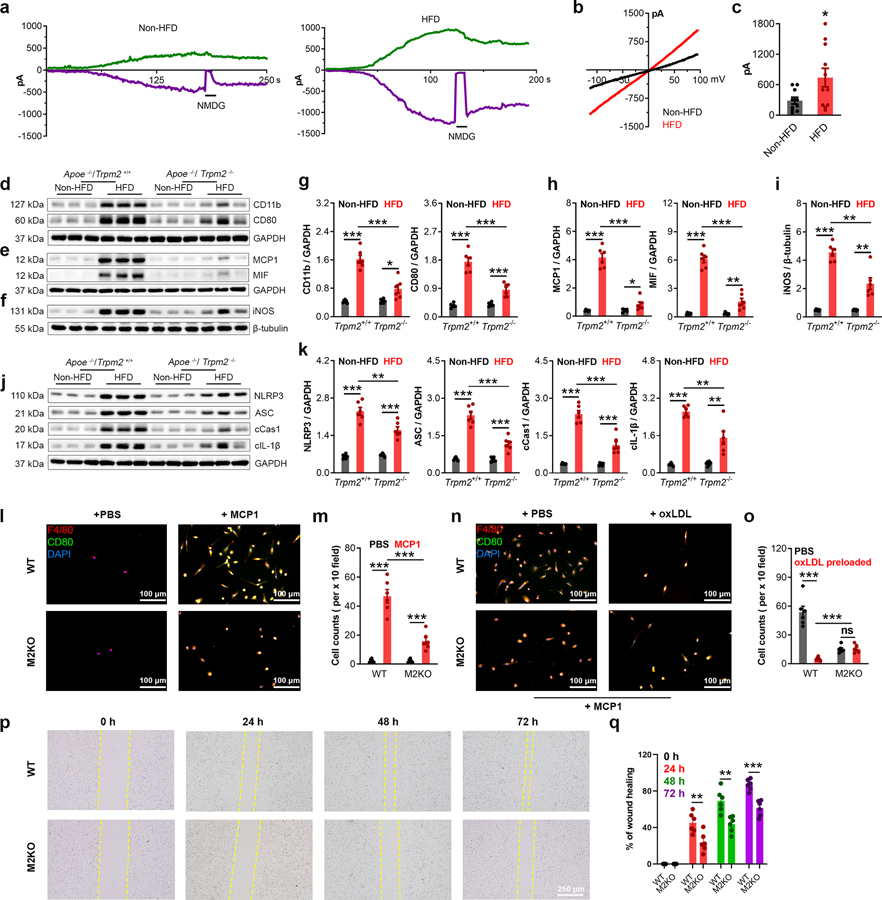
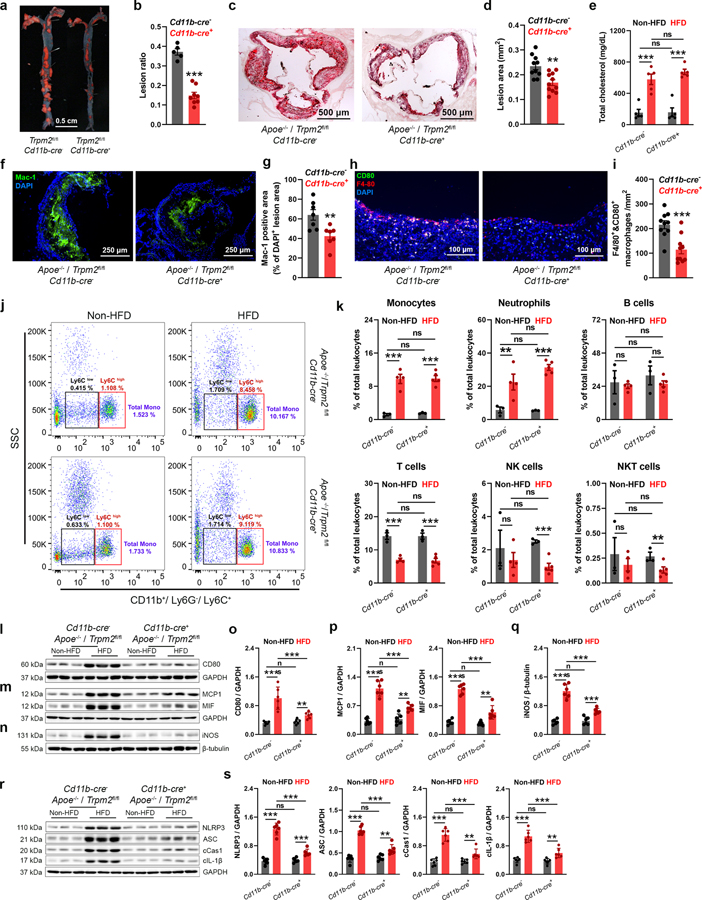
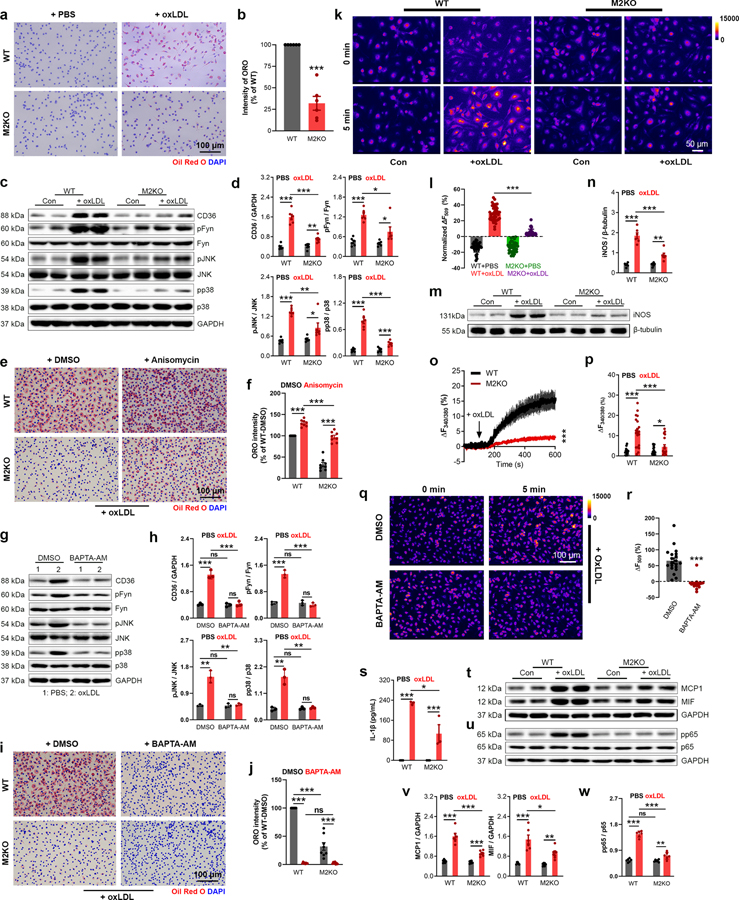
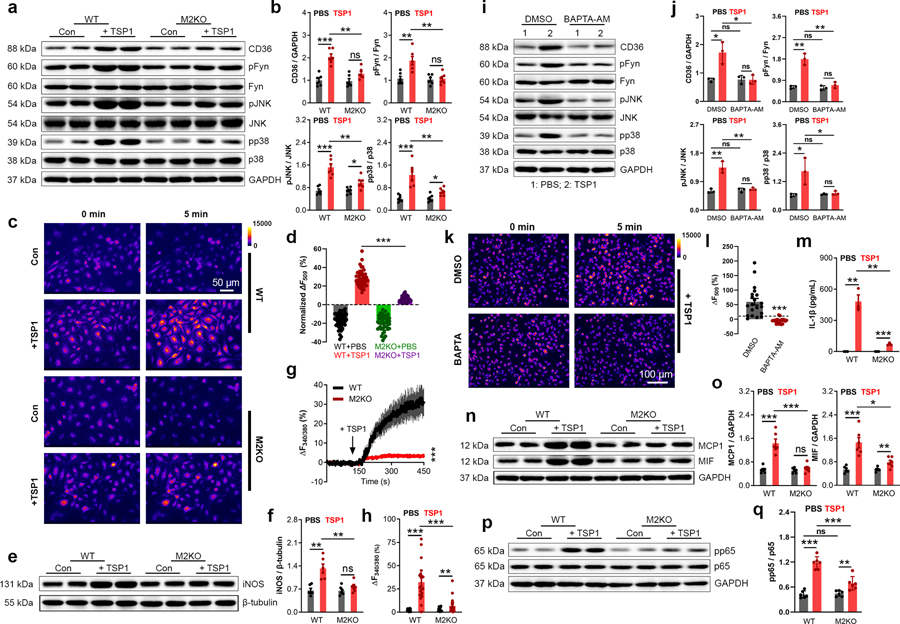
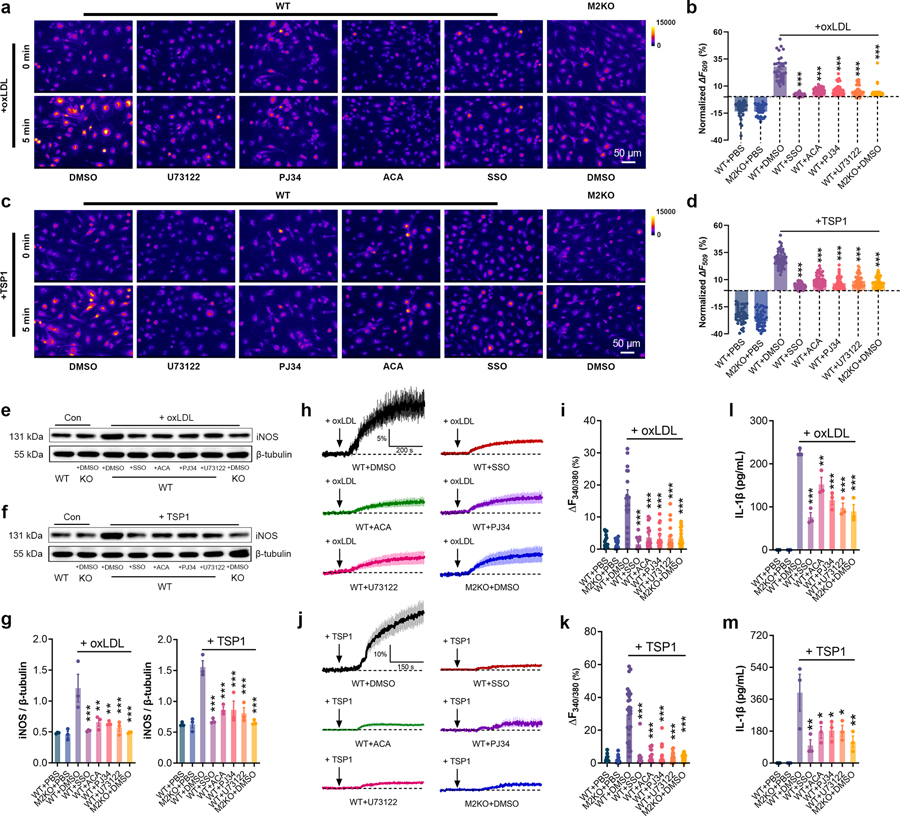
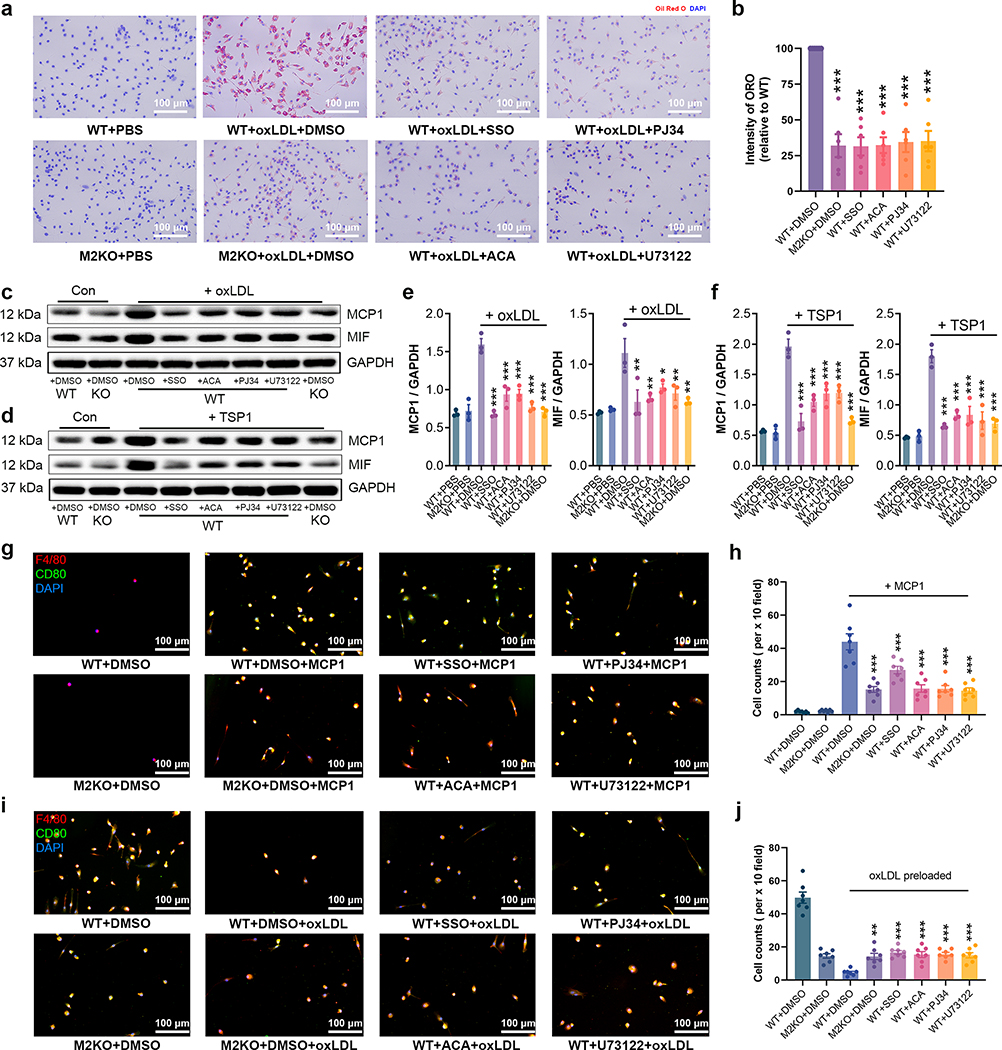
Atherosclerosis is the major cause of ischemic heart disease and stroke, the leading causes of mortality worldwide. The central pathological features of atherosclerosis include macrophage infiltration and foam cell formation. However, the detailed mechanisms regulating these two processes remain unclear. Here we show that oxidative stress-activated Ca2+-permeable transient receptor potential melastatin 2 (TRPM2) plays a critical role in atherogenesis. Both global and macrophage-specific Trpm2 deletion protect Apoe -/- mice against atherosclerosis. Trpm2 deficiency reduces oxidized low-density lipoprotein (oxLDL) uptake by macrophages, thereby minimizing macrophage infiltration, foam cell formation and inflammatory responses. Activation of the oxLDL receptor CD36 induces TRPM2 activity, and vice versa. In cultured macrophages, TRPM2 is activated by CD36 ligands oxLDL and thrombospondin-1 (TSP1), and deleting Trpm2 or inhibiting TRPM2 activity suppresses the activation of CD36 signaling cascade induced by oxLDL and TSP1. Our findings establish the TRPM2-CD36 axis as a molecular mechanism underlying atherogenesis, and suggest TRPM2 as a potential therapeutic target for atherosclerosis.

Keywords: Atherosclerosis; CD36; Ca2+ signaling; TRPM2; TSP1; macrophages; oxLDL.


Conflict of interest statement

Competing Interests All authors declare no competing interests.

Figures

Extended Data Fig. 1
Extended Data Fig. 1. Knockout of Trpm2 in Apoe−/− mice
(a) Representative PCR genotyping results showing a 514bp and 740 bp products for WT and M2KO mice. (b) Representative WB analysis of TRPM2 expression in macrophages isolated from Apoe single knockout (WT (n=3)) and Apoe / Trpm2 double knockout (M2KO (n=3)) mice (c-e) Representative recording (c, I-V curve; d, time-current trace) and quantification of TRPM2 current in macrophages isolated from Apoe single knockout (WT) and Apoe / Trpm2 double knockout (M2KO) mice. ACA is a TRPM2 blocker. (***: p < 0.001; unpaired t test; mean ± SEM) (f) Graphic illustration showing the atherosclerotic area chosen for taking images of F4/80&CD80 staining in Fig 1i and Fig 3h. (g) Representative WB analysis of TRPM2 expression in macrophages isolated from Trpm2fl/flCd11b-cre (n=3) and Trpm2fl/flCd11b-cre+ mice (n=3) with Apoe knockout. (h, i) Representative recording and quantification of TRPM2 current in macrophages isolated from Trpm2fl/flCd11b-cre and Trpm2fl/flCd11b-cre+ mice with Apoe knockout.
Extended Data Fig. 2
Extended Data Fig. 2. Expression of TRPM2 is increased during atherogenesis
(a, b) Representative WB analysis of TRPM2 expression in aorta from wild-type mice (WT) with or without the treatment of high-fat diet (HFD) for 4 months (n=6/group). (c, d) Representative WB analysis of TRPM2 expression in macrophages isolated from WT mice with or without the treatment of oxLDL (50 μg/ml) for 24 h (n=6/group). (***: p < 0.001; unpaired t test, two-tailed; mean ± SEM)
Extended Data Fig. 3
Extended Data Fig. 3. In vitro macrophage migration and emigration assay
(a) Graphic illustration of in vitro examination of macrophage infiltration across endothelial cells induced by MCP1. Aorta-derived endothelial cells were plated on the transwell inserts (pore size: 12 μm) for 3–5 days. Bone marrow derived macrophages were added into the upper chamber after endothelial cells completely covered the upper surface of transwells. After 4 h, F4/80 and CD80 staining of macrophages in the lower chamber was performed as in Fig 2l. (b) Graphic illustration of in vitro examination of macrophage emigration across endothelial cells induced by MCP1. Aorta-derived endothelial cells were plated on the transwell inserts (pore size: 12 μm) for 3–5 days. Bone marrow derived macrophages preloaded with oxLDL for 24 h were added into the upper chamber after endothelial cells completely covered the upper surface of transwells. After 24 h, F4/80 and CD80 staining of macrophages in lower chamber was performed as in Fig 2n. (c, d) In vitro macrophage migration assay induced by MIF instead of MCP1 as shown in Extended Data Fig. 3a. l, F4/80 and CD80 staining of macrophages in the lower chamber (Red: F4/80; Blue: DAPI; Green: CD80). c, Quantification of the number of infiltrated macrophages within a x 10 field. 6 dishes from each group were chosen for quantification. (***: p < 0.001; ANOVA, two-tailed, Bonferroni’s test; mean ± SEM).
Extended Data Fig. 4
Extended Data Fig. 4. TRPM2 is required for CD36 activation in macrophages induced by oxLDL
(a) Quantification of Fig 4a by counting percentage of Oil red O staining macrophages (n=8/group). (b, c) 30-min oxLDL treatment (50 μg/ml) induce the activation of CD36 signaling without upregulating CD36 expression. Representative WB analysis of CD36, pFyn, pJNK and pp38 expression in macrophages after oxLDL treatment for 30 min (n=6/group). (d, e) NADPH oxidase inhibitor apocynin does not inhibit CD36 activation induced by 24-h oxLDL treatment (50 μg/ml) in macrophages isolated from wild-type (WT) mice. Representative WB analysis of CD36, pFyn, pJNK and pp38 expression in macrophages after oxLDL treatment for 24 h (n=6/group). (f) Quantification of Fig 4k by counting percentage of Oil red O staining macrophages (n=6/group). (g) Quantification of Fig 4o by counting percentage of Oil red O staining macrophages (n=8/group). (h) A set of original Fura-2 real time recording traces without normalization during oxLDL treatment as in Fig 4o. (i, j) Trpm2 deletion does not influence the production of MCP1/MIF in endothelial cells isolated from aorta in response to 24-h oxLDL treatment (50 μg/ml). Representative WB analysis of MCP1 and MIF expression in endothelial cells after oxLDL treatment for 24 h (n=6/group). (ns: no statistical significance; *: p < 0.05; **: p < 0.01; ***: p < 0.001; ANOVA, two-tailed, Bonferroni’s test; mean ± SEM).
Extended Data Fig. 5
Extended Data Fig. 5. TRPM2 is required for CD36 activation in macrophages induced by TSP1
(a, b) Representative WB analysis of TRPM2 expression in macrophages isolated from WT mice with or without the treatment of TSP1 (10 μg/ml) for 24 h (n=6/group). (c, d) 30-min TSP1 (10 μg/ml) treatment induce the activation of CD36 signaling without upregulating CD36 expression. Representative WB analysis of CD36, pFyn, pJNK and pp38 expression in macrophages after TSP1 treatment for 30 min (n=6/group). (e, f) NADPH oxidase inhibitor apocynin does not inhibit CD36 activation induced by 24-h TSP1 (10 μg/ml) treatment in macrophages isolated from wild-type (WT) mice. Representative WB analysis of CD36, pFyn, pJNK and pp38 expression in macrophages after TSP1 treatment for 24 h. (g) A set of original Fura-2 real time recording traces without normalization during TSP1 treatment as in Fig 5g. (h, i) Trpm2 deletion does not influence the production of MCP1/MIF in endothelial cells isolated from aorta in response to 24-h TSP1 (10 μg/ml) treatment. Representative WB analysis of MCP1 and MIF expression in endothelial cells after TSP1 treatment for 24 h (n=6/group). (ns: no statistical significance; *: p < 0.05; **: p < 0.01; ***: p < 0.001; ANOVA, two-tailed, Bonferroni’s test; mean ± SEM).
Extended Data Fig. 6
Extended Data Fig. 6. Different inhibitors suppressed the activation of TRPM2 by oxLDL or TSP1 treatment
(a, b) Representative recording of TRPM2 current in HEK293T cells transfected with CD36 and TRPM2 during oxLDL treatment (50 μg/ml) as in a, and during TSP1 treatment (10 μg/ml) as in b. Transfected cells were treated with different inhibitors as indicated before current recording.
Extended Data Fig. 7
Extended Data Fig. 7. Inhibition of CD36 or TRPM2 did not produce additional inhibitory effect on M2KO macrophages
(a) Representative WB analysis of the expression of CD36, pFyn, Fyn, pJNK, JNK, pp38 and p38 in isolated macrophages from M2KO mice after oxLDL treatment (50 μg/ml). Macrophages were treated with different inhibitors as indicated before protein extraction. (b) Quantification of WB bands (n=3/group). (c) Representative WB analysis of the expression of CD36, pFyn, Fyn, pJNK, JNK, pp38 and p38 in isolated macrophages from M2KO mice after TSP1 treatment (10 μg/ml). Macrophages were treated with different inhibitors as indicated before protein extraction. (d) Quantification of WB bands (n=3/group). (e) Representative WB analysis of the expression of iNOS in isolated macrophages from M2KO mice after oxLDL treatment (50 μg/ml). Macrophages were treated with different inhibitors as indicated before protein extraction. (f) Quantification of WB bands (n=3/group). (e) Representative WB analysis of the expression of iNOS in isolated macrophages from M2KO mice after TSP1 treatment (10 μg/ml). Macrophages were treated with different inhibitors as indicated before protein extraction. (f) Quantification of WB bands (n=3/group). (i) Representative WB analysis of the expression of MCP1 and MIF in isolated macrophages from M2KO mice after oxLDL treatment (50 μg/ml). Macrophages were treated with different inhibitors as indicated before protein extraction. (j) Quantification of WB bands (n=3/group). (k) Representative WB analysis of the expression of MCP1 and MIF in isolated macrophages from M2KO mice after TSP1 treatment (10 μg/ml). Macrophages were treated with different inhibitors as indicated before protein extraction. (l) Quantification of WB bands (n=3/group). (ns: no statistical significance; ANOVA, two-tailed, Bonferroni’s test; mean ± SEM).
Extended Data Fig. 8
Extended Data Fig. 8. Graphic illustration, the activation of CD36 and TRPM2 form a positive feedback loop in atherogenesis
In summary, we found that: (1) Global Trpm2 deletion and macrophage-specific Trpm2 deletion protect against atherosclerosis in Apoe−/− mice fed with a high-fat diet (HFD). (2) Trpm2 deficiency in macrophages inhibits atherogenesis by inhibiting macrophage infiltration and minimizing foam cell formation. (3) TRPM2 activation is required for CD36-induced oxLDL uptake and subsequent inflammatory responses in macrophages. (4) The ligands of CD36, oxLDL and TSP1, activate TRPM2, thereby perpetuating TRPM2-CD36 inflammatory cycle in atherogenesis cascade. (5) Our data establish TRPM2-CD36 axis in macrophages as an important atherogenesis mechanism and TRPM2 as a promising therapeutic target for atherosclerosis
Fig. 1:
Fig. 1:. Global Trpm2 deletion protects mice against atherosclerosis.
(a,b) Global Trpm2 deletion (Trpm2−/−) inhibited atherosclerotic plaque formation. a, Representative images of Oil Red O (ORO) staining of full-length aorta (red areas represents plaque). b, Mean atherosclerotic lesion ratio based on ORO staining from Trpm2+/+ (n=5) and Trpm2−/− mice (n=6), P < 0.0001. (c, d) Representative images and quantification of ORO staining of the aortic root sections from Trpm2+/+ (n=8) and Trpm2−/− mice (n=9), P = 0.0009. (e) Trpm2−/− did not influence the total cholesterol level in serum (n=5/group) (HFD: high-fat diet). (f) Trpm2−/− inhibited systemic inflammation evaluated by measuring IL-1β level in serum (n=4/group). (g-j) Trpm2−/− reduced macrophage burden in atherosclerotic plaque. g, h Representative merged images and quantification of Mac-1 staining of aortic root sections from Trpm2+/+ (n=7) and Trpm2−/− mice (n=8), P = 0.0027. (i, j) Representative merged images and quantification of F4/80 and CD80 staining of aorta cross-sections using the plaque areas as shown in Extended Data Fig. 1f (Red: F4/80; Blue: DAPI; Green: CD80) from Trpm2+/+ (n=9) and Trpm2−/− mice (n=8), P = 0.0001. (k, l) Trpm2−/− did not influence the leukocyte population in the peripheral blood. k, Representative monocyte population identified using flow cytometry. Ly6C+ monocyte population was identified from CD11b+ and Ly6G leukocytes. l, Quantification of monocyte, neutrophil, B cell, T cell, NK cell and NKT cell population in the peripheral blood from Trpm2+/+ (n=5) and Trpm2−/− mice (n=5) with or without HFD treatment. (ns: no statistical significance; *: p < 0.05; **: p < 0.01; ***: p < 0.001; ANOVA, two-tailed, Bonferroni’s test; mean ± SEM).
Fig. 2:
Fig. 2:. Trpm2 deletion attenuates inflammation in the aortas.
(a-c) a, Time-dependent activation of TRPM2 currents (Green: outward current at +100 mV; Purple: inward current at −100 mV) recorded from isolated peritoneal macrophages. N-Methyl-D-glucamine (NMDG) blocks inward current indicating the tightness of seal. b, Representative TRPM2 currents recorded with ramp protocol. c, Quantification of current amplitude (HFD: high-fat diet). (d, g) Representative western blot (WB) analysis and quantification of the expression of CD11b and CD80 in aorta (n=6/group). (e, h) Representative WB analysis and quantification of the expression of MCP1 and MIF in aorta (n=6/group). (f, i) Representative WB analysis and quantification of iNOS expression in aortas (n=6/group). (j, k) Representative WB analysis and quantification of the expression of NLRP3, ASC, cleaved caspase-1 (cCas1), and cleaved IL-1β (cIL-1β) expression in aortas (n=6/group). (l, m) In vitro macrophage migration assay using the methods shown in Extended Data Fig. 3a. l, F4/80 and CD80 co-staining of macrophages in the lower chamber (Red: F4/80; Blue: DAPI; Green: CD80). c, Quantification of the number of infiltrated macrophages within a x 10 field. Six dishes from each group were chosen for quantification. (n, o) In vitro macrophage emigration assay using the methods shown in Extended Data Fig. 3b. Note that macrophages were pre-treated with oxLDL prior this assay. n, F4/80 and CD80 co-staining of macrophages in the lower chamber (Red: F4/80; Blue: DAPI; Green: CD80). o, Quantification of the number of emigrated macrophages within a x 10 field. Six dishes from each group were chosen for quantification. (p, q) Scratch assay of cultured macrophages. p, images of macrophages under bright field taken right after (0 h), 24 h, 48 h and 72 h after the scratch. q, Quantification of the percentage of wound healing. Six dishes from each group were chosen for quantification. (ns: no statistical significance; **: p < 0.01; ***: p < 0.001; ANOVA, two-tailed, Bonferroni’s test; mean ± SEM).
Fig. 3:
Fig. 3:. Trpm2 deletion in macrophages protects mice against atherosclerosis.
(a,b) Trpm2 deletion in Cd11b expressing cells (Trpm2fl/flCd11b-cre+) inhibited atherosclerotic plaque formation. a, Representative images of Oil Red O (ORO) staining of full-length aorta (red areas represents plaque). b, Mean atherosclerotic lesion ratio based on ORO staining from Trpm2fl/flCd11b-cre (n=5) and Trpm2fl/flCd11b-cre+ mice (n=8), P < 0.0009. (c, d) Representative images and quantification of ORO staining of the aortic root sections from Trpm2fl/flCd11b-cre (n=9) and Trpm2fl/flCd11b-cre+ mice (n=10), P = 0.0016. (e) Trpm2fl/flCd11b-cre+ did not influence the total cholesterol level in serum (n=5/group) (HFD: high-fat diet). (f-i) Trpm2fl/flCd11b-cre+ reduced macrophage burden in atherosclerotic plaque. f, g Representative merged images (Blue:DAPI; Green: Mac-1) and quantification of Mac-1 staining of aortic root sections from Trpm2fl/flCd11b-cre (n=8) and Trpm2fl/flCd11b-cre+ mice (n=7), P = 0.0071. (h, i) Representative merged images and quantification of F4/80 and CD80 staining of aorta cross-sections using the plaques areas as shown in Extended Data Fig. 1f (Red: F4/80; Blue: DAPI; Green: CD80) from Trpm2fl/flCd11b-cre (n=9) and Trpm2fl/flCd11b-cre+ mice (n=10), P = 0.0005. (j, k) Trpm2fl/flCd11b-cre+ did not influence the leukocyte population in the peripheral blood. j, Representative monocyte population identified using flow cytometry. Ly6C+ monocyte population was identified from CD11b+ and Ly6G leukocytes. k, Quantification of monocyte, neutrophil, B cell, T cell, NK cell and NKT cell population in the peripheral blood from Trpm2fl/flCd11b-cre (n=3) and Trpm2fl/flCd11b-cre+ mice (n=4) with or without HFD treatment. (l, o) Representative WB analysis and quantification of the CD80 expression in aorta (n= 6 mice/group). (m, p) Representative WB analysis and quantification of the expression of MCP1 and MIF in aorta (n= 6 mice/group). (n, q) Representative WB analysis and quantification of iNOS expression in aortas (n= 6 mice/group). (r, s) Representative WB analysis and quantification of the expression of NLRP3, ASC, cleaved caspase-1 (cCas1), and cleaved IL-1β (cIL-1β) expression in aortas (n= 6 mice/group). (ns: no statistical significance; **: p < 0.01; ***: p < 0.001; ANOVA, two-tailed, Bonferroni’s test; mean ± SEM).
Fig. 4:
Fig. 4:. Deletion of Trpm2 inhibits foam cell formation.
(a, b) Representative images and quantification of ORO staining in macrophages from wild-type (WT) or Trpm2 knockout (M2KO) mice after 24h oxLDL treatment (n=6/group). (c, d) Representative WB analysis (WB) of CD36, pFyn, pJNK and pp38 expression in macrophages (n=6/group). (e, f) Representative images and quantification of ORO staining of macrophages (n=8/group) treated with and without anisomycin (10 μM), a p38 and pJNK activator. (g-h) Representative WB of CD36, pFyn, pJNK and pp38 expression in macrophages. BAPTA-AM (1 μM), an intracellular Ca2+ chelator. (i, j) Representative images and quantification of ORO staining of macrophages treated with BAPTA-AM (n=3/group). (k, l) k, Representative images of Rhodamine-123 (R123) real-time imaging before and 5 min after oxLDL treatment in macrophages. Control group (PBS treatment) was used to show the rapid photo bleaching of R123. l, Quantification of R123 fluorescence changes 5 min after oxLDL treatment (n=30,40,40,43, respectively). (m, n) Quantification and representative WB of iNOS expression in macrophages (n=6/group). (o, p) o, Representative real-time ratio Ca2+ imaging traces during oxLDL treatment. The averaged traces were from 10 macrophages randomly chosen from a representative culture dish for each group. p, Quantification of Fura-2 fluorescence changes 5 min after oxLDL treatment (n=20/group). (q, r) q, Representative images of R123 imaging before and 5 min after oxLDL treatment in macrophages with DMSO or BAPTA-AM (1 μM) preloading for 30 min. r, Quantification of R123 fluorescence changes 5 min after oxLDL treatment (n=20/group). (s) Measurement of IL-1β level in culture medium of isolated macrophages after oxLDL treatment using ELISA (n=4/group). (t, v) Representative WB of MCP1 and MIF expression in macrophages (n=6/group). (u, w) Representative WB of pp65 expression in macrophages (n=6/group). (oxLDL (50 μg/ml) was treated for 24 h for all the ORO staining and WB analysis; ns: no statistical significance; *: p < 0.05; **: p < 0.01; ***: p < 0.001; ANOVA, two-tailed, Bonferroni’s test; mean ± SEM).
Fig. 5:
Fig. 5:. Trpm2 deletion inhibits the activation of CD36 signaling by TSP1.
(a, b) Representative WB analysis of CD36, pFyn, pJNK and pp38 expression in macrophages. (c, d) c, Representative R123 imaging before and 5 min after TSP1 treatment in macrophages. Control group (Con: PBS treatment) was used to show the rapid photo bleaching of R123. d, Quantification of changes of R123 fluorescence 5 min after TSP1 treatment. WT (n=45 for TSP1 treatment, n=47 for control) and M2KO (n=43 for TSP1 treatment, n=47 for control) macrophages were from 4 dishes of cultured macrophages isolated from 4 mice/group. (e, f) Representative WB of iNOS expression in isolated macrophages treated with TSP1 (10 μg/ml). (g), Representative real-time ratio Ca2+ imaging traces during TSP1 treatment. The averaged traces were from 10 macrophages randomly chosen from a representative culture dish of each group. (h), Quantification of Fura-2 fluorescence changes 5 min after TSP1 treatment. WT (n=20 for TSP1 treatment, n=20 for control) and M2KO (n=20 for TSP1 treatment, n=20 for control) macrophages were from 3 dishes of cultured cells isolated from 3 mice in each group. (i, j) Representative WB of CD36, pFyn, pJNK and pp38 expression in macrophages after treatment with TSP1 and DMSO or BAPTA-AM (1 μM), an intracellular Ca2+ chelator (n=3/group). (k, l) k, Representative images of R123 imaging in macrophages before and 5 min after oxLDL treatment with DMSO or BAPTA-AM (1 μM) preloading for 30 min. l, Quantification of R123 fluorescence changes 5 min after TSP1 treatment (n=20/group). (m) Measurement of IL-1β level in culture medium after TSP1 treatment using ELISA. (n, o) Representative WB of MCP1 and MIF expression in macrophages (n=6/group). (p, q) Representative WB analysis and quantification of pp65 expression in macrophages (n=6/group). (TSP1 (10 μg/ml) was treated for 24 h for all the WB analysis; ns: no statistical significance; *: p < 0.05; **: p < 0.01; ***: p < 0.001; ANOVA, two-tailed, Bonferroni’s test; mean ± SEM).
Fig. 6:
Fig. 6:. TRPM2 mediates the activation of CD36 signaling.
(a, b) Whole-cell recording of TRPM2 currents in response to oxLDL (50 μg/ml). a, Representative TRPM2 current traces (Green: outward current at +100 mV; Purple: inward current at −100 mV) in HEK293T cells transfected with both CD36 and TRPM2 (upper) during oxLDL treatment. N-Methyl-D-glucamine (NMDG) blocks inward current indicating the tightness of seal. ACA is a TRPM2 blocker. Representative recording traces in HEK293T cells transfected with only TRPM2 (lower) during oxLDL treatment. b, Quantification of TRPM2 current amplitude (n=5,9,6,6,6,6, respectively). (c) TRPM2 current recorded under perforated patch in HEK293T cells transfected with both CD36 and TRPM2 (upper) or transfected with only TRPM2 (lower) during oxLDL treatment. (d, e) Inhibiting TRPM2 activation impairs the activation of CD36 signaling cascade induced by oxLDL (50 μg/ml) in macrophages. Representative WB analysis of CD36, pFyn, pJNK and pp38 expression in isolated macrophages from WT (n=3 in each group) and M2KO mice (n=3 in each group). e, Quantification of WB bands. 3 dishes of macrophages were used for protein extraction in each group. (f, g) Whole-cell recording of TRPM2 current in response to TSP1 (10 μg/ml) (n=5,6,6,6,6,6, respectively). f, Representative TRPM2 current traces (Green: outward current at +100 mV; Purple: inward current at -+100 mV) in HEK293T cells transfected with both CD36 and TRPM2 (upper) during TSP1 treatment. Representative recording traces in HEK293T cells transfected with only TRPM2 (lower) during TSP1 treatment. g, Quantification of TRPM2 current amplitude. (h) TRPM2 current recorded under perforated patch in HEK293T cells transfected with both CD36 and TRPM2 (upper) or transfected with only TRPM2 (lower) during TSP1 treatment. (i, j) Inhibiting TRPM2 activation impairs the activation of CD36 signaling cascade induced by TSP1 (10 μg/ml) in macrophages. Representative WB analysis of CD36, pFyn, pJNK and pp38 expression in isolated macrophages from WT (n=3 in each group) and eM2KO mice (n=3/group). (*: p < 0.05; **: p < 0.01; ***: p < 0.001; ANOVA, two-tailed, Bonferroni’s test; mean ± SEM).
Fig. 7:
Fig. 7:. TRPM2 mediates macrophage activation induced by oxLDL or TSP1.
(a-d) Representative picture of Rhodamine-123 real-time imaging of macrophages before and 5 min after oxLDL treatment (50 μg/ml) as in a, and 5 min after TSP1 treatment (10 μg/ml) as in c in isolated macrophages. Quantification of changes of R123 fluorescence 5 min after oxLDL treatment as in b, and 5 min after TSP1 treatment as in d. For oxLDL treatment, WT (n=40 for PBS, n=38 for DMSO, n=35 for SSO, n=38 for ACA, n=39 for PJ34, n=44 for U73122) and M2KO (n=38 for PBS, n=35 for DMSO) macrophages were from 4 dishes of cultured cells isolated from 3 mice in each group. For TSP1 treatment, WT (n=48 for PBS, n=50 for DMSO, n=53 for SSO, n=51 for ACA, n=57 for PJ34, n=56 for U73122) and M2KO (n=48 for PBS, n=52 for DMSO) macrophages were from 4 dishes of cultured cells isolated from 3 mice in each group. (e-g) Representative WB analysis of iNOS expression in isolated macrophages. 3 dishes of cells from 3 mice from each group were chosen for quantification. (h-k) Representative real-time Fura-2 Ca2+ imaging traces during oxLDL (50 μg/ml) as in h, and during TSP1 treatment (10 μg/ml) as in j. The averaged traces were from 10 macrophages randomly chosen from a representative culture dish of each group. Quantification of fluorescence changes 5 min after oxLDL treatment as in i, and 5 min after TSP1 treatment as in k. For oxLDL treatment and TSP1 treatment, 20 macrophages in each group from 3 dishes isolated from 3 mice were chosen for quantification. (l, m) Measurement of IL-1β level in culture medium of isolated macrophages after the treatment of oxLDL (50 μg/ml) or TSP1 (10 μg/ml) for 24 h using ELISA. 3 dishes of cells from 3 mice from each group were chosen for quantification. (*: p < 0.05; **: p < 0.01; ***: p < 0.001; ANOVA, two-tailed, Bonferroni’s test; mean ± SEM)
Fig. 8:
Fig. 8:. Inhibiting TRPM2 activation suppresses foam cell formation.
(a, b) Representative images and quantification of Oil Red O (ORO) staining of cultured macrophages after the treatment with oxLDL (50 μg/ml) for 24 h. 3 dishes of cells from 3 mice from each group were chosen for quantification. (c-f) Representative WB analysis and quantification of the expression of MCP1 and MIF in cultured macrophages treated with oxLDL (50 μg/ml) or TSP1 (10 μg/ml) for 24 h (n=3/group). (g, h) Inhibiting the activation of TRPM2 suppressed macrophage infiltration. in vitro macrophage infiltration test was performed as graphic illustration in Extended Data Fig. 3a (Red: F4/80; Blue: DAPI; Green: CD80). h, Quantification of the number of infiltrated macrophages within a x 10 field (n=6/group). (i, j) Inhibiting TRPM2 activation prevented the loss of emigration ability in oxLDL-pre-loaded macrophages. in vitro macrophage emigration test was performed as graphic illustration in Extended Data Fig. 3b. Macrophage emigration across endothelial cells induced by MCP1. Aorta-derived endothelial cells were plated on the transwell inserts (pore size: 12 μm) for 2–3 days. Macrophages preloaded with oxLDL for 24 h were added into the upper chamber after endothelial cells completely covered the upper surface of transwells. After 24 h, F4/80 and CD80 staining of macrophages in lower chamber was performed as in i (Red: F4/80; Blue: DAPI; Green: CD80). j, Quantification of the number of infiltrated macrophages within a x 10 field (n=6/group). (ns: no statistical significance; *: p < 0.05; **: p < 0.01; ***: p < 0.001; ANOVA, two-tailed, Bonferroni’s test; mean ± SEM).

Similar articles

Cited by

References

    1. Libby P et al. Atherosclerosis. Nat Rev Dis Primers 5, 56, doi:10.1038/s41572-019-0106-z (2019). - DOI - PubMed
    1. Moore KJ, Sheedy FJ & Fisher EA Macrophages in atherosclerosis: a dynamic balance. Nat Rev Immunol 13, 709–721, doi:10.1038/nri3520 (2013). - DOI - PMC - PubMed
    1. Moore KJ & Tabas I Macrophages in the pathogenesis of atherosclerosis. Cell 145, 341–355, doi:10.1016/j.cell.2011.04.005 (2011). - DOI - PMC - PubMed
    1. Silverstein RL, Li W, Park YM & Rahaman SO Mechanisms of cell signaling by the scavenger receptor CD36: implications in atherosclerosis and thrombosis. Trans Am Clin Climatol Assoc 121, 206–220 (2010). - PMC - PubMed
    1. Moore KJ & Freeman MW Scavenger receptors in atherosclerosis: beyond lipid uptake. Arterioscler Thromb Vasc Biol 26, 1702–1711, doi:10.1161/01.ATV.0000229218.97976.43 (2006). - DOI - PubMed