. 2022 Apr 19;39(3):110702.
doi: 10.1016/j.celrep.2022.110702.

Dimerization-dependent membrane tethering by Atg23 is essential for yeast autophagy

Affiliations

Dimerization-dependent membrane tethering by Atg23 is essential for yeast autophagy

Wayne D Hawkins et al. Cell Rep. .

Abstract

Eukaryotes maintain cellular health through the engulfment and subsequent degradation of intracellular cargo using macroautophagy. The function of Atg23, despite being critical to the efficiency of this process, is unclear due to a lack of biochemical investigations and an absence of any structural information. In this study, we use a combination of in vitro and in vivo methods to show that Atg23 exists primarily as a homodimer, a conformation facilitated by a putative amphipathic helix. We utilize small-angle X-ray scattering to monitor the overall shape of Atg23, revealing that it contains an extended rod-like structure spanning approximately 320 Å. We also demonstrate that Atg23 interacts with membranes directly, primarily through electrostatic interactions, and that these interactions lead to vesicle tethering. Finally, mutation of the hydrophobic face of the putative amphipathic helix completely precludes dimer formation, leading to severely impaired subcellular localization, vesicle tethering, Atg9 binding, and autophagic efficiency.

Keywords: CP: Cell biology; autophagy; lysosome; membrane tether; stress; vacuole.


Conflict of interest statement

Declaration of interests The authors declare no competing interests.

Figures

Figure 1.
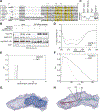
Figure 1.. Atg23 is an extended homodimer
(A) Atg23-MYC with PA empty vector or Atg23-PA were overexpressed in the MKO cells under nutrient-rich conditions. Immunoglobulin G (IgG) Sepharose beads were used to affinity isolate PA. Proteins were visualized by western blot with a representative image shown. (B) CD spectrum of Atg23 contains two minima at 208 and 222 nm. (C) Sedimentation AUC for Atg23 (13.1 μM) yielded a single peak with a sedimentation coefficient of 3.5 and a molecular weight of 103.7 kDa. (D) Averaged SAXS scattering curve from two independent SEC-SAXS experiments; Guinier analysis is inset. Error bars represent the standard error. (E) A pair distance distribution function was calculated from the scattering curve in (D) using GNOM with a maximum dimension of 320 Å. Error bars represent the estimated errors from GNOM. (F) Ten independent envelopes were calculated from the scattering curve in (D) using GASBOR. The 10 envelopes were aligned in SUPCOMB, averaged, and filtered using DAMAVER. The averaged envelope (gray) and filtered envelope (blue) are shown as mesh representations, with a 90° rotation (right).
Figure 2.
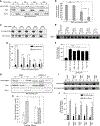
Figure 2.. Atg23[LIL] is a monomer
(A) Alignment of ScAtg23 amino acids 150–210 with nine Atg23 yeast species. Amino acids with greater than 50% conservation are marked in yellow. Residues mutated in Atg23[LIL] are marked. (B) Atg23-MYC and PA empty vector, Atg23-MYC and Atg23-PA, or Atg23[LIL]-MYC and Atg23-PA were overexpressed in the MKO background under nutrient-rich conditions. IgG Sepharose beads were used to affinity isolate PA. Proteins were visualized by western blot with a representative image shown. A long exposure (LE) image was also collected. (C) Yeast cells were grown in nutrient-rich medium, converted to spheroplasts, and lysed in native sample buffer. The resulting lysates were run on a 6% non-denaturing polyacrylamide gel. Western blotting was performed with an Atg23-specific antiserum. Purified Atg23 and Atg23[LIL] were run in lanes three and four, respectively. (D) Overlayed CD spectra of Atg23 and Atg23[LIL]. The spectra contain two minima at 208 and 222 nm. (E) Overlay of the sedimentation AUC for Atg23 (13.1 μM) and Atg23[LIL] (14.1 μM). Atg23[LIL] exists as a monomer with a sedimentation coefficient of 2.7 and a molecular weight of 50.9 kDa. (F) Pair distance distribution function of Atg23 and Atg23[LIL] with maximum dimensions of 320 Å and 170 Å, respectively. (G) Low-resolution envelopes of Atg23[LIL] (dark blue) overlayed with Atg23 WT. (H) The AlphaFold model of Atg23 was docked using HADDOCK with L171, I182, and L189 as dimer constraints (labeled). The model was then placed in the SAXS envelope of Atg23. The two monomers are colored in red and cyan.
Figure 3.
Figure 3.. Atg23 is a membrane-binding protein
(A) 6xHis-Atg23 was overexpressed in the MKO cells and analyzed by subcellular fractionation in the presence of varying salt concentrations. “S” represents the supernatant and “P” the pellet. Pgk1 is included as a soluble protein control and the transmembrane protein Dpm1 as a membrane control. (B) Quantification of (A). Error bars show standard error of the mean (SEM). n = 3; ns, not significant; **p < 0.01 by Tukey honestly significant difference (HSD) test. (C) Liposome sedimentation assay with Atg23 and YPL liposomes at the indicated NaCl concentrations. Representative SDS-PAGE gels containing the S and P fractions are shown. (D) The percent of protein in the pellet fraction in (C) was quantified by densitometry. Error bars represent the SD from three experiments. Statistical significance was determined by two-way ANOVA with Sidak’s multiple comparison test. ***p < 0.001; **p < 0.01. (E) Liposome sedimentation assay with Atg23 and YPL liposomes of the indicated sizes in 50 mM NaCl. Representative gels containing the S and P fractions are shown. (F) Quantification of (E) by densitometry. Error bars represent the SD from three experiments. Statistical significance was determined by ordinary one-way ANOVA with Tukey’s multiple comparison test. ****p < 0.0001 to the no-liposome control. (G) 6xHis-Atg23 and 6xHis-Atg23[LIL] were overexpressed in the MKO cells and analyzed by subcellular fractionation. Total (T) represents the input prior to centrifugation. (H) Quantification of (G) from five biological replicates. Error bars represent SEM; *p = 0.016 by two-sample t test. (I) Liposome sedimentation assays with YPL liposomes and Atg23, Atg23[LIL], M3, M4, or M5 at 100 mM NaCl. Representative gels containing the S and P fractions are shown. (J) Quantification of (I) by densitometry. Error bars represent the SD from four experiments. Statistical significance was determined by two-way ANOVA with Tukey’s multiple comparison test. **p < 0.01; *p < 0.05.
Figure 4.
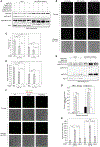
Figure 4.. Atg23[LIL] is defective in dimerization, subcellular localization, and Atg9 puncta formation
(A) Atg23-PA was overexpressed with MYC-tagged Atg23, Atg23[L], Atg23[IL], or Atg23[LIL] in the MKO background under nutrient-rich conditions. IgG Sepharose beads were used to affinity isolate PA. Proteins were visualized by western blot with representative images shown. An LE image was also collected. (B) Representative images of endogenously expressed Atg23, Atg23[L], or Atg23[IL] chromosomally tagged with GFP were grown in either nutrient-rich or nitrogen-starvation medium for 1 h. Scale bars: 5 μm. (C) Quantification of the average number of Atg23 puncta per cell. Error bars represent SEM. n > 50 cells; ***p < 0.001 by Tukey HSD test. (D) Quantification of Atg23 puncta intensity represented as arbitrary intensity units (AU). Error bars represent SEM. n > 200 puncta; ***p < 0.001 by Tukey HSD test. (E) Atg9-MYC and PA empty vector, Atg23-PA, or Atg23[LIL]-PA were overexpressed in the MKO background under nutrient-rich conditions. IgG Sepharose beads were used to affinity isolate PA. An LE image of Atg9 was also collected. (F) Representative images of Atg9–3xGFP and RFP-Ape1 in the absence of Atg1 and presence of empty vector, Atg23, or Atg23[LIL] grown in either nutrient-rich or nitrogen-starvation medium for 1 h. Scale bars: 5 μm. (G) Quantification of the percentage of RFP-Ape1 puncta colocalized with Atg9–3xGFP. Error bars represent SEM. n = 25 images; ***p < 0.001 by Tukey HSD test. (H) Quantification of the Atg9 puncta intensity. Error bars represent SEM. n = 150 puncta; ***p < 0.001; *p < 0.05 by Tukey HSD test.
Figure 5.
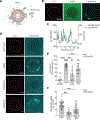
Figure 5.. Atg23 is a vesicle-tethering protein
(A) Schematic representation of the tethering assay. Colocalization of Rhod-PE-GUVs and DiD-liposomes indicates vesicle tethering. (B) GUVs were mixed with 1 μM Alexa Fluor 488 (AF488)-Atg23 and liposomes, incubated for 10 min, and imaged in a LabTek chamber. Representative images of AF488-Atg23 (green) with tethered liposomes (cyan) are shown. Scale bar: 10 μm. (C) Intensity profile showing AF488-Atg23 and liposome fluorescence on a segmented line placed along the surface of the GUV in (B). (D) Representative images of liposomes (cyan) tethered on GUVs (red) in the absence of protein, with unlabeled Atg23, Atg23[LIL], or Atg23 M4. Scale bars: 10 μm. Tethering was analyzed by measuring the DiD intensity profile along the entire GUV surface. GUVs with DiD intensity profiles showing peaks that were 3-fold over the mean background intensity were categorized as GUVs with tethered liposomes. (E) Quantification showing percent GUVs with tethered liposomes. (F) Quantification showing normalized number of DiD intensity peaks above background on GUVs with tethered liposomes. (E and F) Data from three independent experiments were analyzed using ordinary one-way ANOVA with Dunnett’s multiple comparisons test. ****p < 0.0001; ***p < 0.001. Error bars represent SD. n indicates number of independent repeats. nGUVs indicate total number of GUVs analyzed.
Figure 6.
Figure 6.. Atg23 dimerization is critical for the role of Atg23 in the Cvt pathway and nonselective autophagy
(A) atg23Δ cells exogenously expressing an empty vector, Atg23, or Atg23[LIL] under the endogenous promoter were grown overnight in nutrient-rich medium. Ape1 from cell lysates was inspected by western blot using anti-Ape1 antiserum. (B) Quantification of (A). (C) Empty vector, Atg23, or Atg23[LIL] driven by the endogenous promoter was expressed in atg23Δ cells also expressing GFP-Atg8 under the control of the CUP1 promoter. Cells were harvested in log phase after 0, 1, or 1.5 h of exposure to nitrogen-deficient medium. Processing of GFP-Atg8 to free GFP was assessed by western blot. (D) Quantification of (C). (E) Pho8Δ60 activity was assessed for atg23Δ Pho8Δ60 cells expressing empty vector, Atg23, or Atg23[LIL] under the control of the endogenous promoter. Quantification shows values as a percentage of wild-type activity after 4 h of nitrogen starvation. (B, D, and E) Error bars represent SEM; n = 3; ***p < 0.001 by Tukey HSD test.
Figure 7.
Figure 7.. Schematic representation of Atg23 dimerization, membrane binding, and vesicle tethering
Both monomers of the protein adhere to negatively charged vesicles through several spatially dispersed residues. Dimerization of Atg23 mediated by the putative amphipathic helix results in the tethering of Atg9-containing vesicles at the trans-Golgi. Mutation of key hydrophobic residues within this putative amphipathic helix prevents dimerization as well as proper positioning of some membrane-binding residues. Thus, monomeric Atg23 is entirely deficient in subcellular localization, membrane tethering, and autophagic function while being partially deficient in membrane and Atg9 binding.

Comment in

  • Atg23 is a vesicle-tethering protein.
    Leary KA, Hawkins WD, Andhare D, Popelka H, Klionsky DJ, Ragusa MJ. Leary KA, et al. Autophagy. 2022 Oct;18(10):2510-2511. doi: 10.1080/15548627.2022.2105107. Epub 2022 Aug 1. Autophagy. 2022. PMID: 35867625 Free PMC article.

Similar articles

Cited by

References

    1. Backues SK, Orban DP, Bernard A, Singh K, Cao Y, and Klionsky DJ (2015). Atg23 and Atg27 act at the early stages of Atg9 trafficking in S. cerevisiae. Traffic 16, 172–190. - PMC - PubMed
    1. Baum P, Thorner J, and Honig L (1978). Identification of tubulin from the yeast Saccharomyces cerevisiae. Proc. Natl. Acad. Sci. U S A 75, 4962–4966. - PMC - PubMed
    1. Bernard A, and Klionsky DJ (2013). Autophagosome formation: tracing the source. Dev. Cell 25, 116–117. - PMC - PubMed
    1. Cao Y, Cheong H, Song H, and Klionsky DJ (2008). In vivo reconstitution of autophagy in Saccharomyces cerevisiae. J. Cell Biol. 182, 703–713. - PMC - PubMed
    1. Cao Y, and Klionsky DJ (2008). New insights into autophagy using a multiple knockout strain. Autophagy 4, 1073–1075. - PMC - PubMed

Publication types

MeSH terms

Substances