

Metabolic signatures across the full spectrum of non-alcoholic fatty liver disease
- PMID: 35434590
- PMCID: PMC9006858
- DOI: 10.1016/j.jhepr.2022.100477
Metabolic signatures across the full spectrum of non-alcoholic fatty liver disease
Abstract
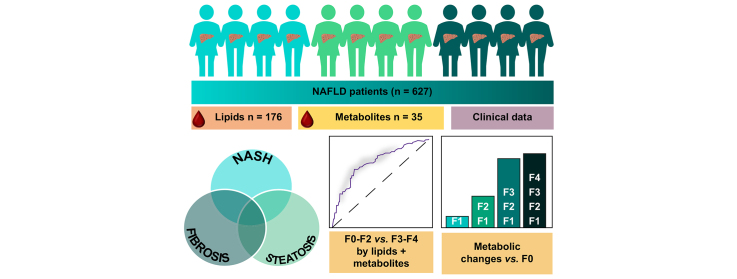
Background & aims: Non-alcoholic fatty liver disease (NAFLD) is a progressive liver disease with potentially severe complications including cirrhosis and hepatocellular carcinoma. Previously, we have identified circulating lipid signatures associating with liver fat content and non-alcoholic steatohepatitis (NASH). Here, we develop a metabolomic map across the NAFLD spectrum, defining interconnected metabolic signatures of steatosis (non-alcoholic fatty liver, NASH, and fibrosis).
Methods: We performed mass spectrometry analysis of molecular lipids and polar metabolites in serum samples from the European NAFLD Registry patients (n = 627), representing the full spectrum of NAFLD. Using various univariate, multivariate, and machine learning statistical approaches, we interrogated metabolites across 3 clinical perspectives: steatosis, NASH, and fibrosis.
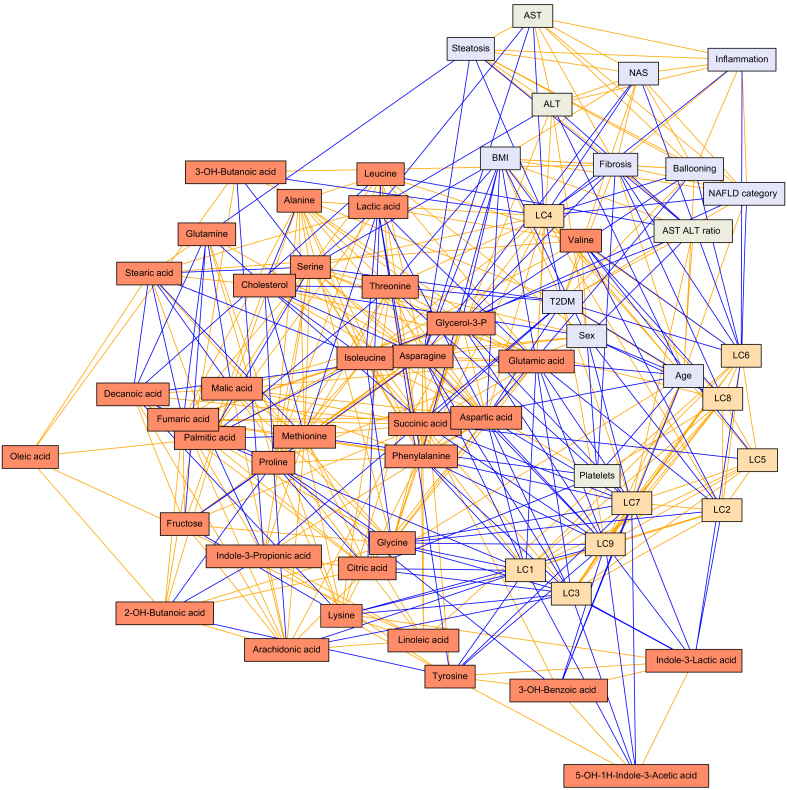
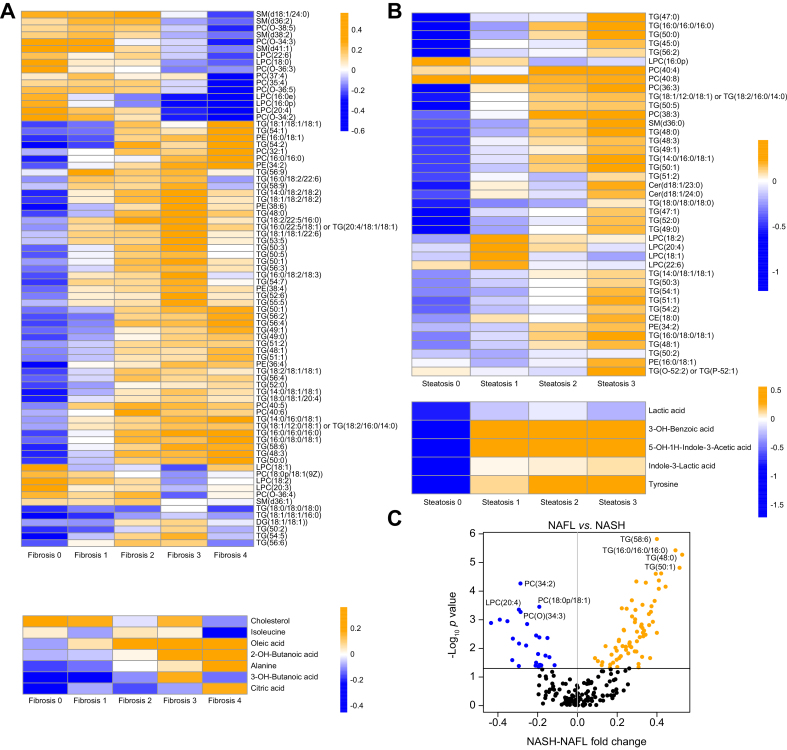
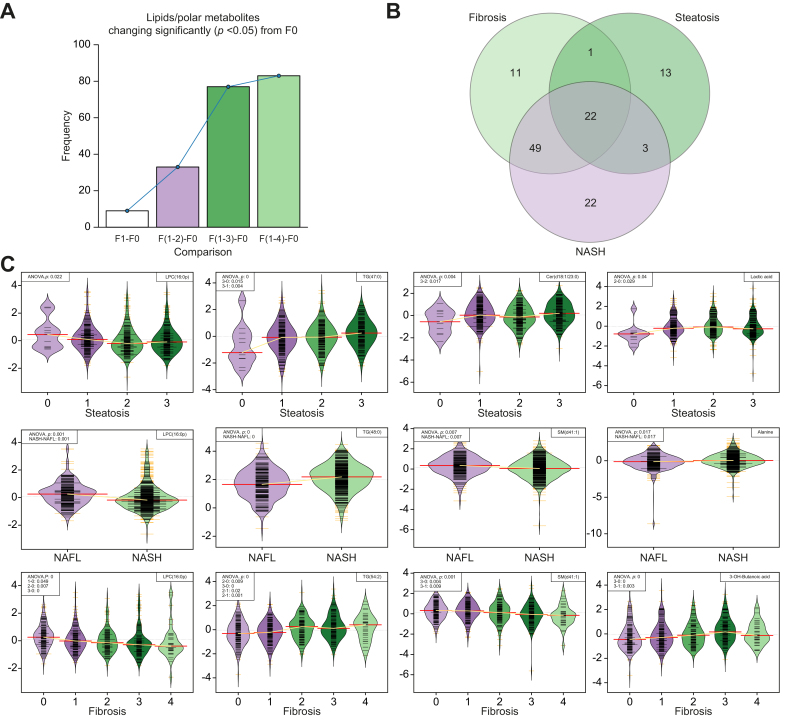
Results: Following generation of the NAFLD metabolic network, we identify 15 metabolites unique to steatosis, 18 to NASH, and 15 to fibrosis, with 27 common to all. We identified that progression from F2 to F3 fibrosis coincides with a key pathophysiological transition point in disease natural history, with n = 73 metabolites altered.
Conclusions: Analysis of circulating metabolites provides important insights into the metabolic changes during NAFLD progression, revealing metabolic signatures across the NAFLD spectrum and features that are specific to NAFL, NASH, and fibrosis. The F2-F3 transition marks a critical metabolic transition point in NAFLD pathogenesis, with the data pointing to the pathophysiological importance of metabolic stress and specifically oxidative stress.
Clinical trials registration: The study is registered at Clinicaltrials.gov (NCT04442334).
Lay summary: Non-alcoholic fatty liver disease is characterised by the build-up of fat in the liver, which progresses to liver dysfunction, scarring, and irreversible liver failure, and is markedly increasing in its prevalence worldwide. Here, we measured lipids and other small molecules (metabolites) in the blood with the aim of providing a comprehensive molecular overview of fat build-up, liver fibrosis, and diagnosed severity. We identify a key metabolic 'watershed' in the progression of liver damage, separating severe disease from mild, and show that specific lipid and metabolite profiles can help distinguish and/or define these cases.
Keywords: 2-HB, 2-hydroxybutanoic acid; 3-HB, 3-hydroxybutanoic acid; ALT, alanine aminotransferase; AST, aspartate aminotransferase; CE, cholesterol ester; Cer, ceramide; FFA, free fatty acid; FLIP, Fatty Liver Inhibition of Progression; Fibrosis; GC, gas chromatography; HCC, hepatocellular carcinoma; HSD, honest significant difference; LC, lipid cluster; LDL, low-density lipoprotein; LM, lipid and metabolite; LMC, lipid, metabolite, and clinical variable; LPC, lysophosphatidylcholine; Lipidomics; Mass spectrometry; Metabolomics; NAFL, non-alcoholic fatty liver; NAFLD, non-alcoholic fatty liver disease; NAS, NASH activity score; NASH, non-alcoholic steatohepatitis; NIDDK NASH-CRN, National Institute of Digestive Diseases and Kidney NASH Clinical Research Network; NRR, non-rejection rate; Non-alcoholic steatohepatitis; PC(O), ether PC; PC, phosphatidylcholine; PCA, principal component analysis; PE, phosphatidylethanolamine; QTOFMS, quadrupole-time-of-flight mass spectrometry; ROC, receiving operator characteristic; SAF, steatosis, activity, and fibrosis; SM, sphingomyelin; T2DM, type 2 diabetes mellitus; TG, triacylglycerol; UHPLC, ultrahigh-performance liquid chromatography.
© 2022 The Author(s).
Conflict of interest statement
QMA is Coordinator of the EU IMI-2 LITMUS consortium, which is funded by the EU Horizon 2020 programme and EFPIA. He reports research grant funding: Allergan/Tobira, AstraZeneca, GlaxoSmithKline, Glympse Bio, Novartis Pharma AG, and Pfizer Ltd. Consultancy: 89Bio, Allergan/Tobira, Altimmune, AstraZeneca, Axcella, Blade, BMS, BNN Cardio, Cirius, CymaBay, EcoR1, E3Bio, Eli Lilly & Company Ltd., Galmed, Genentech, Genfit SA, Gilead, Grunthal, HistoIndex, Indalo, Intercept Pharma Europe Ltd., Inventiva, IQVIA, Janssen, Madrigal, MedImmune, Medpace, Metacrine, NGMBio, North Sea Therapeutics, Novartis, Novo Nordisk A/S, PathAI, Pfizer Ltd., Poxel, ProSciento, Raptor Pharma, Roche, Servier, Terns, The Medicines Company, and Viking Therapeutics. Speaker: Abbott Laboratories, Allergan/Tobira, BMS, Clinical Care Options, Falk, Fishawack, Genfit SA, Gilead, Integritas Communications, Kenes, and Medscape. Royalties: Elsevier Ltd. Please refer to the accompanying ICMJE disclosure forms for further details.
Figures
Similar articles
-
LC-MS-based lipidomic analysis in distinguishing patients with nonalcoholic steatohepatitis from nonalcoholic fatty liver.Hepatobiliary Pancreat Dis Int. 2021 Oct;20(5):452-459. doi: 10.1016/j.hbpd.2021.05.008. Epub 2021 Jun 25. Hepatobiliary Pancreat Dis Int. 2021. PMID: 34256994
-
A human liver chimeric mouse model for non-alcoholic fatty liver disease.JHEP Rep. 2021 Mar 21;3(3):100281. doi: 10.1016/j.jhepr.2021.100281. eCollection 2021 Jun. JHEP Rep. 2021. PMID: 34036256 Free PMC article.
-
Increased serum miR-193a-5p during non-alcoholic fatty liver disease progression: Diagnostic and mechanistic relevance.JHEP Rep. 2021 Nov 25;4(2):100409. doi: 10.1016/j.jhepr.2021.100409. eCollection 2022 Feb. JHEP Rep. 2021. PMID: 35072021 Free PMC article.
-
Indian National Association for Study of the Liver (INASL) Guidance Paper on Nomenclature, Diagnosis and Treatment of Nonalcoholic Fatty Liver Disease (NAFLD).J Clin Exp Hepatol. 2023 Mar-Apr;13(2):273-302. doi: 10.1016/j.jceh.2022.11.014. Epub 2022 Dec 7. J Clin Exp Hepatol. 2023. PMID: 36950481 Free PMC article. Review.
-
NAFLD (MASLD)/NASH (MASH): Does It Bother to Label at All? A Comprehensive Narrative Review.Int J Mol Sci. 2024 Aug 2;25(15):8462. doi: 10.3390/ijms25158462. Int J Mol Sci. 2024. PMID: 39126031 Free PMC article. Review.
Cited by
-
Ceramides as Risk Markers for Future Cardiovascular Events and All-Cause Mortality in Long-standing Type 1 Diabetes.Diabetes. 2023 Oct 1;72(10):1493-1501. doi: 10.2337/db23-0052. Diabetes. 2023. PMID: 37478203 Free PMC article.
-
Elevated FIB-4 Is Associated with Higher Rates of Cardiovascular Disease and Extrahepatic Cancer History in Patients with Type 2 Diabetes Mellitus.Biomedicines. 2024 Apr 9;12(4):823. doi: 10.3390/biomedicines12040823. Biomedicines. 2024. PMID: 38672178 Free PMC article.
-
Chewing the fat: How lipidomics is changing our understanding of human health and disease in 2022.Anal Sci Adv. 2023 May 10;4(3-4):104-131. doi: 10.1002/ansa.202300009. eCollection 2023 May. Anal Sci Adv. 2023. PMID: 38715925 Free PMC article. Review.
-
Metabolomics and Lipidomics for Studying Metabolic Syndrome: Insights into Cardiovascular Diseases, Type 1 & 2 Diabetes, and Metabolic Dysfunction-Associated Steatotic Liver Disease.Physiol Res. 2024 Aug 30;73(S1):S165-S183. doi: 10.33549/physiolres.935443. Physiol Res. 2024. PMID: 39212142 Free PMC article. Review.
-
Relationship of liver fat content with systemic metabolism and chronic complications in patients with type 2 diabetes mellitus.Lipids Health Dis. 2023 Jan 24;22(1):11. doi: 10.1186/s12944-023-01775-6. Lipids Health Dis. 2023. PMID: 36694216 Free PMC article.
References
-
- Anstee Q.M., Targher G., Day C.P. Progression of NAFLD to diabetes mellitus, cardiovascular disease or cirrhosis. Nat Rev Gastroenterol Hepatol. 2013;10:330–344. - PubMed
-
- Younossi Z., Anstee Q.M., Marietti M., Hardy T., Henry L., Eslam M., et al. Global burden of NAFLD and NASH: trends, predictions, risk factors and prevention. Nat Rev Gastroenterol Hepatol. 2018;15:11–20. - PubMed
-
- Byrne C.D., Targher G. NAFLD: a multisystem disease. J Hepatol. 2015;62(Suppl. 1):S47–64. - PubMed
-
- Rinella M.E., Tacke F., Sanyal A.J. Anstee QM, participants of the AASLD/EASL Workshop. Report on the AASLD/EASL joint workshop on clinical trial endpoints in NAFLD. J Hepatol. 2019;71:823–833. - PubMed
Associated data
LinkOut - more resources
Full Text Sources
Miscellaneous
