Adult Memory T Cell Responses to the Respiratory Syncytial Virus Fusion Protein During a Single RSV Season (2018-2019)
- PMID: 35422803
- PMCID: PMC9002099
- DOI: 10.3389/fimmu.2022.823652
Adult Memory T Cell Responses to the Respiratory Syncytial Virus Fusion Protein During a Single RSV Season (2018-2019)
Abstract
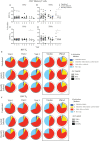
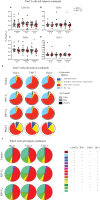
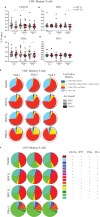
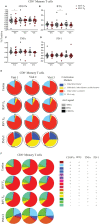
Respiratory Syncytial Virus (RSV) is ubiquitous and re-infection with both subtypes (RSV/A and RSV/B) is common. The fusion (F) protein of RSV is antigenically conserved, induces neutralizing antibodies, and is a primary target of vaccine development. Insight into the breadth and durability of RSV-specific adaptive immune response, particularly to the F protein, may shed light on susceptibility to re-infection. We prospectively enrolled healthy adult subjects (n = 19) and collected serum and peripheral blood mononuclear cells (PBMCs) during the 2018-2019 RSV season. Previously, we described their RSV-specific antibody responses and identified three distinct antibody kinetic profiles associated with infection status: uninfected (n = 12), acutely infected (n = 4), and recently infected (n = 3). In this study, we measured the longevity of RSV-specific memory T cell responses to the F protein following natural RSV infection. We stimulated PBMCs with overlapping 15-mer peptide libraries spanning the F protein derived from either RSV/A or RSV/B and found that memory T cell responses mimic the antibody responses for all three groups. The uninfected group had stable, robust memory T cell responses and polyfunctionality. The acutely infected group had reduced polyfunctionality of memory T cell response at enrollment compared to the uninfected group, but these returned to comparable levels by end-of-season. The recently infected group, who were unable to maintain high levels of RSV-specific antibody following infection, similarly had decreased memory T cell responses and polyfunctionality during the RSV season. We observed subtype-specific differences in memory T cell responses and polyfunctionality, with RSV/A stimulating stronger memory T cell responses with higher polyfunctionality even though RSV/B was the dominant subtype in circulation. A subset of individuals demonstrated an overall deficiency in the generation of a durable RSV-specific adaptive immune response. Because memory T cell polyfunctionality may be associated with protection against re-infection, this latter group would likely be at greater risk of re-infection. Overall, these results expand our understanding of the longevity of the adaptive immune response to the RSV fusion protein and should be considered in future vaccine development efforts.
Keywords: fusion protein; infection; memory T cell; peptide library; polyfunctionality; respiratory syncytial virus (RSV); viral immunity.
Copyright © 2022 Blunck, Angelo, Henke, Avadhanula, Cusick, Ferlic-Stark, Zechiedrich, Gilbert and Piedra.
Conflict of interest statement
The authors declare that the research was conducted in the absence of any commercial or financial relationships that could be construed as a potential conflict of interest.
Figures


Similar articles
-
Antibody responses of healthy adults to the p27 peptide of respiratory syncytial virus fusion protein.Vaccine. 2022 Jan 24;40(3):536-543. doi: 10.1016/j.vaccine.2021.11.087. Epub 2021 Dec 10. Vaccine. 2022. PMID: 34903371 Free PMC article.
-
A prospective surveillance study on the kinetics of the humoral immune response to the respiratory syncytial virus fusion protein in adults in Houston, Texas.Vaccine. 2021 Feb 22;39(8):1248-1256. doi: 10.1016/j.vaccine.2021.01.045. Epub 2021 Jan 26. Vaccine. 2021. PMID: 33509697 Free PMC article.
-
Development of a Kinetic ELISA and Reactive B Cell Frequency Assay to Detect Respiratory Syncytial Virus Pre-Fusion F Protein-Specific Immune Responses in Infants.J Pediatric Infect Dis Soc. 2023 May 31;12(5):298-305. doi: 10.1093/jpids/piad019. J Pediatric Infect Dis Soc. 2023. PMID: 37029694 Free PMC article.
-
Human respiratory syncytial virus: pathogenesis, immune responses, and current vaccine approaches.Eur J Clin Microbiol Infect Dis. 2018 Oct;37(10):1817-1827. doi: 10.1007/s10096-018-3289-4. Epub 2018 Jun 6. Eur J Clin Microbiol Infect Dis. 2018. PMID: 29876771 Review.
-
Pulmonary resident memory T cells in respiratory virus infection and their inspiration on therapeutic strategies.Front Immunol. 2022 Aug 12;13:943331. doi: 10.3389/fimmu.2022.943331. eCollection 2022. Front Immunol. 2022. PMID: 36032142 Free PMC article. Review.
Cited by
-
Reshaping Our Knowledge: Advancements in Understanding the Immune Response to Human Respiratory Syncytial Virus.Pathogens. 2023 Sep 1;12(9):1118. doi: 10.3390/pathogens12091118. Pathogens. 2023. PMID: 37764926 Free PMC article. Review.
-
A self-amplifying RNA RSV prefusion-F vaccine elicits potent immunity in pre-exposed and naïve non-human primates.Nat Commun. 2024 Nov 14;15(1):9884. doi: 10.1038/s41467-024-54289-9. Nat Commun. 2024. PMID: 39543172 Free PMC article.
-
Intranasal parainfluenza virus type 5 (PIV5)-vectored RSV vaccine is safe and immunogenic in healthy adults in a phase 1 clinical study.Sci Adv. 2023 Oct 27;9(43):eadj7611. doi: 10.1126/sciadv.adj7611. Epub 2023 Oct 25. Sci Adv. 2023. PMID: 37878713 Free PMC article. Clinical Trial.
-
Differences Between RSV A and RSV B Subgroups and Implications for Pharmaceutical Preventive Measures.Infect Dis Ther. 2024 Aug;13(8):1725-1742. doi: 10.1007/s40121-024-01012-2. Epub 2024 Jul 6. Infect Dis Ther. 2024. PMID: 38971918 Free PMC article. Review.
-
Vaccine-induced antibody Fc-effector functions in humans immunized with a combination Ad26.RSV.preF/RSV preF protein vaccine.J Virol. 2023 Nov 30;97(11):e0077123. doi: 10.1128/jvi.00771-23. Epub 2023 Oct 30. J Virol. 2023. PMID: 37902399 Free PMC article. Clinical Trial.
References
-
- Shi T, McAllister DA, O’Brien KL, Simoes EAF, Madhi SA, Gessner BD, et al. . Global, Regional, and National Disease Burden Estimates of Acute Lower Respiratory Infections Due to Respiratory Syncytial Virus in Young Children in 2015: A Systematic Review and Modelling Study. Lancet (2017) 390:946–58. doi: 10.1016/S0140-6736(17)30938-8 - DOI - PMC - PubMed
-
- Nair H, Nokes DJ, Gessner BD, Dherani M, Madhi SA, Singleton RJ, et al. . Global Burden of Acute Lower Respiratory Infections Due to Respiratory Syncytial Virus in Young Children: A Systematic Review and Meta-Analysis. Lancet (2010) 375(9725):1545–55. doi: 10.1016/S0140-6736(10)60206-1 - DOI - PMC - PubMed
-
- Shi T, Arnott A, Semogas I, Falsey AR, Openshaw P, Wedzicha JA, et al. . The Etiological Role of Common Respiratory Viruses in Acute Respiratory Infections in Older Adults: A Systematic Review and Meta-Analysis. J Infect Dis (2020) 222(Supplement_7):S563–9. doi: 10.1093/infdis/jiy662 - DOI - PMC - PubMed
-
- Shi T, Denouel A, Tietjen AK, Campbell I, Moran E, Li X, et al. . Global Disease Burden Estimates of Respiratory Syncytial Virus-Associated Acute Respiratory Infection in Older Adults in 2015: A Systematic Review and Meta-Analysis. J Infect Dis (2020) 222(Supplement_ 7):S577–83. doi: 10.1093/infdis/jiz059 - DOI - PubMed
MeSH terms
Substances
Grants and funding
LinkOut - more resources
Full Text Sources
Miscellaneous

