. 2022 Apr 14;13(1):2006.
doi: 10.1038/s41467-022-29739-x.

Differences in RNA polymerase II complexes and their interactions with surrounding chromatin on human and cytomegalovirus genomes

Affiliations

Differences in RNA polymerase II complexes and their interactions with surrounding chromatin on human and cytomegalovirus genomes

Benjamin M Spector et al. Nat Commun. .

Abstract

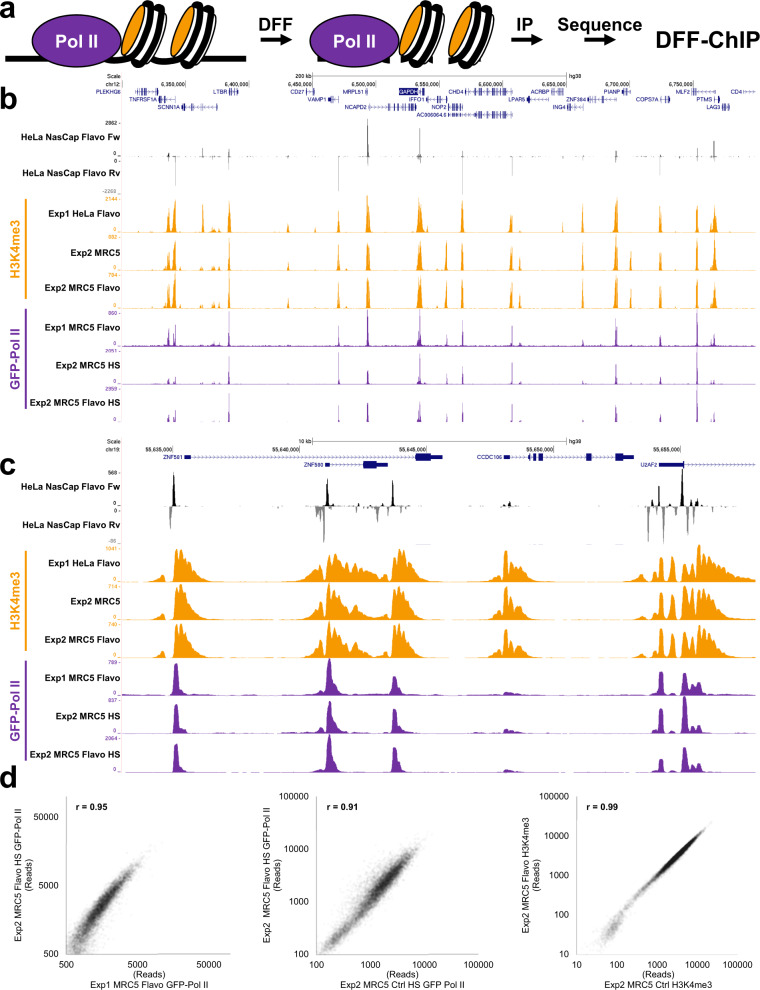
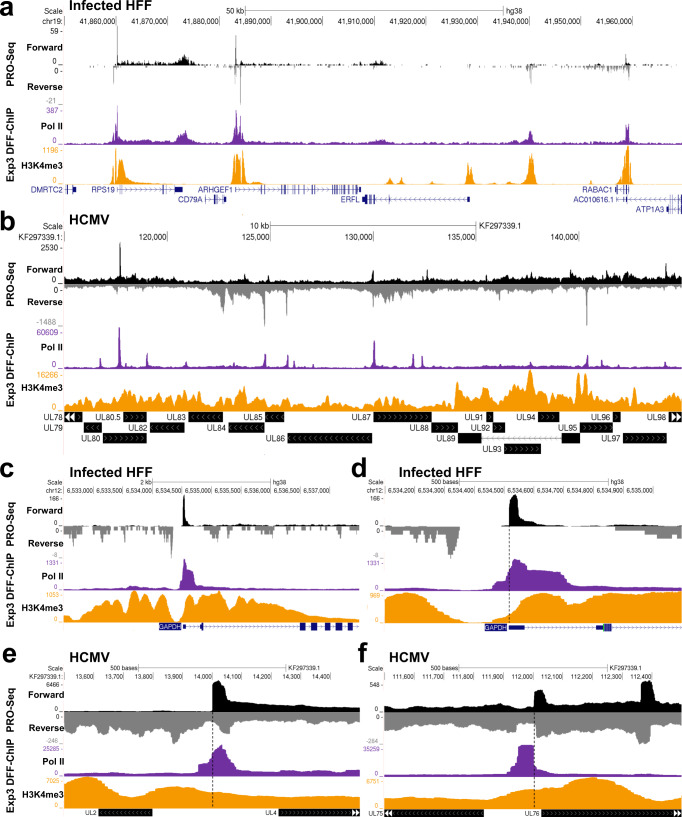
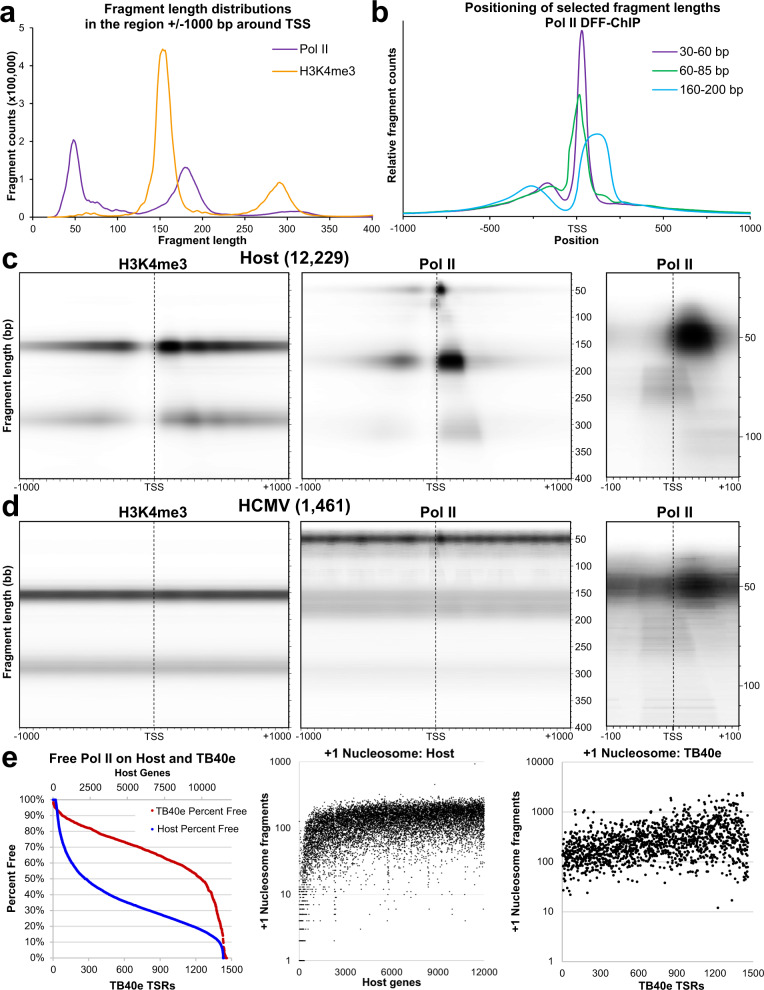
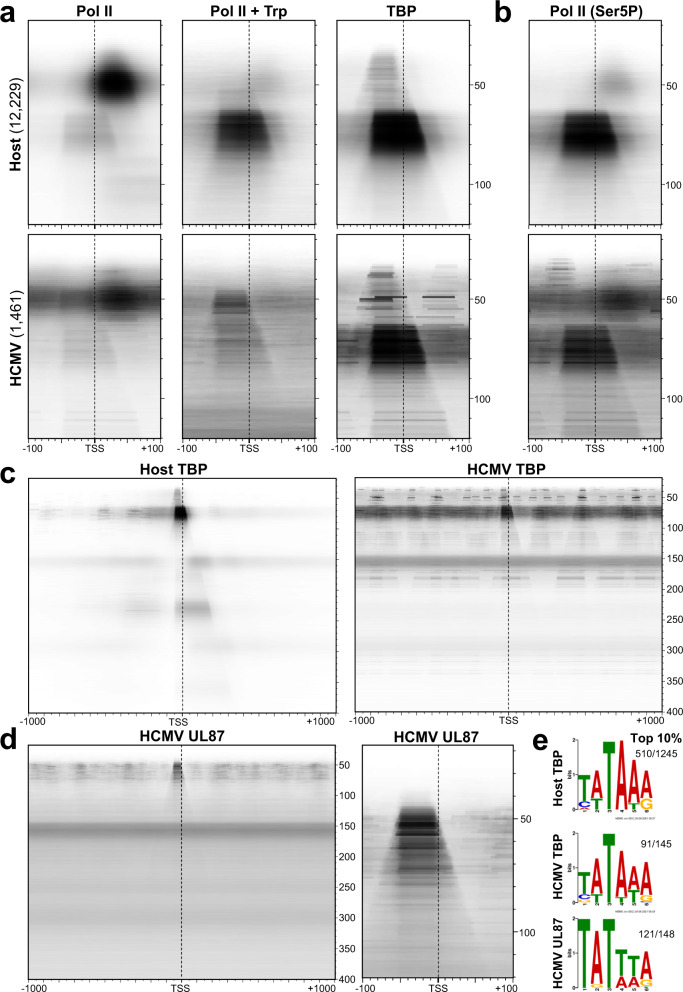
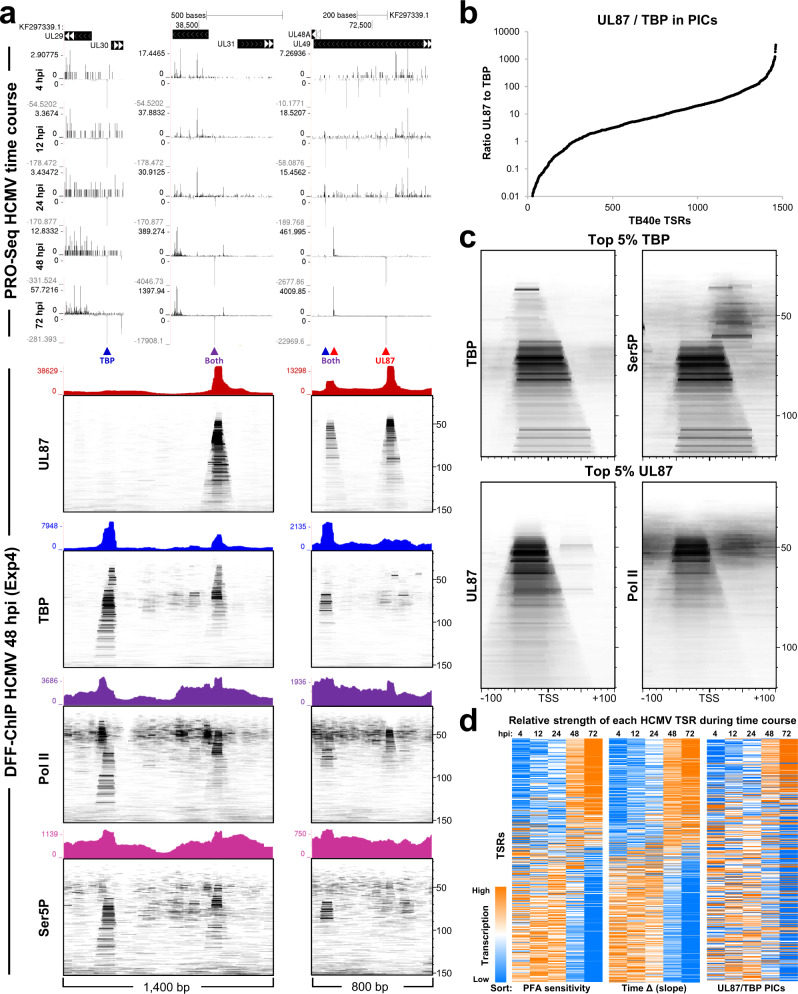
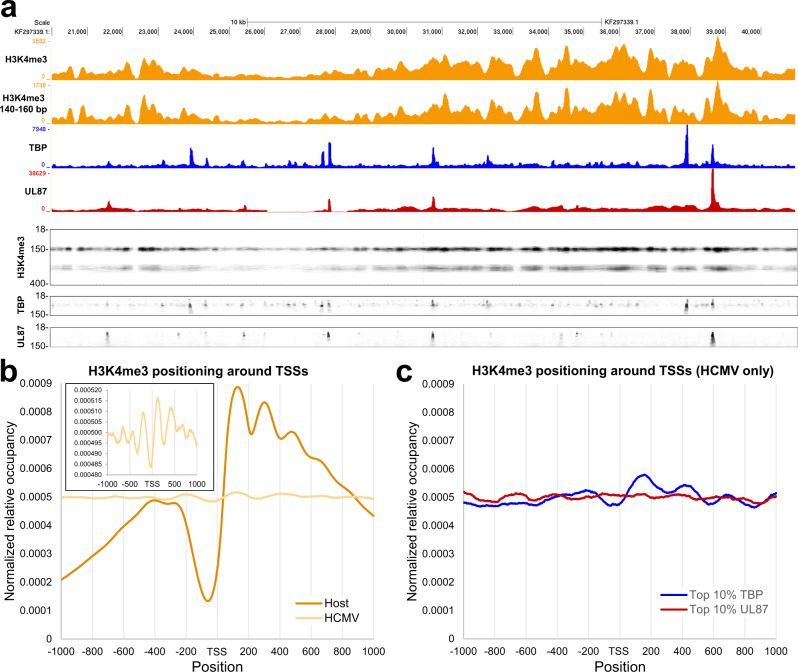
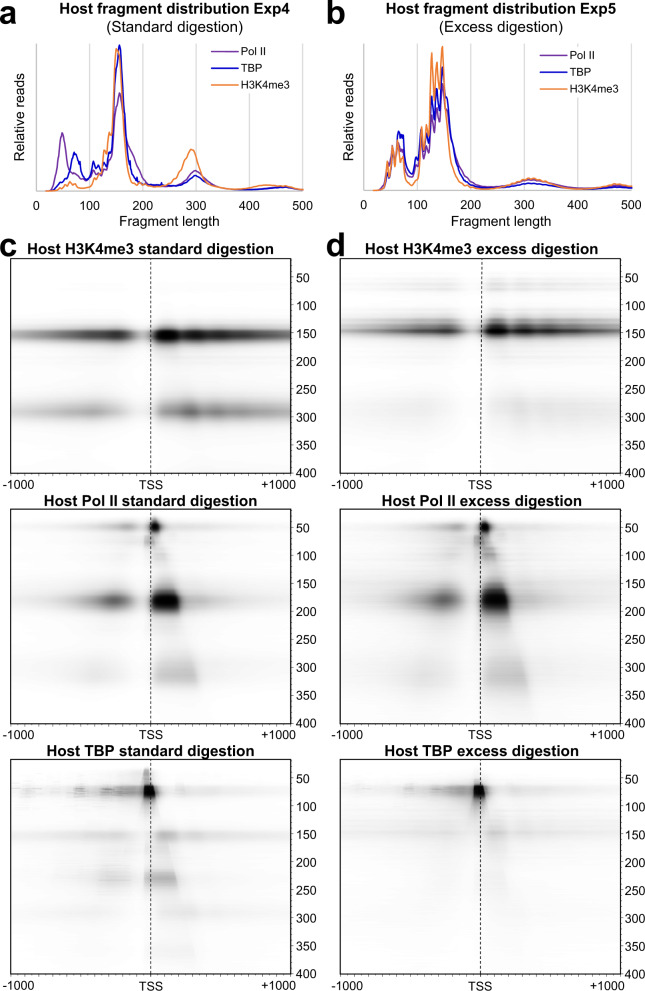
Interactions of the RNA polymerase II (Pol II) preinitiation complex (PIC) and paused early elongation complexes with the first downstream (+1) nucleosome are thought to be functionally important. However, current methods are limited for investigating these relationships, both for cellular chromatin and the human cytomegalovirus (HCMV) genome. Digestion with human DNA fragmentation factor (DFF) before immunoprecipitation (DFF-ChIP) precisely revealed both similarities and major differences in PICs driven by TBP on the host genome in comparison with PICs driven by TBP or the viral-specific, late initiation factor UL87 on the viral genome. Host PICs and paused Pol II complexes are frequently found in contact with the +1 nucleosome and paused Pol II can also be found in a complex involved in the initial invasion of the +1 nucleosome. In contrast, viral transcription complexes have very limited nucleosomal interactions, reflecting a relative lack of chromatinization of transcriptionally active regions of HCMV genomes.


Conflict of interest statement

The authors declare no competing interests.

Figures

Fig. 1
Fig. 1. Reproducibility of Pol II and H3K4me3 DFF-ChIP.
a Diagram of the DFF-ChIP method. Nuclei isolated from uncrosslinked cells in the presence of EDTA are digested with DFF and lightly sonicated to release soluble DNA complexes. The complexes are then immunoprecipitated, library prepped, and sequenced. b, c Genome browser tracks of Pol II DFF-ChIP (purple) and H3K4me3 DFF-ChIP (orange) from HeLa and MRC5 GFP-Pol II cells generated in two different experiments (Exp1 and Exp2). HS denotes that samples were washed with high salt. Browser tracks of Flavo NasCap PRO-Seq (black/gray) show transcription data. d Correlation plots of datasets from Exp1 and Exp2. Reads in 10,000 bp windows centered on the MaxTSS of 12,229 HFF truQuant promoters were summed and plotted against sums from other datasets. Pearson correlations (r) are provided.
Fig. 2
Fig. 2. Representative genome browser tracks of H3K4me3 and Pol II DFF-ChIP from Infected HFFs.
a, b Genome browser tracks of PRO-Seq, Pol II DFF-ChIP, and H3K4me3 DFF-ChIP from HFFs 48 hpi (Exp3) on the hg38 and TB40/E genomes. c, d Genome browser tracks of PRO-Seq, Pol II DFF-ChIP, and H3K4me3 DFF-ChIP (Exp3) showing the GAPDH promoter in 5000 and 1000 bp windows. A dotted line denotes the MaxTSS. Genome browser tracks of PRO-Seq, Pol II DFF-ChIP, and H3K4me3 DFF-ChIP (Exp 3) of the TB40/E genome showing an early (e) and a late (f) promoter in 1000 bp windows. A dotted line denotes the MaxTSS.
Fig. 3
Fig. 3. Visualizing and quantifying transcription complexes and chromatin utilizing fragMaps.
a Length distribution of fragments contained in the region ±1000 bp of the MaxTSS of 12,229 HFF truQuant promoters for Pol II and H3K4me3 DFF-ChIP datasets (Exp4). b Fragment count of selected ranges of fragments from the Pol II DFF-ChIP (Exp4) positioned across the 2000 bp region centered on the MaxTSS of 12,229 HFF truQuant promoters. The three curves were normalized by making the area under the curves equal. c fragMaps of H3K4me3 and Pol II (Exp4) for the 12,229 HFF truQuant promoters showing 18–400 bp fragments that are positioned ±1000 bp around the MaxTSS. A zoomed fragMap showing 18–120 bp fragments that are positioned ±100 bp around the MaxTSS is also shown (right). d fragMaps of H3K4me3 and Pol II (Exp4) for the 1461 TB40/E TSRs found on the HCMV genome showing fragments from 18–400 bp that are positioned ±1000 bp around the MaxTSS. A zoomed fragMap showing 18–120 bp fragments that are positioned ±100 bp around the MaxTSS is also shown (right). The resulting H3K4me3 HCMV fragMap was lightened to aid in visualization. e Quantification of percentage of the free Pol II feature signal relative to total paused Pol II (free + abutted) on both the host and TB40/E genomes using Exp4 data on a promoter by promoter basis sorted from highest to lowest free Pol II (Left). Fragment count of the Nuc1 feature from the H3K4me3 dataset (Exp4) on host (middle) and TB40/E (right) genomes sorted by percentage of the free Pol II feature relative to total paused Pol II (free + abutted) on a promoter by promoter basis from highest to lowest free Pol II as is shown in the graph on the left.
Fig. 4
Fig. 4. Detection and characterization of TBP-driven PICs and UL87-driven viral PICs.
a, b fragMaps of Pol II, Pol II + triptolide (Trp), TBP, and Ser5P datasets (Exp4) for the 12,229 truQuant HFF promoters showing 18–120 bp fragments positioned ±100 bp around the MaxTSS. HCMV (TB40/E) fragMaps were generated from 1461 TB40/E TSRs. A dotted line denotes the TSS. c fragMaps of TBP (Exp4) for the 12,229 truQuant showing 18–400 bp fragments positioned ±1000 bp around the MaxTSS. The HCMV (TB40/E) fragMap was generated from 1461 TB40/E TSRs. d UL87 fragMaps (Exp4) were generated from 1456 Towne TSRs. Fragment lengths and positions depicted are the same as in a and b. A dotted line denotes the TSS. e Logos generated with MEME Suite 5.3.1 from the top 10% promoters/TSRs with the most fragments present in the TBP PIC or UL87 PIC feature as detected by DFF-ChIP. Parameters were: ZOOPS, search only given strand, 1 motif, 6 bp motif. Fractions represent the number of sequences matching the sequence motif out of the number of input sequences. E values for the three Logos were: TBP host, 1.5e−398; TBP HCMV, 3.6e−038; UL87 HCMV, 1.4e−082.
Fig. 5
Fig. 5. Timing of promoter usage during HCMV infection is related to the ratio of UL87 and TBP PICs.
a PRO-Seq tracks depicting 5′ ends of reads from HCMV infection time course including 4, 12, 24, 48 and 72 hpi datasets in 1400 and 800 bp regions of the viral genome. Below are corresponding DFF-ChIP tracks from Exp4 and fragMaps of the same region. b Quantification of the relative usage of TBP and UL87. The amount of TBP PIC feature counted from the TBP dataset was normalized to the amount of UL87 PIC feature counted from the UL87 dataset for all 1461 TB40/ETSRs (Exp4). The ratio of UL87 PIC to TBP PIC was used to sort the TSRs by TBP PIC dominance and then plotted. c FragMaps for the top 5% TBP and UL87 dominated (b) TSRs utilizing 18–120 bp sized fragments positioned ±100 bp around the TSSs. Top TBP TSRs are depicted using TBP and Ser5P (Exp4) datasets whereas UL87 TSRs are depicted using UL87 and Pol II (Exp4) datasets. d A set of 795 TSRs with greater than 100 MaxTSS 5′ ends (±5 bp) when all time points are summed were selected and sorted based on PFA sensitivity, slope, or UL87/TBP. Each TSR had each time point value normalized to library size and each TSR was colored independently. The time point with the highest relative transcription was colored orange and lowest colored blue.
Fig. 6
Fig. 6. Analysis of TBP and UL87 PICs on the HCMV genome.
a Genome browser tracks from all fragment sizes for H3K4me3, TBP, and UL87 datasets and for the 140–160 bp fragments from H3K4me3 (all Exp4) compared directly to fragMaps of the same region of the HCMV genome. The H3K4me3 fragMap depict fragments between 18–400 bp whereas TBP and UL87 fragMaps depict fragments between 18–150 bp. b Normalized metaplot of H3K4me3 signal around the MaxTSS of 12,229 HFF truQuant promoters and 1461 TB40/E TSRs. The inner graph shows the HCMV metaplot with a different Y-axis (Exp4). c Normalized metaplot of H3K4me3 signal around the top 10% of HCMV TSRs determined by amount of TBP PIC feature or UL87 PIC feature (Exp4).
Fig. 7
Fig. 7. FragMaps resulting from different extents of DFF digestion.
a, b Total fragment distributions from Pol II, TBP, and H3K4me3 datasets from the standard digestion condition (Exp4) and the excess digestion condition (Exp5). c, d fragMaps of Pol II, H3K4me3, and TBP showing 18–400 bp fragments positioned ±1000 bp around the MaxTSS of 12,229 truQuant promoters with either (c) standard (Exp4) or (d) excess digestion (Exp5). Exp5 datasets are each a combination of two replicas (n = 2).

Similar articles

Cited by

References

    1. Compe E, Egly JM. The long road to understanding RNAPII transcription initiation and related syndromes. Annu. Rev. Biochem. 2021;90:193–219. doi: 10.1146/annurev-biochem-090220-112253. - DOI - PubMed
    1. Patel AB, Greber BJ, Nogales E. Recent insights into the structure of TFIID, its assembly, and its binding to core promoter. Curr. Opin. Struct. Biol. 2020;61:17–24. doi: 10.1016/j.sbi.2019.10.001. - DOI - PMC - PubMed
    1. Weber CM, Ramachandran S, Henikoff S. Nucleosomes are context-specific, H2A.Z-modulated barriers to RNA polymerase. Mol. Cell. 2014;53:819–830. doi: 10.1016/j.molcel.2014.02.014. - DOI - PubMed
    1. Santos-Rosa H, et al. Active genes are tri-methylated at K4 of histone H3. Nature. 2002;419:407–411. doi: 10.1038/nature01080. - DOI - PubMed
    1. Howe FS, Fischl H, Murray SC, Mellor J. Is H3K4me3 instructive for transcription activation? Bioessays. 2017;39:1–12. doi: 10.1002/bies.201600095. - DOI - PubMed

Publication types