Glucocorticoid-induced loss of beneficial gut bacterial extracellular vesicles is associated with the pathogenesis of osteonecrosis
- PMID: 35417243
- PMCID: PMC9007505
- DOI: 10.1126/sciadv.abg8335
Glucocorticoid-induced loss of beneficial gut bacterial extracellular vesicles is associated with the pathogenesis of osteonecrosis
Abstract
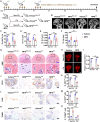
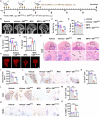
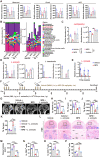
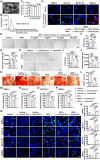
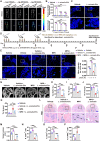
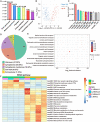
Osteonecrosis of the femoral head (ONFH) commonly occurs after glucocorticoid (GC) therapy. The gut microbiota (GM) participates in regulating host health, and its composition can be altered by GC. Here, this study demonstrates that cohousing with healthy mice or colonization with GM from normal mice attenuates GC-induced ONFH. 16S rRNA gene sequencing shows that cohousing with healthy mice rescues the GC-induced reduction of gut Lactobacillus animalis. Oral supplementation of L. animalis mitigates GC-induced ONFH by increasing angiogenesis, augmenting osteogenesis, and reducing cell apoptosis. Extracellular vesicles from L. animalis (L. animalis-EVs) contain abundant functional proteins and can enter the femoral head to exert proangiogenic, pro-osteogenic, and antiapoptotic effects, while its abundance is reduced after exposure to GC. Our study suggests that the GM is involved in protecting the femoral head by transferring bacterial EVs, and that loss of L. animalis and its EVs is associated with the development of GC-induced ONFH.
Figures
Similar articles
-
Extracellular vesicles from human urine-derived stem cells inhibit glucocorticoid-induced osteonecrosis of the femoral head by transporting and releasing pro-angiogenic DMBT1 and anti-apoptotic TIMP1.Acta Biomater. 2020 Jul 15;111:208-220. doi: 10.1016/j.actbio.2020.05.020. Epub 2020 May 22. Acta Biomater. 2020. PMID: 32447063
-
PTEN inhibitor VO-OHpic attenuates GC-associated endothelial progenitor cell dysfunction and osteonecrosis of the femoral head via activating Nrf2 signaling and inhibiting mitochondrial apoptosis pathway.Stem Cell Res Ther. 2020 Mar 30;11(1):140. doi: 10.1186/s13287-020-01658-y. Stem Cell Res Ther. 2020. PMID: 32228695 Free PMC article.
-
Exosomes derived from human CD34+ stem cells transfected with miR-26a prevent glucocorticoid-induced osteonecrosis of the femoral head by promoting angiogenesis and osteogenesis.Stem Cell Res Ther. 2019 Nov 15;10(1):321. doi: 10.1186/s13287-019-1426-3. Stem Cell Res Ther. 2019. PMID: 31730486 Free PMC article.
-
Potential roles of extracellular vesicles in osteonecrosis of femoral head: A systematic review.Gene. 2021 Mar 10;772:145379. doi: 10.1016/j.gene.2020.145379. Epub 2020 Dec 30. Gene. 2021. PMID: 33359121 Review.
-
Glucocorticoids affect the metabolism of bone marrow stromal cells and lead to osteonecrosis of the femoral head: a review.Chin Med J (Engl). 2012 Jan;125(1):134-9. Chin Med J (Engl). 2012. PMID: 22340480 Review.
Cited by
-
Altered gut microbe metabolites in patients with alcohol‑induced osteonecrosis of the femoral head: An integrated omics analysis.Exp Ther Med. 2024 Jun 5;28(2):311. doi: 10.3892/etm.2024.12599. eCollection 2024 Aug. Exp Ther Med. 2024. PMID: 38873043 Free PMC article.
-
F. prausnitzii-derived extracellular vesicles attenuate experimental colitis by regulating intestinal homeostasis in mice.Microb Cell Fact. 2023 Nov 15;22(1):235. doi: 10.1186/s12934-023-02243-7. Microb Cell Fact. 2023. PMID: 37968625 Free PMC article.
-
Extracellular Vesicles of Probiotics: Shedding Light on the Biological Activity and Future Applications.Pharmaceutics. 2023 Feb 4;15(2):522. doi: 10.3390/pharmaceutics15020522. Pharmaceutics. 2023. PMID: 36839844 Free PMC article. Review.
-
Inhibition of sympathetic tone via hypothalamic descending pathway propagates glucocorticoid-induced endothelial impairment and osteonecrosis of the femoral head.Bone Res. 2024 Nov 8;12(1):64. doi: 10.1038/s41413-024-00371-3. Bone Res. 2024. PMID: 39516484 Free PMC article.
-
Extracellular vesicles derived from host and gut microbiota as promising nanocarriers for targeted therapy in osteoporosis and osteoarthritis.Front Pharmacol. 2023 Jan 6;13:1051134. doi: 10.3389/fphar.2022.1051134. eCollection 2022. Front Pharmacol. 2023. PMID: 36686680 Free PMC article. Review.
References
-
- Chen C. Y., Du W., Rao S. S., Tan Y. J., Hu X. K., Luo M. J., Ou Q. F., Wu P. F., Qing L. M., Cao Z. M., Yin H., Yue T., Zhan C. H., Huang J., Zhang Y., Liu Y. W., Wang Z. X., Liu Z. Z., Cao J., Liu J. H., Hong C. G., He Z. H., Yang J. X., Tang S. Y., Tang J. Y., Xie H., Extracellular vesicles from human urine-derived stem cells inhibit glucocorticoid-induced osteonecrosis of the femoral head by transporting and releasing pro-angiogenic DMBT1 and anti-apoptotic TIMP1. Acta Biomater. 111, 208–220 (2020). - PubMed
-
- Zaidi M., Sun L., Robinson L. J., Tourkova I. L., Liu L., Wang Y., Zhu L. L., Liu X., Li J., Peng Y., Yang G., Shi X., Levine A., Iqbal J., Yaroslavskiy B. B., Isales C., Blair H. C., ACTH protects against glucocorticoid-induced osteonecrosis of bone. Proc. Natl. Acad. Sci. U.S.A. 107, 8782–8787 (2010). - PMC - PubMed
-
- Yao X., Yu S., Jing X., Guo J., Sun K., Guo F., Ye Y., PTEN inhibitor VO-OHpic attenuates GC-associated endothelial progenitor cell dysfunction and osteonecrosis of the femoral head via activating Nrf2 signaling and inhibiting mitochondrial apoptosis pathway. Stem Cell Res Ther 11, 140 (2020). - PMC - PubMed
MeSH terms
Substances
LinkOut - more resources
Full Text Sources
Medical
Miscellaneous

