

Protein-Protein Binding Free Energy Predictions with the MM/PBSA Approach Complemented with the Gaussian-Based Method for Entropy Estimation
- PMID: 35415339
- PMCID: PMC8991903
- DOI: 10.1021/acsomega.1c07037
Protein-Protein Binding Free Energy Predictions with the MM/PBSA Approach Complemented with the Gaussian-Based Method for Entropy Estimation
Abstract
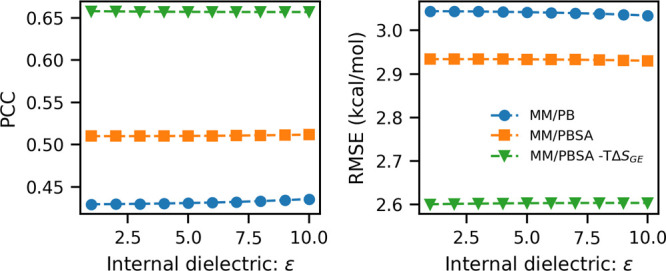
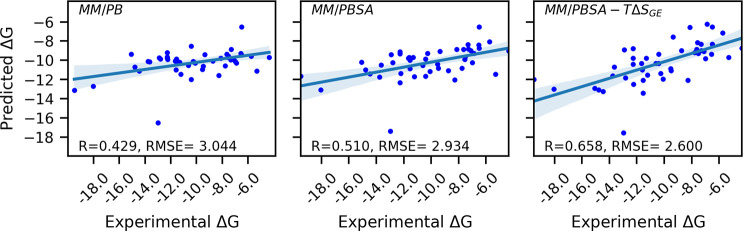
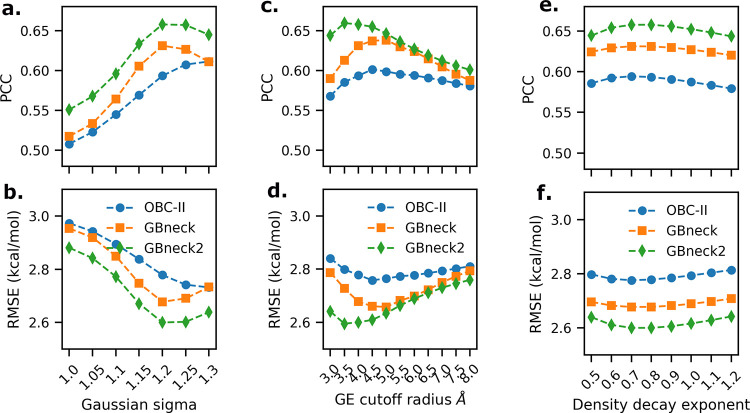
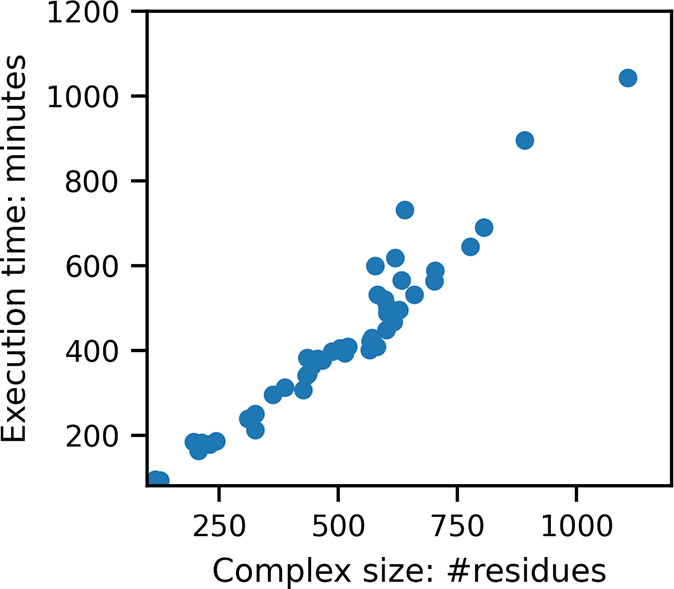
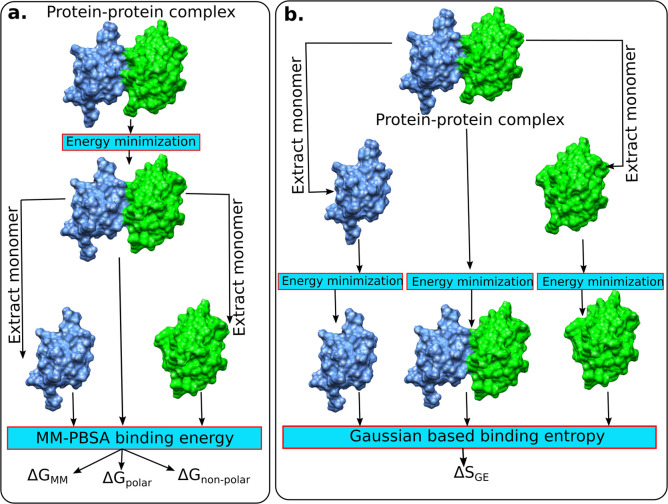
Here, we present a Gaussian-based method for estimation of protein-protein binding entropy to augment the molecular mechanics Poisson-Boltzmann surface area (MM/PBSA) method for computational prediction of binding free energy (ΔG). The method is termed f5-MM/PBSA/E, where "E" stands for entropy and f5 for five adjustable parameters. The enthalpy components of ΔG (molecular mechanics, polar and non-polar solvation energies) are computed from a single implicit solvent generalized Born (GB) energy minimized structure of a protein-protein complex, while the binding entropy is computed using independently GB energy minimized unbound and bound structures. It should be emphasized that the f5-MM/PBSA/E method does not use snapshots, just energy minimized structures, and is thus very fast and computationally efficient. The method is trained and benchmarked in 5-fold validation test over a data set consisting of 46 protein-protein binding cases with experimentally determined dissociation constant K d values. This data set has been used for benchmarking in recently published protein-protein binding studies that apply conventional MM/PBSA and MM/PBSA with an enhanced sampling method. The f5-MM/PBSA/E tested on the same data set achieves similar or better performance than these computationally demanding approaches, making it an excellent choice for high throughput protein-protein binding affinity prediction studies.
© 2022 The Authors. Published by American Chemical Society.
Conflict of interest statement
The authors declare no competing financial interest.
Figures
Similar articles
-
A head-to-head comparison of MM/PBSA and MM/GBSA in predicting binding affinities for the CB1 cannabinoid ligands.J Mol Model. 2024 Oct 31;30(11):390. doi: 10.1007/s00894-024-06189-4. J Mol Model. 2024. PMID: 39480515
-
Validation of an automated procedure for the prediction of relative free energies of binding on a set of aldose reductase inhibitors.Bioorg Med Chem. 2007 Dec 15;15(24):7865-77. doi: 10.1016/j.bmc.2007.08.019. Epub 2007 Aug 22. Bioorg Med Chem. 2007. PMID: 17870536
-
Assessing the performance of the MM/PBSA and MM/GBSA methods. 1. The accuracy of binding free energy calculations based on molecular dynamics simulations.J Chem Inf Model. 2011 Jan 24;51(1):69-82. doi: 10.1021/ci100275a. Epub 2010 Nov 30. J Chem Inf Model. 2011. PMID: 21117705 Free PMC article.
-
Development and test of highly accurate endpoint free energy methods. 1: Evaluation of ABCG2 charge model on solvation free energy prediction and optimization of atom radii suitable for more accurate solvation free energy prediction by the PBSA method.J Comput Chem. 2023 May 30;44(14):1334-1346. doi: 10.1002/jcc.27089. Epub 2023 Feb 21. J Comput Chem. 2023. PMID: 36807356 Review.
-
The MM/PBSA and MM/GBSA methods to estimate ligand-binding affinities.Expert Opin Drug Discov. 2015 May;10(5):449-61. doi: 10.1517/17460441.2015.1032936. Epub 2015 Apr 2. Expert Opin Drug Discov. 2015. PMID: 25835573 Free PMC article. Review.
Cited by
-
Systematic investigation of machine learning on limited data: A study on predicting protein-protein binding strength.Comput Struct Biotechnol J. 2023 Dec 20;23:460-472. doi: 10.1016/j.csbj.2023.12.018. eCollection 2024 Dec. Comput Struct Biotechnol J. 2023. PMID: 38235359 Free PMC article.
-
Machine learning methods for protein-protein binding affinity prediction in protein design.Front Bioinform. 2022 Dec 16;2:1065703. doi: 10.3389/fbinf.2022.1065703. eCollection 2022. Front Bioinform. 2022. PMID: 36591334 Free PMC article.
-
Calculation of protein-ligand binding entropies using a rule-based molecular fingerprint.Biophys J. 2024 Sep 3;123(17):2839-2848. doi: 10.1016/j.bpj.2024.03.017. Epub 2024 Mar 13. Biophys J. 2024. PMID: 38481102
-
Comprehensive evaluation of end-point free energy techniques in carboxylated-pillar[6]arene host-guest binding: II. regression and dielectric constant.J Comput Aided Mol Des. 2022 Dec;36(12):879-894. doi: 10.1007/s10822-022-00487-w. Epub 2022 Nov 17. J Comput Aided Mol Des. 2022. PMID: 36394776
-
Exploring the conformational dynamics and key amino acids in the CD26-caveolin-1 interaction and potential therapeutic interventions.Medicine (Baltimore). 2024 May 31;103(22):e38367. doi: 10.1097/MD.0000000000038367. Medicine (Baltimore). 2024. PMID: 39259075 Free PMC article.
References
Grants and funding
LinkOut - more resources
Full Text Sources
Miscellaneous
