

Every road leads to Rome: therapeutic effect and mechanism of the extracellular vesicles of human embryonic stem cell-derived immune and matrix regulatory cells administered to mouse models of pulmonary fibrosis through different routes
- PMID: 35413874
- PMCID: PMC9006546
- DOI: 10.1186/s13287-022-02839-7
Every road leads to Rome: therapeutic effect and mechanism of the extracellular vesicles of human embryonic stem cell-derived immune and matrix regulatory cells administered to mouse models of pulmonary fibrosis through different routes
Abstract
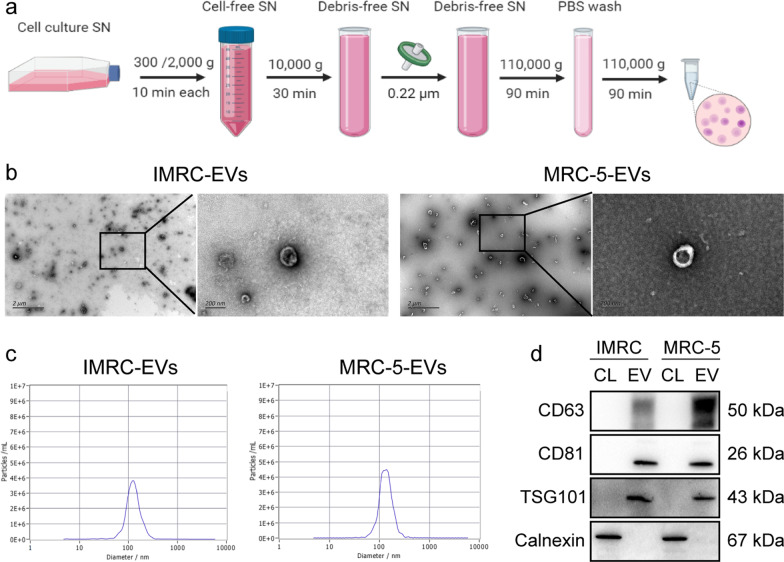
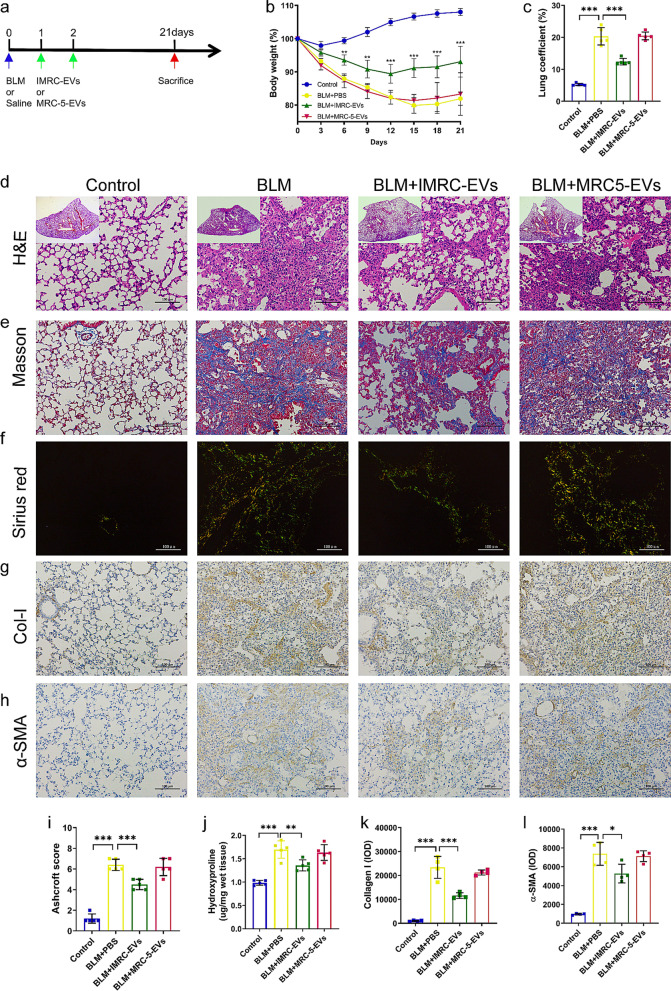
Background: Idiopathic pulmonary fibrosis (IPF) is a progressive and fatal interstitial lung disease. Whether extracellular vesicles are effective in treating IPF and what is the optimal administrative route is not clear. Our previous studies have shown that immunity and matrix regulatory cells (IMRCs) derived from human embryonic stem cells can safely treat lung injury and fibrosis in mouse models, and its mechanism of action is related to the paracrine effect. In this study, we investigated the therapeutic effects of IMRC-derived extracellular vesicles (IMRC-EVs) on a bleomycin-induced pulmonary fibrosis mouse model and explored the optimal route of administration.
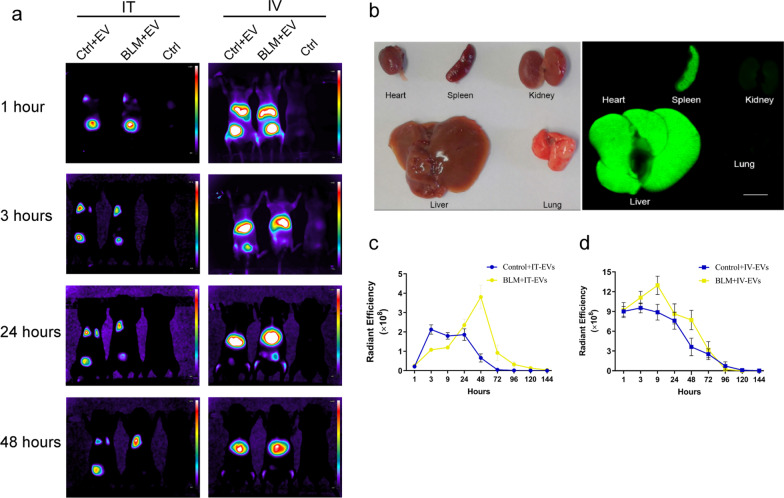
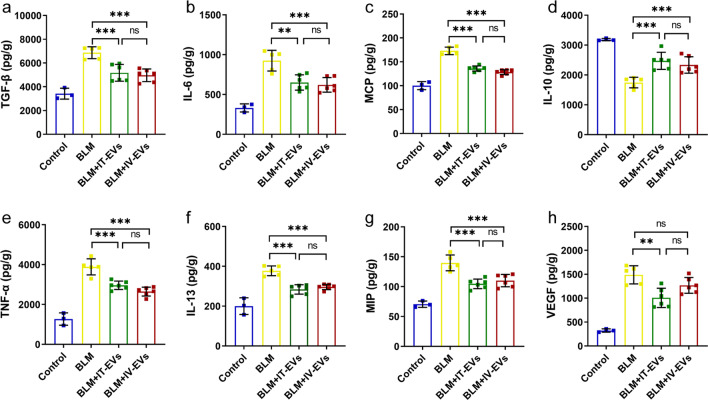
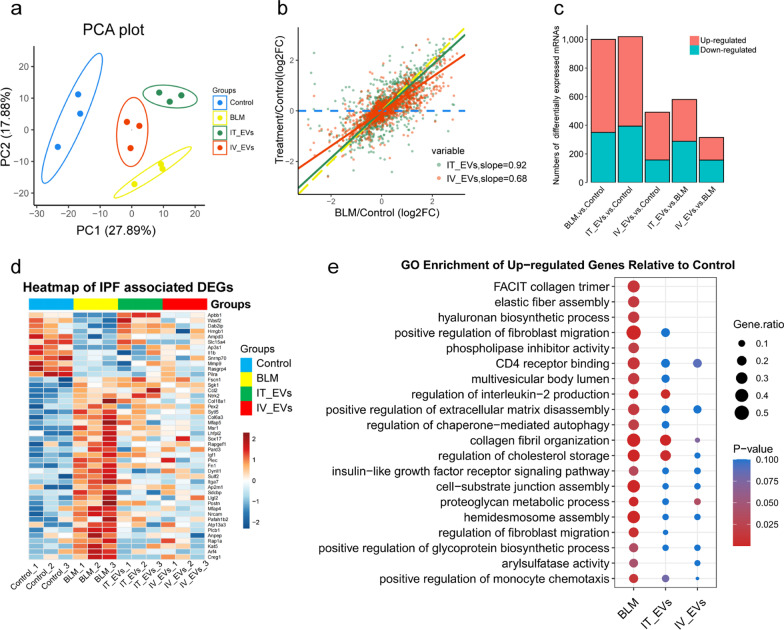
Methods: To study the biodistribution of IMRC-EVs after administration via different routes, NIR labeled-IMRC-EVs were delivered by intratracheal (IT) or intravenous (IV) route, and in vivo imaging was acquired at different time points. The therapeutic effects of IMRC-EVs delivered by different routes were analyzed by assessing histology, lung function, cytokines levels, and transcriptome profiling. RNA-seq of lung tissues was performed to investigate the mechanisms of EV treatment through IT or IV administrations.
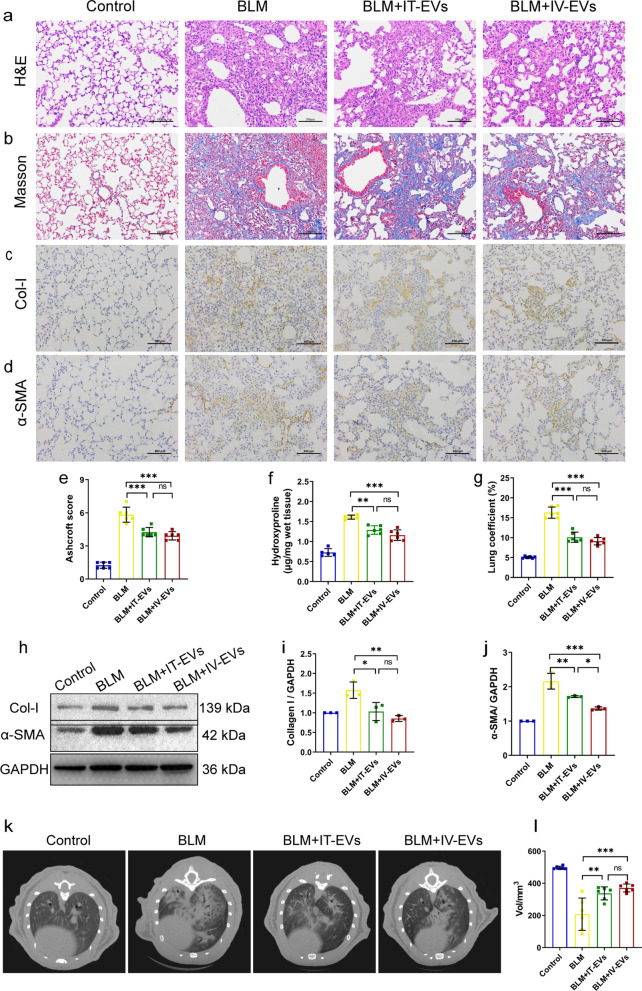
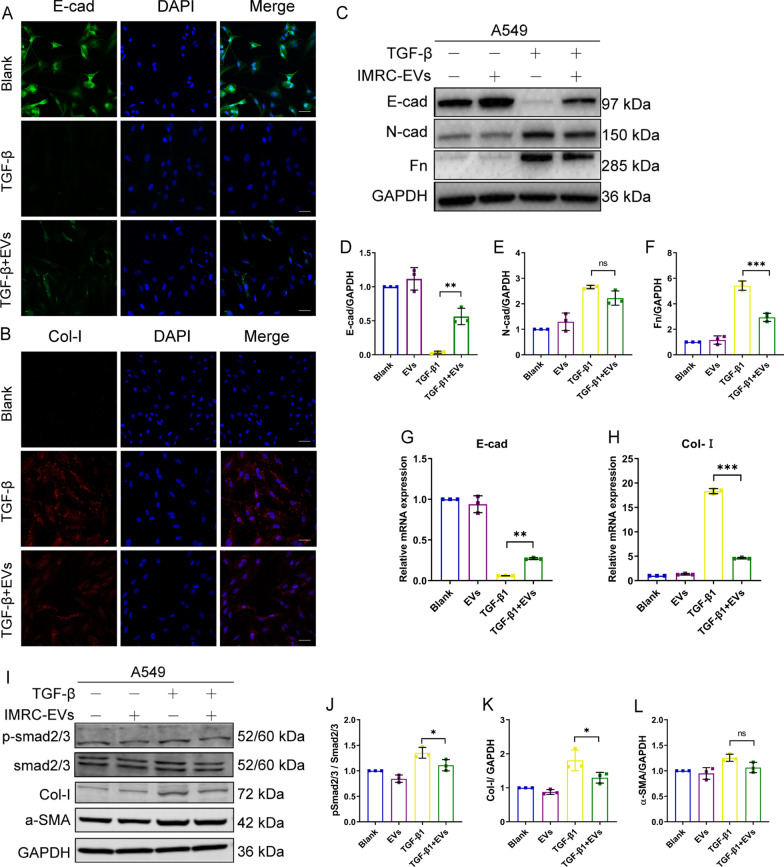
Results: IMRC-EVs mainly reserved in the liver and spleen when administrated via IV route; and mainly retained in the lungs via the IT route. IMRC-EVs administrated via both routes demonstrated a therapeutic effect as attenuated pulmonary fibrosis, improved lung function, and histological parameters. Based on our RNA-seq results, different pathways may be affected by IMRC-EVs administrated via IT or IV routes. In addition, in vitro experiments showed that IMRC-EVs inhibited epithelial-to-mesenchymal transition induced by TGF-β.
Conclusion: IMRC-EVs administrated via IT or IV routes generate different biodistributions, but are both effective for the treatment of bleomycin-induced pulmonary fibrosis. The therapeutic mechanisms of IMRC-EVs administrated via different routes may be different.
Keywords: Biodistribution; Extracellular vesicles; Human embryonic stem cells; IMRC; Mesenchymal stem cells; Pulmonary fibrosis; Route of administration.
© 2022. The Author(s).
Conflict of interest statement
The authors declare that they have no competing interests.
Figures
Similar articles
-
Mesenchymal Stem Cell-Derived Extracellular Vesicles as Idiopathic Pulmonary Fibrosis Microenvironment Targeted Delivery.Cells. 2022 Jul 28;11(15):2322. doi: 10.3390/cells11152322. Cells. 2022. PMID: 35954166 Free PMC article. Review.
-
Optimized administration of human embryonic stem cell-derived immunity-and-matrix regulatory cells for mouse lung injury and fibrosis.Stem Cell Res Ther. 2024 Oct 8;15(1):344. doi: 10.1186/s13287-024-03945-4. Stem Cell Res Ther. 2024. PMID: 39380037 Free PMC article.
-
Mesenchymal stem cell-derived extracellular vesicles suppress the fibroblast proliferation by downregulating FZD6 expression in fibroblasts via micrRNA-29b-3p in idiopathic pulmonary fibrosis.J Cell Physiol. 2020 Nov;235(11):8613-8625. doi: 10.1002/jcp.29706. Epub 2020 Jun 17. J Cell Physiol. 2020. PMID: 32557673
-
Human bronchial epithelial cell-derived extracellular vesicle therapy for pulmonary fibrosis via inhibition of TGF-β-WNT crosstalk.J Extracell Vesicles. 2021 Aug;10(10):e12124. doi: 10.1002/jev2.12124. Epub 2021 Aug 2. J Extracell Vesicles. 2021. PMID: 34377373 Free PMC article.
-
Role of Mesenchymal Stem Cells and Extracellular Vesicles in Idiopathic Pulmonary Fibrosis.Int J Mol Sci. 2022 Sep 23;23(19):11212. doi: 10.3390/ijms231911212. Int J Mol Sci. 2022. PMID: 36232511 Free PMC article. Review.
Cited by
-
Mesenchymal Stem Cell-Derived Extracellular Vesicles as Idiopathic Pulmonary Fibrosis Microenvironment Targeted Delivery.Cells. 2022 Jul 28;11(15):2322. doi: 10.3390/cells11152322. Cells. 2022. PMID: 35954166 Free PMC article. Review.
-
Progress in understanding and treating idiopathic pulmonary fibrosis: recent insights and emerging therapies.Front Pharmacol. 2023 Aug 7;14:1205948. doi: 10.3389/fphar.2023.1205948. eCollection 2023. Front Pharmacol. 2023. PMID: 37608885 Free PMC article. Review.
-
The Emerging Role of Extracellular Vesicles from Mesenchymal Stem Cells and Macrophages in Pulmonary Fibrosis: Insights into miRNA Delivery.Pharmaceuticals (Basel). 2022 Oct 17;15(10):1276. doi: 10.3390/ph15101276. Pharmaceuticals (Basel). 2022. PMID: 36297388 Free PMC article. Review.
-
Secretome of hESC-Derived MSC-like Immune and Matrix Regulatory Cells Mitigate Pulmonary Fibrosis through Antioxidant and Anti-Inflammatory Effects.Biomedicines. 2023 Feb 5;11(2):463. doi: 10.3390/biomedicines11020463. Biomedicines. 2023. PMID: 36830999 Free PMC article.
-
Mesenchymal Stem Cells-Derived Exosomes Alleviate Acute Lung Injury by Inhibiting Alveolar Macrophage Pyroptosis.Stem Cells Transl Med. 2024 Apr 15;13(4):371-386. doi: 10.1093/stcltm/szad094. Stem Cells Transl Med. 2024. PMID: 38349749 Free PMC article.
References
Publication types
MeSH terms
Substances
LinkOut - more resources
Full Text Sources
Miscellaneous
