Computational drug repurposing against SARS-CoV-2 reveals plasma membrane cholesterol depletion as key factor of antiviral drug activity
- PMID: 35404937
- PMCID: PMC9022874
- DOI: 10.1371/journal.pcbi.1010021
Computational drug repurposing against SARS-CoV-2 reveals plasma membrane cholesterol depletion as key factor of antiviral drug activity
Abstract
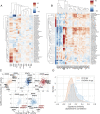
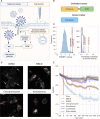
Comparing SARS-CoV-2 infection-induced gene expression signatures to drug treatment-induced gene expression signatures is a promising bioinformatic tool to repurpose existing drugs against SARS-CoV-2. The general hypothesis of signature-based drug repurposing is that drugs with inverse similarity to a disease signature can reverse disease phenotype and thus be effective against it. However, in the case of viral infection diseases, like SARS-CoV-2, infected cells also activate adaptive, antiviral pathways, so that the relationship between effective drug and disease signature can be more ambiguous. To address this question, we analysed gene expression data from in vitro SARS-CoV-2 infected cell lines, and gene expression signatures of drugs showing anti-SARS-CoV-2 activity. Our extensive functional genomic analysis showed that both infection and treatment with in vitro effective drugs leads to activation of antiviral pathways like NFkB and JAK-STAT. Based on the similarity-and not inverse similarity-between drug and infection-induced gene expression signatures, we were able to predict the in vitro antiviral activity of drugs. We also identified SREBF1/2, key regulators of lipid metabolising enzymes, as the most activated transcription factors by several in vitro effective antiviral drugs. Using a fluorescently labeled cholesterol sensor, we showed that these drugs decrease the cholesterol levels of plasma-membrane. Supplementing drug-treated cells with cholesterol reversed the in vitro antiviral effect, suggesting the depleting plasma-membrane cholesterol plays a key role in virus inhibitory mechanism. Our results can help to more effectively repurpose approved drugs against SARS-CoV-2, and also highlights key mechanisms behind their antiviral effect.
Conflict of interest statement
I have read the journal’s policy and the authors of this manuscript have the following competing interests: JSR reports funding from GSK and Sanofi and fees from Travere Therapeutics and Astex. BS is a full time employee of Turbine Ltd., Budapest, Hungary.
Figures


Similar articles
-
Cysteamine with In Vitro Antiviral Activity and Immunomodulatory Effects Has the Potential to Be a Repurposing Drug Candidate for COVID-19 Therapy.Cells. 2021 Dec 24;11(1):52. doi: 10.3390/cells11010052. Cells. 2021. PMID: 35011614 Free PMC article.
-
Drug repurposing for COVID-19 based on an integrative meta-analysis of SARS-CoV-2 induced gene signature in human airway epithelium.PLoS One. 2021 Sep 28;16(9):e0257784. doi: 10.1371/journal.pone.0257784. eCollection 2021. PLoS One. 2021. PMID: 34582497 Free PMC article.
-
Network analysis and molecular mapping for SARS-CoV-2 to reveal drug targets and repurposing of clinically developed drugs.Virology. 2021 Mar;555:10-18. doi: 10.1016/j.virol.2020.12.006. Epub 2020 Dec 30. Virology. 2021. PMID: 33421743 Free PMC article.
-
Repurposing functional inhibitors of acid sphingomyelinase (fiasmas): an opportunity against SARS-CoV-2 infection?J Clin Pharm Ther. 2021 Oct;46(5):1213-1219. doi: 10.1111/jcpt.13390. Epub 2021 Mar 1. J Clin Pharm Ther. 2021. PMID: 33645763 Free PMC article. Review.
-
Efficacy of repurposed antiviral drugs: Lessons from COVID-19.Drug Discov Today. 2022 Jul;27(7):1954-1960. doi: 10.1016/j.drudis.2022.02.012. Epub 2022 Feb 19. Drug Discov Today. 2022. PMID: 35192924 Free PMC article. Review.
Cited by
-
Ganoderma microsporum immunomodulatory protein acts as a multifunctional broad-spectrum antiviral against SARS-CoV-2 by interfering virus binding to the host cells and spike-mediated cell fusion.Biomed Pharmacother. 2022 Nov;155:113766. doi: 10.1016/j.biopha.2022.113766. Epub 2022 Sep 28. Biomed Pharmacother. 2022. PMID: 36271550 Free PMC article.
-
Exploring the inhibitory potential of the antiarrhythmic drug amiodarone against Clostridioides difficile toxins TcdA and TcdB.Gut Microbes. 2023 Dec;15(2):2256695. doi: 10.1080/19490976.2023.2256695. Epub 2023 Sep 25. Gut Microbes. 2023. PMID: 37749884 Free PMC article.
-
DRaW: prediction of COVID-19 antivirals by deep learning-an objection on using matrix factorization.BMC Bioinformatics. 2023 Feb 15;24(1):52. doi: 10.1186/s12859-023-05181-8. BMC Bioinformatics. 2023. PMID: 36793010 Free PMC article.
-
Microbead-based extracorporeal immuno-affinity virus capture: a feasibility study to address the SARS-CoV-2 pandemic.Mikrochim Acta. 2023 Feb 18;190(3):95. doi: 10.1007/s00604-023-05671-9. Mikrochim Acta. 2023. PMID: 36808576 Free PMC article.
-
The antiarrhythmic drugs amiodarone and dronedarone inhibit intoxication of cells with pertussis toxin.Naunyn Schmiedebergs Arch Pharmacol. 2024 Dec;397(12):9991-10003. doi: 10.1007/s00210-024-03247-9. Epub 2024 Jul 3. Naunyn Schmiedebergs Arch Pharmacol. 2024. PMID: 38958734 Free PMC article.
References
Publication types
MeSH terms
Substances
Grants and funding
LinkOut - more resources
Full Text Sources
Miscellaneous

