. 2022 Mar 3;2(2):263-278.
doi: 10.21873/cdp.10104. eCollection 2022 Mar-Apr.

Pan-cancer Bioinformatics Analysis of the Double-edged Role of Hypoxia-inducible Factor 1α (HIF-1α) in Human Cancer

Affiliations

Pan-cancer Bioinformatics Analysis of the Double-edged Role of Hypoxia-inducible Factor 1α (HIF-1α) in Human Cancer

R U Li et al. Cancer Diagn Progn. .

Abstract

Background/aim: Despite the emergence of cellular, animal, and clinical-based evidence demonstrating a link between hypoxia-inducible factor-1α (HIF-1α) and malignancy, the comprehensive assessment of HIF-1α in pan-cancer patients remains unclear, particularly regarding HIF-1α expression and its association with immune infiltration and immune checkpoint. The present study aimed to investigate the role of HIF-1α expression in various types of malignancies through bioinformatics analysis.

Materials and methods: We investigated the expression and prognostic value of HIF-1α in pan-cancer based on the TCGA (The Cancer Genome Atlas) dataset. The abundance of immune infiltration was estimated by xCell immune deconvolution methods. We investigated the relationship of HIF-1α expression with immune infiltration and immune checkpoint gene expression, with a focus on gastric adenocarcinoma (STAD) and lung squamous cell carcinoma (LUSC).

Results: HIF-1α expression had different effects on the prognosis of various cancers. In contrast to the protective effect of HIF-1α expression in LUSC, high levels of HIF-1α expression played a detrimental role in the survival of STAD patients. There was a significant positive correlation between HIF-1α expression and immune infiltration in STAD patients, including regulatory T-cells (Tregs), T-cell CD4+ Th2, neutrophils, M1 and M2 macrophages. In addition, immune checkpoint molecules showed different HIF-1α-related profiles in various carcinomas.

Conclusion: A relatively comprehensive view of the oncogenic role of HIF-1α in various tumors based on a pan-cancer analysis is provided in this study. HIF-1α may be considered a poor prognostic biomarker for STAD and, moreover, it may be involved in regulating tumor immune infiltration.

Keywords: HIF-1α; Hypoxia; cancer prognosis; immune checkpoint; immune infiltration.


Conflict of interest statement

The Authors declare that they have no competing interests.

Figures

Figure 1
Figure 1. HIF-1α expression levels in human carcinomas based on pan-cancer analysis. The mRNA expression level of HIF-1α in various cancers or certain cancer subtypes was analyzed by TIMER2 based on the TCGA database. *p<0.05, **p<0.01, ***p<0.001 (A). The expression level of HIF1α in indicated cancer tissues and normal tissues (based on TCGA normal and GTEx data) was analyzed by the GEPIA web tool, with the pvalue=0.01 as the cutoff (B). TCGA: The Cancer Genome Atlas; GTEx: genotype-tissue expression project.
Figure 2
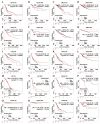
Figure 2. Correlation between HIF-1α expression and survival prognosis of cancers based on Kaplan-Meier Plotter database. Overall survival (OS) and relapse-free survival (RFS) Kaplan–Meier curves analyses by HIF-1α gene expression were supplied in bladder urothelial carcinoma (BLCA) (A, B), breast invasive carcinoma (BRCA) (C, D), cervical squamous cell carcinoma and endocervical adenocarcinoma (CESC) (E, F), kidney renal clear cell carcinoma (KIRC) (G, H), liver hepatocellular carcinoma (LIHC) (I, J), lung squamous cell carcinoma (LUSC) (K, L), ovarian serous cystadenocarcinoma (OV) (M, N), pancreatic adenocarcinoma (PAAD) (O, P), pheochromocytoma and paraganglioma (PCPG) (Q, R), stomach adenocarcinoma (STAD) (S, T). Hazard ratio (HR) with 95% confidence interval (CI) and p-value from the log-rank test are shown in the curve.
Figure 3
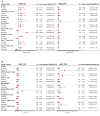
Figure 3. Association of HIF-1α mRNA expression level with OS (n=592) and PFS (n=358) in stomach adenocarcinoma with multifaceted clinicopathological characteristics. Red squares represent the hazard ratios (HR); the horizontal dotted line indicates the corresponding 95% confidence intervals (CIs). OS, Overall survival; PFS, progression-free survival. *p<0.05; **p<0.01. ***p<0.001.
Figure 4
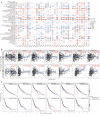
Figure 4. Correlation of HIF-1α expression with different immune infiltration levels in human carcinomas. Spearman correlation analysis heat map of multiple immune infiltrations and HIF-1α gene expression across diverse tumor tissues, where the horizontal axis represents different tumor tissues, the vertical axis represents different immune scores based on xCell algorithm, different colors represent correlation coefficients; negative values represent negative correlations, positive values represent positive correlation. The larger the correlation coefficient, the darker the color, *p<0.05, **p<0.01, ***p<0.001 (A). Different correlations between HIF-1α expression and the level of immune infiltration in stomach adenocarcinoma (STAD) or lung squamous cell carcinoma (LUSC) (B). Kaplan-Meier survival curve of multiple immune infiltrations in stomach adenocarcinoma (STAD) or lung squamous cell carcinoma (LUSC) (C).
Figure 5
Figure 5. HIF-1α associated with immune infiltration predicted survival prognosis in STAD and LUSC based on the Kaplan-Meier plotter database. OS and PFS survival analysis of HIF-1α expression combined with immune cell (B-cells, CD4+ memory T-cells, CD8+ T-cells, macrophages, natural killer T-cells, regulatory T-cells, type 1 T-helper cells, type 2 T-helper cells) infiltration level in STAD patients (A). OS and PFS survival analysis of HIF-1α expression combined with immune cell (B-cells, CD4+ memory T-cells, CD8+ T-cells, macrophages, natural killer T-cells, regulatory T-cells, type 1 T-helper cells, type 2 T-helper cells) infiltration level in LUSC patients (B). Red squares represent the hazard ratios (HR); horizontal dotted line indicates the corresponding 95% confidence intervals (CIs). STAD, stomach adenocarcinoma; OS, overall survival; PFS, progression-free survival. *p<0.05; **p<0.01; ***p<0.001.
Figure 6
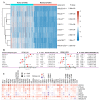
Figure 6. The correlation between HIF-1α expression and levels of immune checkpoint, TMB, and MSI gene expression. (A) Comparison of expression levels of immune checkpoint genes, including SIGLEC15, TIGIT, CD274, HAVCR2, PDCD1, CTLA4, LAG3, and PDCD1LG2 in STAD tumor (n=375) and normal tissues (n=391). (B) Kaplan Meier survival analysis of OS and PFS based on the immune checkpoint gene expression levels in STAD patients. (C) The relationship between HIF-1α expression and level of immune checkpoint genes across multiple human cancers based on TIMER2 database. Spearman correlation analysis of TMB (D), MSI (E) and HIF-1α gene expression. The horizontal axis in the figure represents the correlation coefficient between HIF-1α expression and TMB, MSI level, the ordinate is different tumor types, the size of the dot in the figure represents the value of the correlation coefficient, and the different colors represent the significance of the p-value (blue color represents small p-value). *p<0.05; **p<0.05; ***p<0.001. TMB, Tumor mutational burden; MSI, microsatellite instability; STAD, stomach adenocarcinoma; OS, overall survival; PFS, progression-free survival.

Similar articles

References

    1. Taylor CT, Pouyssegur J. Oxygen, hypoxia, and stress. Ann NY Acad Sci. 2007;1113:87–94. doi: 10.1196/annals.1391.004. - DOI - PubMed
    1. Wigerup C, Påhlman S, Bexell D. Therapeutic targeting of hypoxia and hypoxia-inducible factors in cancer. Pharmacol Ther. 2016;164:152–169. doi: 10.1016/j.pharmthera.2016.04.009. - DOI - PubMed
    1. Schito L, Semenza GL. Hypoxia-inducible factors: master regulators of cancer progression. Trends Cancer. 2016;2(12):758–770. doi: 10.1016/j.trecan.2016.10.016. - DOI - PubMed
    1. Jing X, Yang F, Shao C, Wei K, Xie M, Shen H, Shu Y. Role of hypoxia in cancer therapy by regulating the tumor microenvironment. Mol Cancer. 2019;18(1):157. doi: 10.1186/s12943-019-1089-9. - DOI - PMC - PubMed
    1. Majmundar AJ, Wong WJ, Simon MC. Hypoxia-inducible factors and the response to hypoxic stress. Mol Cell. 2010;40(2):294–309. doi: 10.1016/j.molcel.2010.09.022. - DOI - PMC - PubMed

LinkOut - more resources