rDNA array length is a major determinant of replicative lifespan in budding yeast
- PMID: 35394872
- PMCID: PMC9169770
- DOI: 10.1073/pnas.2119593119
rDNA array length is a major determinant of replicative lifespan in budding yeast
Abstract
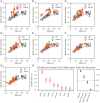
The complex processes and interactions that regulate aging and determine lifespan are not fully defined for any organism. Here, taking advantage of recent technological advances in studying aging in budding yeast, we discovered a previously unappreciated relationship between the number of copies of the ribosomal RNA gene present in its chromosomal array and replicative lifespan (RLS). Specifically, the chromosomal ribosomal DNA (rDNA) copy number (rDNA CN) positively correlated with RLS and this interaction explained over 70% of variability in RLS among a series of wild-type strains. In strains with low rDNA CN, SIR2 expression was attenuated and extrachromosomal rDNA circle (ERC) accumulation was increased, leading to shorter lifespan. Suppressing ERC formation by deletion of FOB1 eliminated the relationship between rDNA CN and RLS. These data suggest that previously identified rDNA CN regulatory mechanisms limit lifespan. Importantly, the RLSs of reported lifespan-enhancing mutations were significantly impacted by rDNA CN, suggesting that changes in rDNA CN might explain the magnitude of some of those reported effects. We propose that because rDNA CN is modulated by environmental, genetic, and stochastic factors, considering rDNA CN is a prerequisite for accurate interpretation of lifespan data.
Keywords: Saccharomyces cerevisiae; aging; machine learning; microfluidics; ribosomal DNA.
Conflict of interest statement
Competing interest statement: M.H., N.H.T., D.G.H., E.L.S., J.X., and D.E.G. are employees of Calico Life Sciences LLC. The work presented here is not of commercial value to Calico, but rather a contribution to advancing the study of yeast aging.
Figures


Similar articles
-
Changed life course upon defective replication of ribosomal RNA genes.Genes Genet Syst. 2023 Apr 18;97(6):285-295. doi: 10.1266/ggs.22-00100. Epub 2023 Mar 2. Genes Genet Syst. 2023. PMID: 36858512
-
Depletion of Limiting rDNA Structural Complexes Triggers Chromosomal Instability and Replicative Aging of Saccharomyces cerevisiae.Genetics. 2019 May;212(1):75-91. doi: 10.1534/genetics.119.302047. Epub 2019 Mar 6. Genetics. 2019. PMID: 30842210 Free PMC article.
-
A natural polymorphism in rDNA replication origins links origin activation with calorie restriction and lifespan.PLoS Genet. 2013;9(3):e1003329. doi: 10.1371/journal.pgen.1003329. Epub 2013 Mar 7. PLoS Genet. 2013. PMID: 23505383 Free PMC article.
-
The yeast replicative aging model.Biochim Biophys Acta Mol Basis Dis. 2018 Sep;1864(9 Pt A):2690-2696. doi: 10.1016/j.bbadis.2018.02.023. Epub 2018 Mar 8. Biochim Biophys Acta Mol Basis Dis. 2018. PMID: 29524633 Review.
-
Ribosomal DNA instability: An evolutionary conserved fuel for inflammaging.Ageing Res Rev. 2020 Mar;58:101018. doi: 10.1016/j.arr.2020.101018. Epub 2020 Jan 9. Ageing Res Rev. 2020. PMID: 31926964 Review.
Cited by
-
Dietary change without caloric restriction maintains a youthful profile in ageing yeast.PLoS Biol. 2023 Aug 29;21(8):e3002245. doi: 10.1371/journal.pbio.3002245. eCollection 2023 Aug. PLoS Biol. 2023. PMID: 37643155 Free PMC article.
-
Genomic Instability and Epigenetic Changes during Aging.Int J Mol Sci. 2023 Sep 19;24(18):14279. doi: 10.3390/ijms241814279. Int J Mol Sci. 2023. PMID: 37762580 Free PMC article. Review.
-
The long and short of rDNA and yeast replicative aging.Proc Natl Acad Sci U S A. 2022 Jun 7;119(23):e2205124119. doi: 10.1073/pnas.2205124119. Epub 2022 Jun 3. Proc Natl Acad Sci U S A. 2022. PMID: 35658078 Free PMC article. No abstract available.
-
The de novo design and synthesis of yeast chromosome XIII facilitates investigations on aging.Nat Commun. 2024 Nov 22;15(1):10139. doi: 10.1038/s41467-024-54130-3. Nat Commun. 2024. PMID: 39578428 Free PMC article.
-
Varying strength of selection contributes to the intragenomic diversity of rRNA genes.Nat Commun. 2022 Nov 25;13(1):7245. doi: 10.1038/s41467-022-34989-w. Nat Commun. 2022. PMID: 36434003 Free PMC article.
References
-
- Thayer N. H., et al. ., The yeast lifespan machine: A microfluidic platform for automated replicative lifespan measurements. bioRxiv [Preprint] (2022). https://www.biorxiv.org/content/10.1101/2022.02.14.480146v1 (Accessed 15 February 2022). - DOI
MeSH terms
Substances
LinkOut - more resources
Full Text Sources
Molecular Biology Databases

