. 2022 May 15;33(6):ar50.
doi: 10.1091/mbc.E21-11-0589. Epub 2022 Apr 7.

Load adaptation by endocytic actin networks

Affiliations

Load adaptation by endocytic actin networks

Charlotte Kaplan et al. Mol Biol Cell. .

Abstract

Clathrin-mediated endocytosis (CME) robustness under elevated membrane tension is maintained by actin assembly-mediated force generation. However, whether more actin assembles at endocytic sites in response to increased load has not previously been investigated. Here actin network ultrastructure at CME sites was examined under low and high membrane tension. Actin and N-WASP spatial organization indicate that actin polymerization initiates at the base of clathrin-coated pits and that the network then grows away from the plasma membrane. Actin network height at individual CME sites was not coupled to coat shape, raising the possibility that local differences in mechanical load feed back on assembly. By manipulating membrane tension and Arp2/3 complex activity, we tested the hypothesis that actin assembly at CME sites increases in response to elevated load. Indeed, in response to elevated membrane tension, actin grew higher, resulting in greater coverage of the clathrin coat, and CME slowed. When membrane tension was elevated and the Arp2/3 complex was inhibited, shallow clathrin-coated pits accumulated, indicating that this adaptive mechanism is especially crucial for coat curvature generation. We propose that actin assembly increases in response to increased load to ensure CME robustness over a range of plasma membrane tensions.


Figures
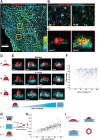
FIGURE 1:
FIGURE 1:
2c-3D STORM resolves clathrin structures highly connected to actin networks at different stages of endocytosis. (A) STORM image of the ventral surface of an SK-MEL-2 cell immunolabeled with the CF-680 antibody (clathrin coats in red) and phalloidin-AF647 (actin in cyan). Orange squares are areas shown in panel B. Color bar shows the z position of actin. Scale bar: 5 µm. (B) Magnification of highlighted areas 1 and 2 in panel A. Magenta squares are shown in panel C. Scale bars: 250 nm. (C) X-Z projections of the regions highlighted in panel B. Scale bars: 100 nm. (D) Illustration of binning clathrin coats (red) into three geometric stages based on their aspect ratio (shape index SI). Shallow: SI < 0.7; U-shape: 0.7 < SI > 0.9 and Ω: SI > 0.9. (E) X-Z projections of representative STORM images showing clathrin coats (red) with different actin (cyan) coverages around clathrin. Calculated SI of shallow CCSs from left to right image: 0.56, 0.53, 0.51, 0.55; for U-shaped CCPs from left image to right image: 0.87, 0.89, 0.86, 0.82; for Ω-shaped CCPs from left image to right image: 1.31, 1.06, 1.31, 1.52. Scale bars: 100 nm. (F) Graph of endocytic coat SI as a function of actin coverage for shallow (black dots), U-shaped (blue dots), and Ω-shaped (gray dots) pits. Categories of shape indices are chosen similar to E. Pits with actin coverage >5% are shown. R = –0.04, n = 719. Events accumulated from six cells. (G) Cartoon depicting the clathrin coat with actin either at the tip of the coat (top), covering the clathrin coat completely (middle), or at the base of the clathrin coat (bottom). Dashed black lines indicate the average Z position of actin and clathrin. Dz is the difference between average actin and clathrin Z positions. Dz < 0 is defined as the average actin Z position nearer the base of the pit. Schematic is a hypothetical plot of Dz vs. actin coverage for scenarios in which actin grows from the tip of the coat (red line) or the base of the pit (black line). (H) Dz as a function of actin coverage (for actin coverage >5%, R = 0.66, n = 719, N = 6 cells). (I) Cartoon of actin (blue) growing from the base of the pit (black lines) to cover clathrin coat (red) from a shallow membrane invagination to a fully formed membrane vesicle. X-Z projection (side profile) is shown. Dashed arrows indicate that growth of the actin network is not tightly coupled to the endocytic coat geometry and is variable in extent.
FIGURE 2:
FIGURE 2:
Quantitative analysis of CME mechanosensitivity under elevated membrane tension. (A) Schematic of cells in isotonic media (top) or hypotonic media (bottom), which causes water influx and stretches the cell membrane. In this figure, hypotonic treatment is 75 mOsm. (B) Mean membrane tether force values measured by AFM of cells in isotonic media (n = 18) or in hypotonic media (n = 17). Mean values were obtained by pulling at least three tethers (three independent experiments). In hypotonic treatment, circles are mean tether values from 2 to 10 min after hypotonic media exchange and triangles are mean tether values obtained between 10 and 16 min after hypotonic media exchange. Bars are mean ± SD. p = 0.002 by two-tailed Mann–Whitney test. (C) Kymographs of TIRF micrographs of live SK-MEL-2 cells endogenously expressing CLTA-TagRFP-TEN (magenta) and DNM2-eGFPEN (green). Time is on the X axis. Kymographs are 4.8 min long. Cells were imaged in isotonic media (top) or hypotonic media for 2 min (middle) or 10 min (bottom). (D) Cumulative distribution plot of clathrin lifetimes marked by CLTA-TagRFP-TEN in isotonic media (red), hypotonic media for 2 min (violet), and hypotonic media for 10 min (orange). These tracks were associated with DNM2-eGFPEN. (E) Cumulative distribution plot of dynamin2 lifetime marked by DNM2-eGFPEN in isotonic media (light green), hypotonic media for 2 min (blue), and hypotonic media for 10 min (dark green). These tracks were associated with CLTA-TagRFP-TEN. n = 5831 tracks in 17 cells across four experiments for D–H. (D, E) Detailed statistics in Supplemental Table S1. (F) Plot of endocytic initiation rate for the three conditions. p < 0.05 by two-tailed Mann–Whitney test for both comparisons. (G) Endocytic completion rate in the three conditions. p < 0.05 by two-tailed Mann–Whitney for both comparisons. (H) Percentage of persistent tracks (defined as tracks lasting the entirety of the image acquisition) for the three conditions. p < 0.05 by two-tailed Mann–Whitney for both comparisons. (F–H) Barplots show mean ± SD. Statistics to plots in Supplemental Figure S7H.
FIGURE 3:
FIGURE 3:
Importance of Arp2/3 complex–mediated actin polymerization during CME increases under elevated membrane tension. In this figure, CK666 (Arp2/3 complex inhibitor) treatment is 100 µM and hypotonic shock is 150 mOsm. (A) Kymographs of cells expressing CLTA-TagRFP-TEN (magenta) and DNM2-eGFPEN (green) imaged by TIRF. Cells were imaged in isotonic media. The media was then exchanged to include CK666 (bottom panel) and imaged after 4 min. (B) Cumulative distribution plots of clathrin lifetimes in control, DMSO-treated conditions (orange, n = 4219), and CK666-treated (red, n = 3124) conditions. (C) Cumulative distribution plots for control, DMSO-treated (dark green, n = 4219), and CK666-treated (light green, n = 3124) dynamin2 lifetimes associated with clathrin lifetimes in B. (BC) Control, N = 10 cells, and CK666 treatment, N = 10 cells, measured in three independent experiments. Complete statistics in Supplemental Table S3. (D) Kymographs of cells in hypotonic media. In the top panel, cells were placed in hypotonic media and imaged after 4 min. In the bottom panel, cells were treated with CK666 in hypotonic media and imaged after 4 min. (E) Cumulative distribution plots of clathrin lifetimes for control, DMSO-treated conditions (magenta, n = 1405), and CK666-treated conditions (blue, n = 2783) in hypotonic media. (F) Cumulative distribution plots of DMSO-treated (black, n = 1405) and CK666-treated (olive, n = 2783) dynamin2 lifetimes in hypotonic media associated with clathrin lifetimes in E. (E, F) Control, N = 9 cells, and CK666 treatment, N = 10 cells, measured in three independent experiments. Complete statistics in Supplemental Table S3. (G) Representative STORM images of immunolabeled clathrin-coated structures in control cells arranged by coat height. Top panel shows the x-y projections and bottom panel the corresponding x-z projections. The white square in the x-y projections shows the area that was cropped to generate the x-z projections. The heights of clathrin coats in the x-y projection from left to right image are 61, 96, 124, 158, and 177 nm. Scale bars: 100 nm. (H) Clathrin coat heights when cells were treated with DMSO (n = 154) or CK666 (n = 158) in isotonic media or CK666 in hypotonic media (n = 159). Clathrin coat images for quantitative analysis were collected from at least three different cells for each condition from a single experiment. Statistics are given in Supplemental Figure S8F. p < 0.05 in both comparisons by Mann–Whitney test.
FIGURE 4:
FIGURE 4:
The actin network at CME sites increases in size in response to elevated membrane tension. In this figure, hypotonic refers to 75 mOsm media. (A) Schematic of cells in hypotonic media, which increases plasma membrane tension. The response of the actin network (blue) to elevated plasma membrane tension (purple) was previously unknown. (B) Representative STORM images of clathrin (red) and actin (cyan) in x-z projections for cells fixed after treatment in the hypotonic media for 5 min (bottom). Coated pits are classified as shallow, U-shaped, or Ω-shaped based on the aspect ratio of the coat. Scale bars: 100 nm. (C) Plots of actin Z height at CCPs from cells in the isotonic (n = 736) and hypotonic (n = 527) media measured from STORM x-z projections. Lines are median ± interquartile range. p < 0.0001 determined by Mann–Whitney test. (D) Plots of actin coverage over the clathrin coat in pits found in STORM x-z projection images in isotonic (n = 719) and hypotonic (n = 509) conditions. Pits with actin coverage >1% are plotted. Lines are median ± interquartile range. p < 0.0001 determined by Mann–Whitney test. (E) Actin Z height as a function of coat shape in isotonic (gray, n = 736) and hypotonic (purple, n = 527) conditions. (F) Actin Z height as a function of actin coverage over the clathrin coat in isotonic (gray, n = 719) and hypotonic (purple, n = 509) conditions. The data for isotonic conditions were also used to generate the plots in Figure 1. Three independent STORM experiments with N_ = 6 cells in isotonic and N_ = 7 cells in hypotonic media. (G) Cartoon depicting an adaptive actin force–generating mechanism that counteracts elevated membrane tension to ensure robust CME progression. This schematic describes three scenarios in which membrane tension is low, intermediate, or high and how CME is accomplished efficiently by adaptive actin network organization. Under low tension (bottom), the clathrin coat provides sufficient force to advance CME. At intermediate tension (middle), actin polymerization is required for the transition from U to Ω shape. At high tension (top), endocytic progression slows. More pits stall at the shallow conformation. In response to increased resistance, the actin network grows to envelop the coat and provide additional force against high membrane tension.

Similar articles

Cited by

References

    1. Aghamohammadzadeh S, Ayscough KR (2009). Differential requirements for actin during yeast and mammalian endocytosis. Nat Cell Biol 11, 1039–1042. - PMC - PubMed
    1. Akamatsu M, Vasan R, Serwas D, Ferrin MA, Rangamani P, Drubin DG (2020). Principles of self-organization and load adaptation by the actin cytoskeleton during clathrin-mediated endocytosis. eLife 9, e49840. - PMC - PubMed
    1. Almeida-Souza L, Frank RAW, Gracía-Nafría J, Colussi A, Gunawardana N, Johnson CM, Yu M, Howard G, Andrews B, Vallis Y, et al. (2018). A flat BAR protein promotes actin polymerization at the base of clathrin-coated pits. Cell 174, 325–337.e14. - PMC - PubMed
    1. Avinoam O, Schorb M, Beese CJ, Briggs JAG, Kaksonen M (2015). ENDOCYTOSIS. Endocytic sites mature by continuous bending and remodeling of the clathrin coat. Science 348, 1369–1372. - PubMed
    1. Batchelder EM, Yarar D (2010). Differential requirements for clathrin-dependent endocytosis at sites of cell-substrate adhesion. Mol Biol Cell 21, 3070–3079. - PMC - PubMed

Publication types

MeSH terms