. 2022 Apr 6;5(1):320.
doi: 10.1038/s42003-022-03252-9.

Macrophage-derived IGF-1 protects the neonatal intestine against necrotizing enterocolitis by promoting microvascular development

Affiliations

Macrophage-derived IGF-1 protects the neonatal intestine against necrotizing enterocolitis by promoting microvascular development

Xiaocai Yan et al. Commun Biol. .

Abstract

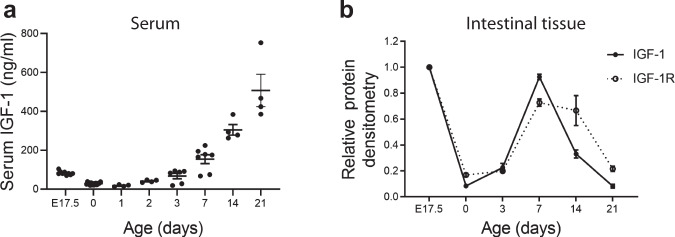
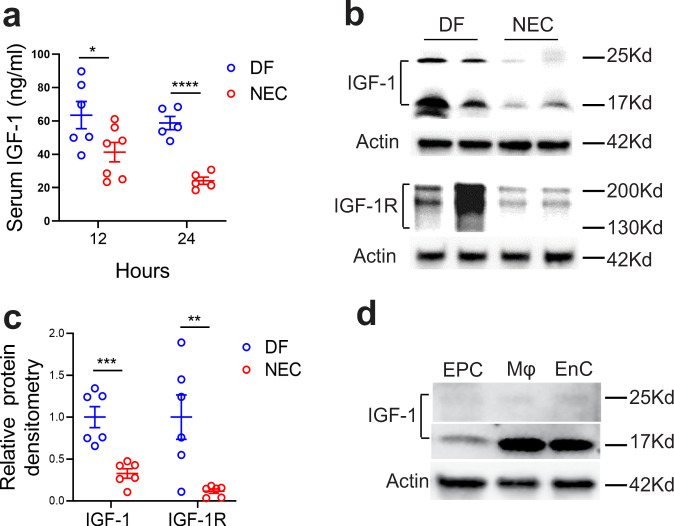
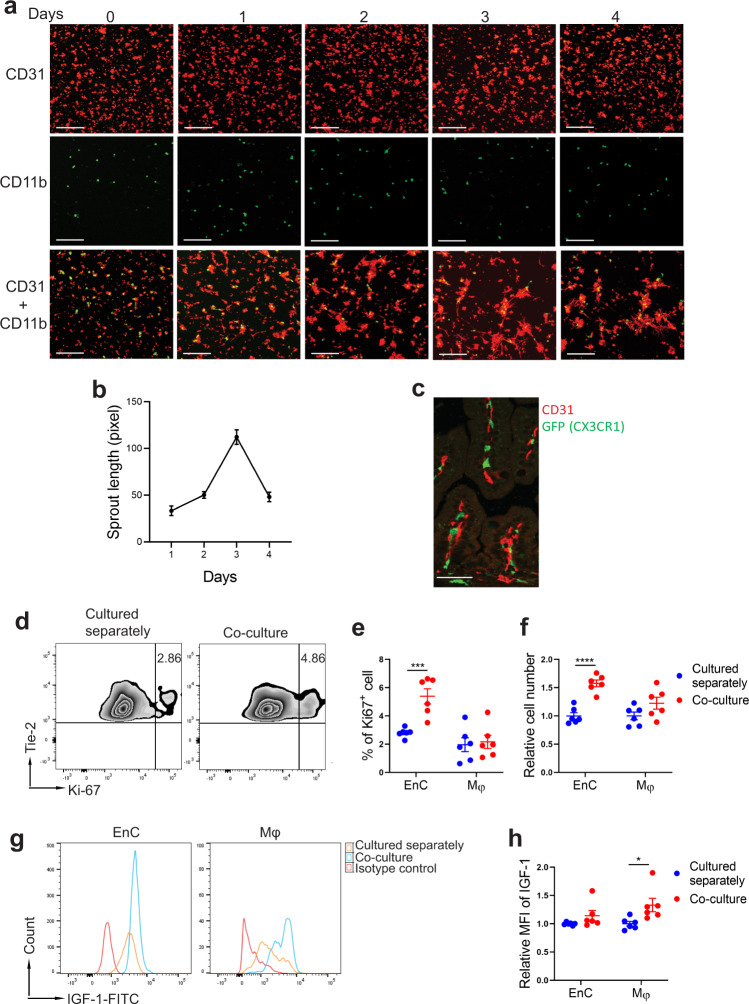
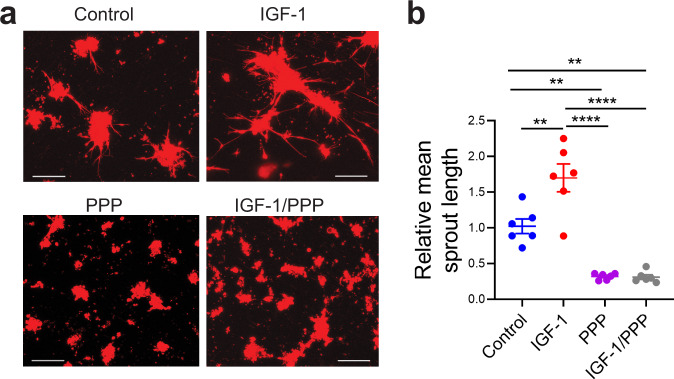
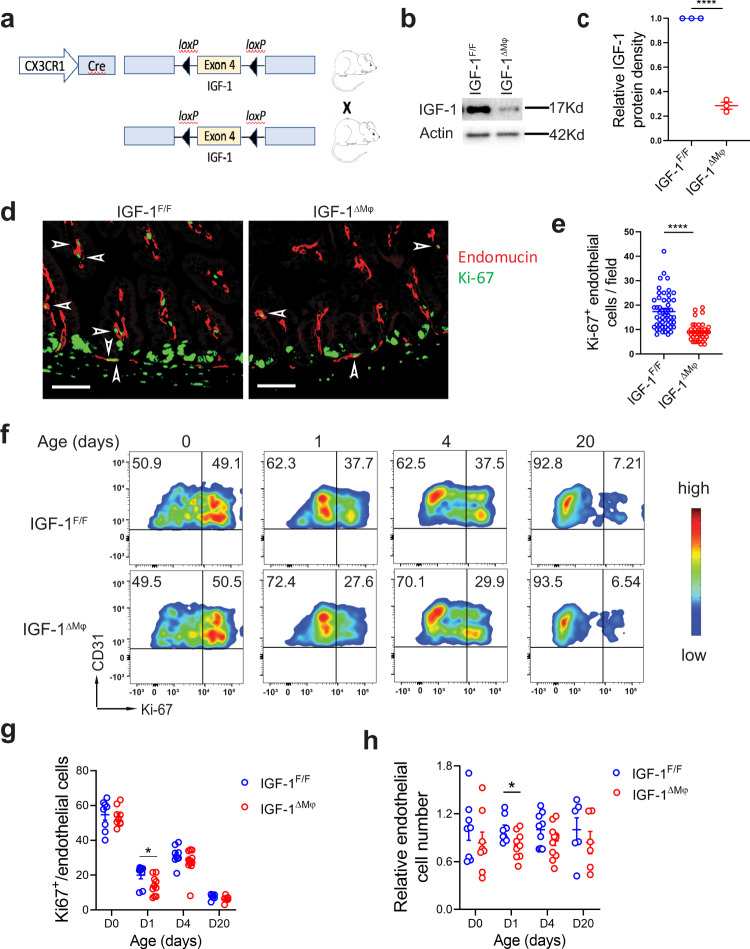
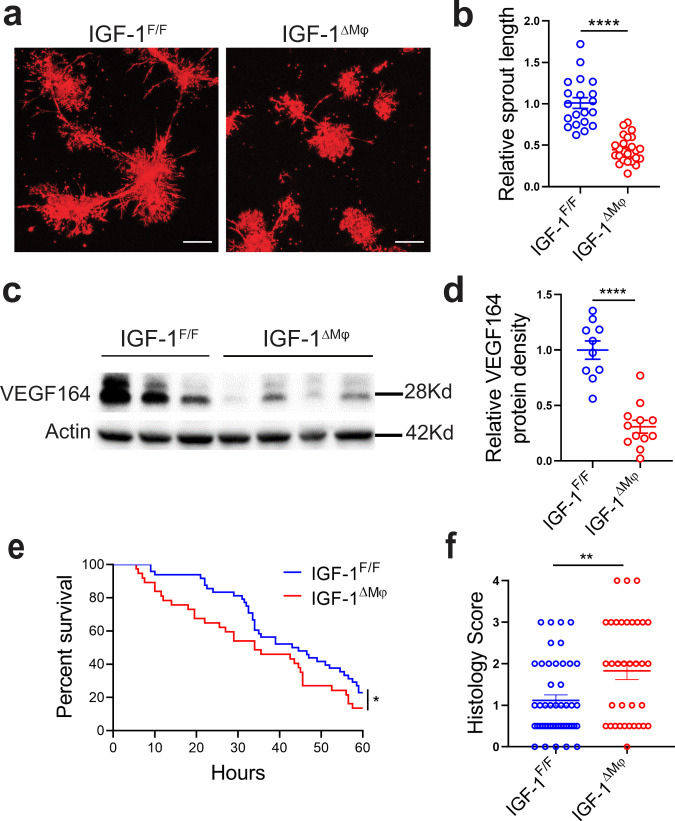
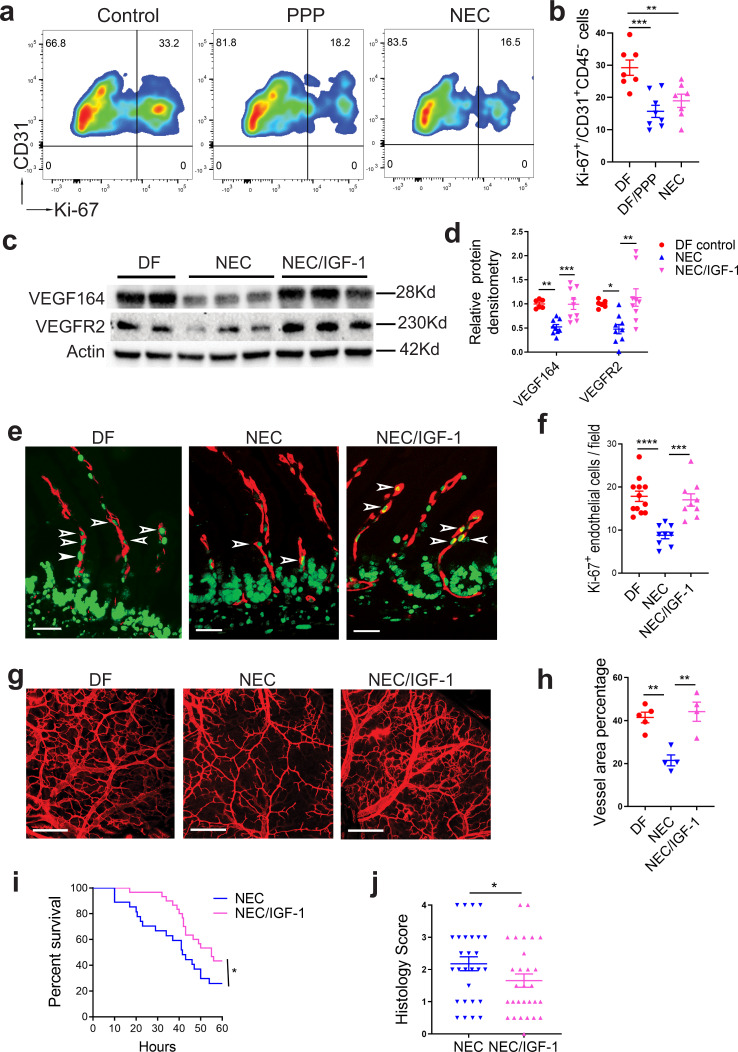
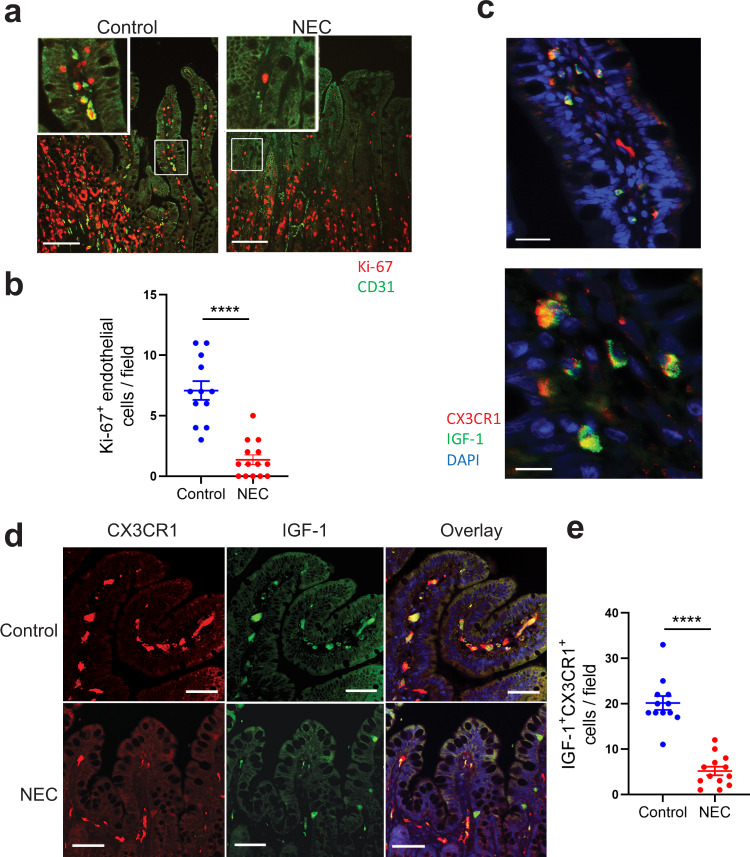
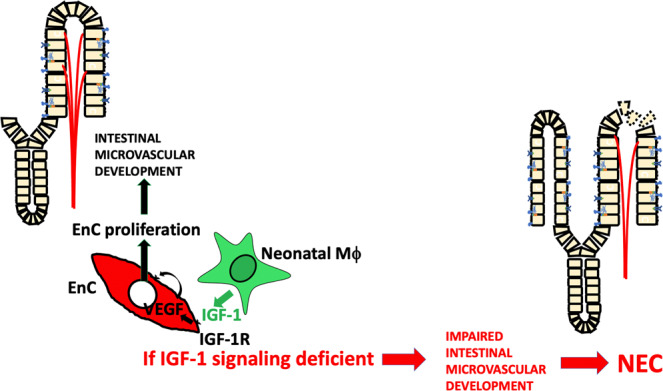
Necrotizing enterocolitis (NEC) is a deadly bowel necrotic disease of premature infants. Low levels of plasma IGF-1 predispose premature infants to NEC. While increasing evidence suggests that defective perinatal intestinal microvascular development plays a role in NEC, the involved mechanism remains incompletely understood. We report here that serum and intestinal IGF-1 are developmentally regulated during the perinatal period in mice and decrease during experimental NEC. Neonatal intestinal macrophages produce IGF-1 and promote endothelial cell sprouting in vitro via IGF-1 signaling. In vivo, in the neonatal intestine, macrophage-derived IGF-1 promotes VEGF expression and endothelial cell proliferation and protects against experimental NEC. Exogenous IGF-1 preserves intestinal microvascular density and protects against experimental NEC. In human NEC tissues, villous endothelial cell proliferation and IGF-1- producing macrophages are decreased compared to controls. Together, our results suggest that defective IGF-1-production by neonatal macrophages impairs neonatal intestinal microvascular development and predisposes the intestine to necrotizing enterocolitis.


Conflict of interest statement

I.D.P. received a grant from Shire Human Genetic Therapies, Inc., a member of the Takeda group of companies, for testing rhIGF-1/BP3 in experimental NEC. X.Y., E.M, Y.Y.Z., and X.D.T. have no competing interests to declare.

Figures

Fig. 1
Fig. 1. Serum and intestinal IGF-1 are developmentally regulated during the perinatal period in mice.
Pups from each litter were randomly assigned to different time-points. Serum and intestinal tissues were collected from mice at embryonic day 17.5 (E17.5), day of life 0, 1, 2, 3, 7, 14, and 21. a IGF-1 serum level was measured by ELISA, n = 4–12/time point (exact n at each time point see dots in the panels and Source Data file.), data represent results of three experiments combined (mean ± SEM). b Intestinal IGF-1 and IGF-1R were examined by western blot analysis. Data represent the results of three experiments. n = 2/time point for every three separate experiments (mean ± SEM). One of the three experiments did not include E17.5 time point. Gel images are included in Source Data file.
Fig. 2
Fig. 2. IGF-1 and IGF-1R expression are decreased prior to experimental NEC.
Day 1 neonatal mice were left with the dam (DF) or submitted to the experimental NEC model. a 12 and 24 h later, their serum was obtained, and IGF-1 level was determined by ELISA. n = 5–7/group (see dots in panels and Source Data file for exact n number). b, c Intestinal tissues were collected from NEC pups 8 h after protocol initiation or from DF controls, and tissue lysates were submitted for western blot analysis to examine IGF-1 and IGF-1R expression. b Typical blots are shown. c Protein densitometry analysis, n = 6/group. Data represent results of three experiments combined (a, c, mean ± SEM) and P values were calculated using multiple t tests (a, c). *p < 0.05, **p < 0.01, ***p < 0.001, ****p < 0.0001. d IGF-1 expression from the intestinal epithelial cells (EPC), macrophages (Mφ), and endothelial cells (EnC) of 24 h-old dam-fed pups were assessed by western blot. Data represent two separate experiments and each experiment includes 9 and 12 intestines pooled, respectively. Source data are provided as a Source Data file.
Fig. 3
Fig. 3. Neonatal intestinal macrophages promote endothelial cell sprouting/proliferation in vitro via IGF-1.
a 4 × 104 intestinal endothelial cells (from mT/mG mice—red) and 2 × 104 CD11b+ intestinal myeloid cells (from CX3CR1-GFP mice—green) were cultured in duplicated wells separately or together in Matrigel and images were taken at day 1–4 of culture. scale bar: 100 μm. b When CD31 and CD11b were cultured together, endothelial cell sprout length per area was assessed over time (mean ± SEM). For each time point, 7–10 sprouts per area were measured. Sprouts were unmeasurable in individually cultured cells. c Small intestinal tissue of a 24 h-old CX3CR1-GFP reporter neonatal dam-fed pup was stained for CD31 (red) and GFP (CX3CR1 -green). Scale bar = 100 μm. dh 5 × 104 intestinal CX3CR1+ macrophages and 10 × 104 endothelial cells cultured separately or together in 24-well plates were collected at 48 h of culture and stained with anti-Tie-2, CX3CR1, Ki-67, IGF-1 antibodies or isotype controls for flow cytometric analysis. d Contour plots showing the percentage of proliferating (Ki-67+) endothelial cells. e Percentage of proliferating (Ki-67+) endothelial cells (Tie-2+ CX3CR1 and macrophages (Tie-2CX3CR1+). f Relative number of macrophages and endothelial cells in co-culture to their respective number when grown separately. g Histogram showing IGF-1 expression of neonatal intestinal endothelial cells and macrophages when cultured separately or together compared to isotype antibody control. h Mean fluorescence intensity of IGF-1 of the two cell populations when cultured separately or together. Data indicate two separate experiments combined (mean ± SEM for e, f, h), n = 6/group (e, f, h). See supplemental Fig. 3 for gating strategy for d and g. P values were calculated using multiple t tests (e, f, h). *p < 0.05, ***p < 0.001, ****p < 0.0001. Source data are provided as a Source Data file.
Fig. 4
Fig. 4. Neonatal intestinal macrophages promote endothelial cell sprouting in vitro via IGF-1.
a, b 4 × 104 mT/mG neonatal intestinal endothelial cells were co-cultured with 2 × 104 CX3CR1+ WT neonatal intestinal macrophages for 4 days on Matrigel in IGF-1-free media (control) or in media containing IGF-1, the IGF-1 inhibitor PPP or both. a Representative images. b Graph represents mean sprout length per well relative to control. Data are the results of three separate experiments combined. n = 6 wells/group, each dot indicates the average length of 5–9 sprouts from a single culture well. P values were calculated using one-way ANOVA followed by Turkey–Kramer multiple-comparison test. **p < 0.01, ****p < 0.0001. Source data are provided as a Source Data file.
Fig. 5
Fig. 5. Mice with IGF-1-deficient macrophages have decreased intestinal endothelial cell proliferation.
a Breeding scheme for generating mice with IGF-1 sufficient and IGF-1-deficient macrophages. b, c IGF-1 protein is decreased in isolated CX3CR1+ cells from pups with IGF-deficient macrophages (Igf-1ΔMϕ) compared with IGF-1-sufficient littermates (Igf-1f/f). For each group and in each experiment, intestines from 8 to 10 pups were pooled together to obtain enough cells for western blot analysis. b Western blot image of one experiment. c The experiment was repeated twice, and band density was quantified (mean ± SEM, n = 3 /group). d, e Tissue sections from 24-hour-old Igf-1ΔMϕ pups (n = 6) or IGF-1-sufficient pups (n = 8) were stained for Ki-67 (green) and endomucin (red). d Typical image is shown, scale bar: 50 μm. e Average proliferating endothelial cells (Ki-67+ endomucin+) per ×20 field in the intestinal villi (see arrows in d) were counted from 3 to 4 field images per sample. Each dot indicates the number from one image. fh Isolated small intestinal LP cells from D0, D1, D4, D20 IGF-1-sufficient or Igf-1ΔMϕ pups were gated on single/live CD31+CD45 cells and analyzed for CD31 and Ki-67. f Typical flow cytometry images are shown. g The graph represents the percentage of proliferating (Ki-67+) endothelial cells at different ages in the intestine of IGF-1-sufficient or Igf-1ΔMϕ pups (mean ± SEM). h Endothelial cell number relative to the isolated total cell number per intestine, which is subsequently normalized to Igf-1f/f group, is shown here (mean ± SEM), n = 6–9/group (g, h, see dots in panels and Source Data file for exact n number). P values were calculated using two-sided Student’s t tests (c, e) or multiple t tests (g, h). *p < 0.05, **p < 0.01, ***p < 0.001, ****p < 0.0001. Source data are provided as a Source Data file.
Fig. 6
Fig. 6. IGF-1-deficient macrophages have decreased proangiogenic properties and Igf-1ΔMϕ mice are more susceptible to experimental NEC.
a, b 4 × 104 intestinal endothelial cells from mT/mG neonatal pups were co-cultured for 4 days on Matrigel with 2 × 104 CX3CR1+ neonatal intestinal macrophages obtained from IGF-1-sufficient (n = 6) or Igf-1ΔMϕ (n = 6) pups. a Typical sprouting images are shown. b Sprout length was measured, each data point indicates the length of a single sprout (mean ± SEM). c, d Intestinal tissue VEGF expression was assessed at D1 (24 h of life) by western blot analysis and relative band density to actin was quantified (mean ± SEM), n = 10 and 12 IGF-1-sufficient or Igf-1ΔMϕ groups, respectively. P values were calculated using two-sided Student’s t tests (b, d). e, f IGF-1-sufficient or Igf-1ΔMϕ pups were submitted to the neonatal NEC model. e Survival curves are shown, n = 48 and 37 in IGF-1-sufficient or Igf-1ΔMϕ groups, respectively, P values were calculated using Gehan–Breslow–Wilcoxon test. f Intestinal histological injury scores are shown, n = 46 and 35 in IGF-1-sufficient or Igf-1ΔMϕ groups, respectively, P values were calculated using Chi-square analysis. All plots are the results of three separated experiments combined. *p < 0.05, **p < 0.01, ****p < 0.0001. Source data are provided as a Source Data file.
Fig. 7
Fig. 7. Blocking IGF-1 signaling decreases intestinal endothelial cell proliferation in vivo; exogenous IGF-1 enhances VEGF protein expression, intestinal endothelial cell proliferation and preserves intestinal microvascular density during experimental NEC.
a, b 24-hour-old wild-type C57BL/6 pups were treated with the IGF-1R inhibitor PPP (n = 8) or vehicle control (n = 7) or submitted to the NEC protocol for 24 h (n = 7). Intestinal LP cells were isolated and the percentage of proliferating endothelial cells (Ki-67+CD31+CD45/CD31+CD45) was determined by flow cytometry. a Typical FACS plots are shown. b Graph represents the results of three experiments combined (mean ± SEM). ch 1-day-old neonatal mice were injected with IGF-1 (25 μg/kg, i.p., twice) or vehicle control, with a first dose 2 h prior to NEC initiation and a second dose 12 h later (Dam-fed littermates as controls) then submitted to experimental NEC for 24 h (cf) or 48 h (g, h). c, d Intestinal tissues were assessed for VEGF and VEGFR2 proteins by western blot (c) and band densitometry is shown (d, mean ± SEM), n = 6–9/group (see panel or Source Data file for exact n number). e, f Tissue sections were stained with Ab against Ki-67 and endomucin. e Typical immunofluorescence images. f Graph represents average proliferating endothelial cells (Ki-67+ endomucin+ cells, arrows in e) counted per ×20 field (mean ± SEM, three fields were taken from each sample), n = 9–12/group (see Source Data file for exact n number). g, h pups were perfused intracardially with WGA-Alexa Fluor 647. Intestinal submucosal vascular networks were imaged, and vascular density was assessed using Photoshop (×10), n = 4–5/group (see dots in panel). P values were calculated using one-way ANOVA followed by Turkey–Kramer multiple-comparison test (b, d, f, and h). i, j Neonatal mice was submitted to the NEC model and treated with IGF-1 or control twice daily (see method section). i 60-hour-survival curve is shown (n = 28 in NEC and 30 in NEC/IGF-1 group), P value were calculated using Gehan–Breslow–Wilcoxon test. j Intestinal injury histological scores (n = 28 in NEC and 29 in NEC-IGF-1 group), P value were calculated using Chi-square test. *p < 0.05, **p < 0.01, ***p < 0.001, ****p < 0.0001. Source data are provided as a Source Data file.
Fig. 8
Fig. 8. Endothelial cell proliferation is diminished and the number of IGF-1-producing macrophages is decreased in the intestine of human neonates with NEC compared to controls.
a, b Sections of human NEC (n = 4) and control (n = 5) intestinal tissues were stained for CD31 (green) and Ki-67 (red). 2–3 images per sample from non-necrotic area were taken at ×20 and proliferating endothelial (CD31+Ki-67+) cells were counted. a Typical images are shown here. b Number of proliferating endothelial cells (represented by each dot) per ×20 image (mean ± SEM), scale bar = 100 µm. c Images of control human neonatal intestinal tissue sections subjected to in situ hybridization using a probe for IGF-1 (green) and counterstained for macrophages using anti-CX3CR1 antibodies (red); bar = 25 (top) and 10 µm (bottom). d, e NEC and control tissue sections were stained by immunofluorescence for IGF-1 (green) and the macrophage marker CX3CR1 (red). d Typical images are shown. Overlay image includes DAPI, scale bar = 100 µm. e Graph represents the number of IGF-1+ CX3CR1+ cells per field (mean ± SEM, 3–4 ×20 fields of non-necrotic area were taken from each sample; n = 4 patients/group). P values were calculated using two-sided Student’s t tests (b and e). ****p < 0.0001. Source data are provided as a Source Data file.
Fig. 9
Fig. 9. IGF-1 released from embryonically derived macrophages binds to IGF-1R on endothelial cells to activate VEGF expression, leading to endothelial cell proliferation, promoting intestinal microvascular development. Deficient macrophage-derived IGF-1 signaling impairs intestinal microvascular development, thus increasing intestinal susceptibility to NEC.
EnC endothelial cell(s), IGF-1 insulin-like growth factor, IGF-1R IGF-1 receptor.

Similar articles

Cited by

References

    1. Neu J, Walker WA. Necrotizing enterocolitis. N. Engl. J. Med. 2011;364:255–264. - PMC - PubMed
    1. Mihi B, Good M. Impact of toll-like receptor 4 signaling in necrotizing enterocolitis: the state of the science. Clin. Perinatol. 2019;46:145–157. - PMC - PubMed
    1. Patel AL, Panagos PG, Silvestri JM. Reducing incidence of necrotizing enterocolitis. Clin. Perinatol. 2017;44:683–700. - PubMed
    1. Hsueh W, et al. Neonatal necrotizing enterocolitis: clinical considerations and pathogenetic concepts. Pediatr. Dev. Pathol. 2003;6:6–23. - PMC - PubMed
    1. Stappenbeck TS, Hooper LV, Gordon JI. Developmental regulation of intestinal angiogenesis by indigenous microbes via Paneth cells. Proc. Natl Acad. Sci. USA. 2002;99:15451–15455. - PMC - PubMed

Substances