Naturally occurring combinations of receptors from single cell transcriptomics in endothelial cells
- PMID: 35388065
- PMCID: PMC8987085
- DOI: 10.1038/s41598-022-09616-9
Naturally occurring combinations of receptors from single cell transcriptomics in endothelial cells
Abstract
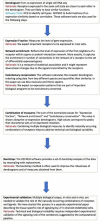
VEGF inhibitor drugs are part of standard care in oncology and ophthalmology, but not all patients respond to them. Combinations of drugs are likely to be needed for more effective therapies of angiogenesis-related diseases. In this paper we describe naturally occurring combinations of receptors in endothelial cells that might help to understand how cells communicate and to identify targets for drug combinations. We also develop and share a new software tool called DECNEO to identify them. Single-cell gene expression data are used to identify a set of co-expressed endothelial cell receptors, conserved among species (mice and humans) and enriched, within a network, of connections to up-regulated genes. This set includes several receptors previously shown to play a role in angiogenesis. Multiple statistical tests from large datasets, including an independent validation set, support the reproducibility, evolutionary conservation and role in angiogenesis of these naturally occurring combinations of receptors. We also show tissue-specific combinations and, in the case of choroid endothelial cells, consistency with both well-established and recent experimental findings, presented in a separate paper. The results and methods presented here advance the understanding of signaling to endothelial cells. The methods are generally applicable to the decoding of intercellular combinations of signals.
© 2022. The Author(s).
Conflict of interest statement
CP and GP own shares of Salgomed, Inc. SD, AH, MM, BKP, JGZ and NF declare no potential conflict of interest.
Figures


Similar articles
-
Single-Cell Transcriptome Analyses Reveal Endothelial Cell Heterogeneity in Tumors and Changes following Antiangiogenic Treatment.Cancer Res. 2018 May 1;78(9):2370-2382. doi: 10.1158/0008-5472.CAN-17-2728. Epub 2018 Feb 15. Cancer Res. 2018. PMID: 29449267
-
A Quininib Analogue and Cysteinyl Leukotriene Receptor Antagonist Inhibits Vascular Endothelial Growth Factor (VEGF)-independent Angiogenesis and Exerts an Additive Antiangiogenic Response with Bevacizumab.J Biol Chem. 2017 Mar 3;292(9):3552-3567. doi: 10.1074/jbc.M116.747766. Epub 2016 Dec 29. J Biol Chem. 2017. PMID: 28035003 Free PMC article.
-
Effects of adrenomedullin on endothelial cells in the multistep process of angiogenesis: involvement of CRLR/RAMP2 and CRLR/RAMP3 receptors.Int J Cancer. 2004 Mar 1;108(6):797-804. doi: 10.1002/ijc.11663. Int J Cancer. 2004. PMID: 14712479
-
Novel anti-angiogenic therapies for malignant gliomas.Lancet Neurol. 2008 Dec;7(12):1152-60. doi: 10.1016/S1474-4422(08)70260-6. Lancet Neurol. 2008. PMID: 19007739 Review.
-
Vascular endothelial cell growth factor (VEGF), an emerging target for cancer chemotherapy.Curr Med Chem Anticancer Agents. 2003 Mar;3(2):95-117. doi: 10.2174/1568011033353452. Curr Med Chem Anticancer Agents. 2003. PMID: 12678905 Review.
Cited by
-
LIF, a mitogen for choroidal endothelial cells, protects the choriocapillaris: implications for prevention of geographic atrophy.EMBO Mol Med. 2022 Jan 11;14(1):e14511. doi: 10.15252/emmm.202114511. Epub 2021 Nov 15. EMBO Mol Med. 2022. PMID: 34779136 Free PMC article.
References
-
- Chung AS, Ferrara N. Developmental and pathological angiogenesis. Annu. Rev. Cell Dev. Biol. 2011;27:563–584. - PubMed
-
- Potente M, Gerhardt H, Carmeliet P. Basic and therapeutic aspects of angiogenesis. Cell. 2011;146:873–887. - PubMed
-
- Yancopoulos GD, et al. Vascular-specific growth factors and blood vessel formation. Nature. 2000;407:242–248. - PubMed
-
- Ferrara N, Adamis APT. years of anti-vascular endothelial growth factor therapy. Nat. Rev. Drug Discovery. 2016;15:385–403. - PubMed

