. 2022 May 11;42(19):3879-3895.
doi: 10.1523/JNEUROSCI.1463-21.2022. Epub 2022 Apr 6.

A Ca2+-Dependent Mechanism Boosting Glycolysis and OXPHOS by Activating Aralar-Malate-Aspartate Shuttle, upon Neuronal Stimulation

Affiliations

A Ca2+-Dependent Mechanism Boosting Glycolysis and OXPHOS by Activating Aralar-Malate-Aspartate Shuttle, upon Neuronal Stimulation

Irene Pérez-Liébana et al. J Neurosci. .

Abstract

Calcium is an important second messenger regulating a bioenergetic response to the workloads triggered by neuronal activation. In embryonic mouse cortical neurons using glucose as only fuel, activation by NMDA elicits a strong workload (ATP demand)-dependent on Na+ and Ca2+ entry, and stimulates glucose uptake, glycolysis, pyruvate and lactate production, and oxidative phosphorylation (OXPHOS) in a Ca2+-dependent way. We find that Ca2+ upregulation of glycolysis, pyruvate levels, and respiration, but not glucose uptake, all depend on Aralar/AGC1/Slc25a12, the mitochondrial aspartate-glutamate carrier, component of the malate-aspartate shuttle (MAS). MAS activation increases glycolysis, pyruvate production, and respiration, a process inhibited in the presence of BAPTA-AM, suggesting that the Ca2+ binding motifs in Aralar may be involved in the activation. Mitochondrial calcium uniporter (MCU) silencing had no effect, indicating that none of these processes required MCU-dependent mitochondrial Ca2+ uptake. The neuronal respiratory response to carbachol was also dependent on Aralar, but not on MCU. We find that mouse cortical neurons are endowed with a constitutive ER-to-mitochondria Ca2+ flow maintaining basal cell bioenergetics in which ryanodine receptors, RyR2, rather than InsP3R, are responsible for Ca2+ release, and in which MCU does not participate. The results reveal that, in neurons using glucose, MCU does not participate in OXPHOS regulation under basal or stimulated conditions, while Aralar-MAS appears as the major Ca2+-dependent pathway tuning simultaneously glycolysis and OXPHOS to neuronal activation.SIGNIFICANCE STATEMENT Neuronal activation increases cell workload to restore ion gradients altered by activation. Ca2+ is involved in matching increased workload with ATP production, but the mechanisms are still unknown. We find that glycolysis, pyruvate production, and neuronal respiration are stimulated on neuronal activation in a Ca2+-dependent way, independently of effects of Ca2+ as workload inducer. Mitochondrial calcium uniporter (MCU) does not play a relevant role in Ca2+ stimulated pyruvate production and oxygen consumption as both are unchanged in MCU silenced neurons. However, Ca2+ stimulation is blunt in the absence of Aralar, a Ca2+-binding mitochondrial carrier component of Malate-Aspartate Shuttle (MAS). The results suggest that Ca2+-regulated Aralar-MAS activation upregulates glycolysis and pyruvate production, which fuels mitochondrial respiration, through regulation of cytosolic NAD+/NADH ratio.

Keywords: Aralar/AGC1/Slc25a12; calcium regulation; glycolysis; malate aspartate shuttle; mitochondrial calcium uniporter; neuronal metabolism.


Figures

Figure 1.
Figure 1.
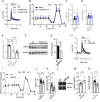
RyRs control neuronal mitochondrial respiration. A, 5 and 10 μm 3-dmXeB substantially reduces the Ca2+ transients induced by 200 μm DHPG, an agonist of Group I metabotropic glutamate receptors in cortical neurons. Neuronal cultures were preincubated with 3-dmXeB 60 min before the experiment was started. B, C, Incubation with 5 μm 3-dmXeB does not change basal respiration in cortical neurons. 3-dmXeB was added to the culture 60 min before the experiment was started. Mitochondrial function was determined through sequential addition of 6 μm oligomycin (Olig), 0.5 mm DNP, and 1 μm/1 μm antimycin A/rotenone (A/R) at the indicated time points. Data are mean ± SEM; n = 7. C, Basal respiration corrected for nonmitochondrial respiration. Dots represent individual data. Error bars indicate mean ± SEM; n = 14 or 15. D, Basal OCR/ECAR ratio values. Data are mean ± SEM; n = 8-17. E, qPCR analysis of the cDNA obtained from neuronal cultures transduced with rAAV containing two different RyR2-directed (RyR2-KD1 or RyR2-KD) or Scrambled (Scr) shRNA using specific oligos; values were normalized to RyR2 mRNA in Scr neurons. Data are mean ± SEM, 5-9 wells (dots) from two independent experiments. One-way ANOVA: **p ≤ 0.01, ****p ≤ 0.0001, post hoc Bonferroni test. F, Western blot analysis of RyR levels in neurons transduced with rAAV containing RyR2-directed (RyR2-KD) or Scrambled shRNA (Scr). GAPDH was used as loading control. G, Quantitative analysis from Western blot of RyR2/GAPDH. Data are mean ± SEM; n = 3. *p = 0.049 (two-tailed t test). H, RyR2 silencing decreases caffeine-induced [Ca2+]i signal, which is blocked by ryanodine or dantrolene (see Extended Data Fig. 1-1A,B). I–K, RyR2 silencing decreases basal and oligomycin-sensitive OCR levels in neurons. I, Data are mean ± SEM; n = 7 or 8. J, Data are mean ± SEM; n = 14-16. **p = 0.0037. K, Data are mean ± SEM; n = 20-24. **p = 0.0017 (t test). L, Representative Western blot analysis of p-AMPK and AMPK levels. M, Quantitative analysis from Western blot of p-AMPK/AMPK levels. Dots represent individual data. Error bars indicate mean ± SEM; n = 9. **p = 0.0069 (t test). N, RyR2 silencing decreases basal OCR/ECAR ratio values. Data are mean ± SEM; n = 8-17, from 3 independent experiments and does not change ATP, ADP, or AMP levels (see Extended Data Fig. 1-1C–G). **p = 0.0041 (two-tailed t test).
Figure 2.
Figure 2.
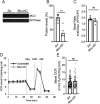
Basal mitochondrial Ca2+ and respiration do not change in Mcu-KD cortical neurons. A, Representative Western blot analysis of MCU levels in neurons transduced with rAAV-containing MCU-directed (Mcu-KD) or Scrambled shRNA (Scr). βATPase was used as loading control. B, Quantitative analysis from Western blot of MCU/ βATPase. Dots represent individual data. Error bars indicate mean ± SEM; n = 3-5. **p = 0.0072 (t test). C, Basal ratio of 4mtD3cpv probe reflecting basal mitochondrial Ca2+ levels in Scr and Mcu-KD neurons. Dots represent individual data. Error bars indicate mean ± SEM; n = 19-21 neurons per condition from 5 independent platings. p = 0.2335 (t test). D, E, Basal respiration in Scrambled and Mcu-KD neurons expressed as OCR (nmol O2/min/mg protein). Dots represent individual data. Error bars indicate mean ± SEM; n = 26 per condition from 5 independent platings. p = 0.4193 (t test).
Figure 3.
Figure 3.
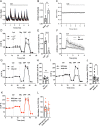
Cch stimulation of mitochondrial respiration depends on calcium and the ARALAR-MAS pathway. A, fura-2 AM [Ca2+]i signals in neurons in HCSS medium containing 2 mm CaCl2, on addition of 250 μm Cch where indicated. The figure shows a representative experiment; each trace corresponds to a single neuron from the same recording field. Spontaneous Ca2+ oscillations are blocked by inhibitors of ionotropic glutamate receptors (Extended Data Fig. 3-1A,B). B, Quantification of peak amplitude as ΔRatio (F340/F380) ± SEM comparing basal spontaneous Ca2+ oscillations to Cch-enhanced Ca2+ oscillations. Data were obtained from 4 independent experiments. Means were compared using one-tailed t test (p = 0.0064). C, SBFI [Na+]i signals in neurons on addition of 250 μm Cch where indicated. Data are mean ± SEM: 3 experiments, n = 96. D, Stimulation by 250 μm Cch of OCR expressed as percentage of basal OCR in the absence of Ca2+ (–Ca2+) or presence of 2 mm Ca2+ (+Ca2+) in the incubation medium. E, Quantification of percentage of respiratory stimulation (OCR % 3 min after Cch addition). Data were obtained from 6 independent experiments (n = 6). Means were compared using one-tailed t test (p ≤ 0.0001). The effect of Cch on Ca2+ oscillations was the same in MCU-KD or in Aralar-KO neurons (Extended Data Fig. 3-1C–H). F, 4mtD3cpv mitochondrial Ca2+ signals in Scrambled or Mcu-KD neurons on addition of 250 μm Cch where indicated. Data are normalized to the initial values and are expressed as mean ± SEM. Data were obtained from 3 independent experiments (n = 8-11 cells). G, Cch (250 μm) stimulation of OCR expressed as percentage of basal OCR in Scrambled and Mcu-KD neurons. H, Percentage of respiratory stimulation (OCR % 3 min after Cch addition) in neurons infected with Scr and Mcu rAAVs. Data were obtained from 3 independent experiments (n = 10-12). I, Cch (250 μm) stimulation of OCR expressed as percentage of basal OCR in WT and Aralar-KO neurons. J, Percentage of respiratory stimulation (OCR % 3 min after Cch addition) in WT and Aralar-KO neurons. Data were obtained from 6 independent experiments (n = 14-21). Means were compared using one-tailed t test (p = 0.0063). K, Cch (250 μm) stimulation of OCR in WT and Aralar-KO neurons in the presence of 2 mm pyruvate. L, Percentage of respiratory stimulation (OCR % 3 min after Cch addition). Data were obtained from 3 independent experiments (n = 11). Means were compared using one-tailed t test (p = 0.53).
Figure 4.
Figure 4.
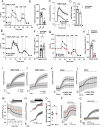
NMDA stimulation of OCR and cytosolic pyruvate and lactate formation. A, 25 μm NMDA-stimulated respiration in cortical neurons incubated in the presence of 2 mm Ca2+ (+Ca2+) or without calcium (–Ca2+; plus 100 μm EGTA), expressed as percentage of basal values (OCR %). B, NMDA-stimulated OCR (%). Data are mean ± SEM (bars); n = 9-16 (dots) from two different experiments. One-way ANOVA: ***p ≤ 0.001, post hoc Bonferroni test. C, 25 and 5 μm (Extended Data Fig. 4-1A,B) NMDA-induced changes in mitochondrial Ca2+ (Ca2+-mit) in Scrambled (Scr) and Mcu-silenced (Mcu-KD) neurons transfected with 4mtD3cpv probe. D, Quantification of maximum Ca2+-mit increment (ΔF max) after NMDA stimulation. Data are mean ± SEM (bars); n = 10 or 11 from 3 independent experiments. ***p = 0.0006 (t test). NMDA-induced cytosolic Ca2+ signals were the same in Scrambled and MCU-KD neurons (Extended Data Fig. 4-2A–D). E, 25 and 5 μm (Extended Data Fig. 4-1C,D) NMDA-stimulated respiration in Scrambled and Mcu-KD neurons, expressed as percentage of basal values (OCR %). F, Quantification of NMDA-stimulated OCR (%). Data are mean ± SEM (bars); n = 30-33, 5 independent experiments. *p = 0.0173 (t test). G, 25 and 5 μm (Extended Data Fig. 4-1E,F) NMDA-stimulated respiration in WT and Aralar-KO neurons, expressed as percentage of basal values (OCR %). H, Quantification of NMDA-stimulated OCR (%). Data are mean ± SEM (bars); n = 9-16 (dots) from 2 independent experiments. ****p < 0.0001 (t test). Cytosolic and mitochondrial Ca2+ signals were the same in WT and Aralar-KO neurons (Extended Data Fig. 4-2E–L). I, J, Effect of NMDA in the presence (+Ca2+) or absence (–Ca2+) of calcium on cytosolic pyruvate (Pyr) and lactate (Lac) in neurons transfected with pyronic (I) and laconic (J) probes. K, L, Dose-dependent effect of 5 and 25 μm NMDA induction of Pyr (K) and Lac (L) production. Data are mean ± SEM; n = 5-15 neurons per condition from 2-6 independent experiments. M, Intracellular pH variation determined in BCECF-AM-loaded neurons after 5 mm lactate (Lac) acute addition with or without 1 min pre-incubation with 1 μm MCT1/2 inhibitor AR-C155858 (AR-C1). Data are mean ± SEM; n = 6 per condition from 2 independent experiments. N, Lactate changes induced by 25 μm NMDA in neurons to which 1 μm AR-C1 or medium (Veh) was pre-added. O, Quantification of maximum fluorescence change (ΔF max) in Lac after Veh/1 μm AR-C1 and 25 μm NMDA. P, Lactate changes induced by 25 μm NMDA in neurons in the presence (Lact) or absence (Ctr) of extracellular 2 mm lactate. Q, Pyruvate changes induced by 25 μm NMDA in neurons pre-incubated 30 min with HCSS (Veh), 0.5 mm IAA, or IAA + 1 μm AR-C1 (IAA + AR-C1). Data are mean ± SEM; n = 8-20 per condition from 4-8 independent experiments. The 4mtD3cpv, pyronic, laconic, and BCECF-AM experiments were performed in HCSS, 2.5 mm glucose, and 2 mm Ca2+ or 100 μm EGTA (–Ca2+).
Figure 5.
Figure 5.
NMDA-induced changes in cytosolic pyruvate and lactate, in WT and Aralar-KO primary neuronal cultures. A, D, Cortical neurons from WT and Aralar-KO mice transfected with pyronic (A) and laconic (D) probes were stimulated with 25 μm NMDA in 2.5 mm glucose HCSS, in the presence of 2 mm Ca2+ (+Ca2+) or 100 μm EGTA (–Ca2+). FRET changes reporting cytosolic pyruvate or lactate levels are shown. B, E, Quantification of maximum fluorescence change (ΔF max) in pyruvate (B) and Lac (E) after NMDA stimulation in the presence of Ca2+. C, F, Quantification of velocity of increase of pyruvate (C) and Lac (F) (ΔF/min) in the presence of Ca2+ as the increment of fluorescence ratio during the first 30 s after stimulation. n = 10-22 per condition from 5-8 independent experiments for all pyruvate and Lac assays; 5 mm pyruvate or Lac was added 3 min after NMDA as a control. Data are mean ± SEM. *p = 0.0133 (t test). In the absence of Ca2+, pyruvate and Lac output was the same in Aralar-KO and control neurons (A,D). MCU-KD or Scrambled neurons had similar increases in pyronic or laconic fluorescence on NMDA exposure (Extended Data Fig. 5-1).
Figure 6.
Figure 6.
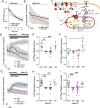
25 μm NMDA-induced changes in cytosolic glucose levels. A, B, Changes in cytosolic pH (A) or intracellular glucose (B) in BCECF-loaded or FLII12Pglu-700μδ6 transfected neurons after the acute addition of 25 μm NMDA or 5 mm HCl. Data are mean ± SEM; recordings from 5 or 6 cells per condition. C, Representative scheme Ca2+-regulated Aralar-MAS activation upregulates glycolysis and pyruvate production, which fuels mitochondrial respiration, through regulation of cytosolic NAD+/NADH ratio. Image created with www.BioRender.com. D, F, 25 μm NMDA induced changes in glucose levels in WT (D) and Aralar-KO (G) neurons, with or without calcium or with a 20 s pre-incubation with 50 μm CytB or 0.5 mm IAA. E, H, Velocity of increase of glucose levels during the first 30 s after stimulation (ΔF/min) in WT (E) and Aralar-KO (H) neurons. F, I, FRET ratio change between pre-addition of NMDA and the end of the recording (ΔF endpoint) in WT (F) and Aralar-KO (I) neurons. Data are mean ± SEM; recordings from 7 to 17 cells per condition from 3 to 5 independent experiments. One-way ANOVA: *p ≤ 0.05, **p ≤ 0.005, ***p ≤ 0.001, post hoc Bonferroni test. ΔF at the endpoint after NMDA addition is higher in Aralar-KO than in WT neurons. Two-way ANOVA: **p ≤ 0.005, post hoc Bonferroni test. Assays using BCECF and FLII12Pglu-700μδ6 probes were performed in 2.5 mm glucose and 2 mm Ca2+ (+Ca2+) or 100 μm EGTA (–Ca2+) HCSS.
Figure 7.
Figure 7.
Dependence of external calcium or BAPTA-AM of the changes in cytosolic Ca2+, Na+, ATP, and ATP/ADP ratio and OCR induced by 25 μm NMDA in neocortical neuronal cultures. A, E, Cytosolic Ca2+ measurements in fura-2-loaded neurons; B, F, cytosolic Na+ in SBFI-loaded neurons; C, G, cytosolic ATP measurement in GO-ATeam-transfected neurons; D, H, cytosolic ATP/ADP ratio in Perceval-transfected neurons. A–D, In the presence of Ca2+. E–H, In nominally Ca2+-free media. The results correspond to representative experiments. I, K, OCR response to 25 μm NMDA in wt and Aralar KO neurons incubated with Ca2+ and in presence or absence of 1 μm BAPTA-AM. Data are mean ± SEM; n = 4-9. J, Histogram represents the decrease (***p < 0.001, n = 9, unpaired t test) in NMDA-induced stimulation of respiration in wt neurons in the presence of BAPTA-AM. K, In Aralar-KO neurons, the decrease was not significant.

Similar articles

Cited by

References

    1. Adler EM, Augustine GJ, Duffy SN, Charlton MP (1991) Alien intracellular calcium chelators attenuate neurotransmitter release at the squid giant synapse. J Neurosci 11:1496–1507. - PMC - PubMed
    1. Almeida A, Moncada S, Bolaños JP (2004) Nitric oxide switches on glycolysis through the AMP protein kinase and 6-phosphofructo-2-kinase pathway. Nat Cell Biol 6:45–51. 10.1038/ncb1080 - DOI - PubMed
    1. Alvarez G, Ramos M, Ruiz F, Satrústegui J, Bogonez E (2003) Pyruvate protection against β-amyloid-induced neuronal death: role of mitochondrial redox state. J Neurosci Res 73:260–269. 10.1002/jnr.10648 - DOI - PubMed
    1. Armstrong CT, Anderson JL, Denton RM (2014) Studies on the regulation of the human E1 subunit of the 2-oxoglutarate dehydrogenase complex, including the identification of a novel calcium-binding site. Biochem J 459:369–381. 10.1042/BJ20131664 - DOI - PubMed
    1. Ashrafi G, Ryan TA (2017) Glucose metabolism in nerve terminals. Curr Opin Neurobiol 45:156–161. 10.1016/j.conb.2017.03.007 - DOI - PMC - PubMed

Publication types

LinkOut - more resources