Selection and demography drive range-wide patterns of MHC-DRB variation in mule deer
- PMID: 35387584
- PMCID: PMC8988406
- DOI: 10.1186/s12862-022-01998-8
Selection and demography drive range-wide patterns of MHC-DRB variation in mule deer
Abstract
Background: Standing genetic variation is important especially in immune response-related genes because of threats to wild populations like the emergence of novel pathogens. Genetic variation at the major histocompatibility complex (MHC), which is crucial in activating the adaptive immune response, is influenced by both natural selection and historical population demography, and their relative roles can be difficult to disentangle. To provide insight into the influences of natural selection and demography on MHC evolution in large populations, we analyzed geographic patterns of variation at the MHC class II DRB exon 2 locus in mule deer (Odocoileus hemionus) using sequence data collected across their entire broad range.
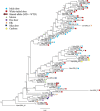
Results: We identified 31 new MHC-DRB alleles which were phylogenetically similar to other cervid MHC alleles, and one allele that was shared with white-tailed deer (Odocoileus virginianus). We found evidence for selection on the MHC including high dN/dS ratios, positive neutrality tests, deviations from Hardy-Weinberg Equilibrium (HWE) and a stronger pattern of isolation-by-distance (IBD) than expected under neutrality. Historical demography also shaped variation at the MHC, as indicated by similar spatial patterns of variation between MHC and microsatellite loci and a lack of association between genetic variation at either locus type and environmental variables.
Conclusions: Our results show that both natural selection and historical demography are important drivers in the evolution of the MHC in mule deer and work together to shape functional variation and the evolution of the adaptive immune response in large, well-connected populations.
Keywords: Adaptation; Cervidae; Genetic drift; Genetic variation; Historical demography; Major histocompatibility complex; Microsatellites; Natural selection; Next-generation sequencing; Parasite-mediated selection.
© 2022. The Author(s).
Conflict of interest statement
The authors declare that they have no competing interests.
Figures


Similar articles
-
Characterization of two MHC II genes (DOB, DRB) in white-tailed deer (Odocoileus virginianus).BMC Genet. 2020 Jul 29;21(1):83. doi: 10.1186/s12863-020-00889-5. BMC Genet. 2020. PMID: 32727360 Free PMC article.
-
Characterization of Mhc-DRB allelic diversity in white-tailed deer (Odocoileus virginianus) provides insight into Mhc-DRB allelic evolution within Cervidae.Immunogenetics. 1999 May;49(5):429-37. doi: 10.1007/s002510050516. Immunogenetics. 1999. PMID: 10199919
-
Range-wide analysis of genetic structure in a widespread, highly mobile species (Odocoileus hemionus) reveals the importance of historical biogeography.Mol Ecol. 2014 Jul;23(13):3171-90. doi: 10.1111/mec.12803. Epub 2014 Jun 16. Mol Ecol. 2014. PMID: 24863151
-
Major-histocompatibility-complex-associated variation in secondary sexual traits of white-tailed deer (Odocoileus virginianus): evidence for good-genes advertisement.Evolution. 2001 Mar;55(3):616-25. doi: 10.1554/0014-3820(2001)055[0616:mhcavi]2.0.co;2. Evolution. 2001. PMID: 11327168
-
Monomorphism and polymorphism at Mhc DRB loci in domestic and wild ruminants.Immunol Rev. 1999 Feb;167:169-78. doi: 10.1111/j.1600-065x.1999.tb01390.x. Immunol Rev. 1999. PMID: 10319259 Review.
References
-
- Barrett R, Schluter D. Adaptation from standing genetic variation. Trends Ecol Evol. 2008;23(1):38–44. - PubMed
-
- Przeworski M, Coop G, Wall JD. The signature of positive selection on standing genetic variation. Evolution. 2005;59:2312–2323. - PubMed
-
- Fisher MC, Garner TWJ, Walker SF. Global emergence of Batrachochytrium dendrobatidis and amphibian chytridiomycosis in space, time, and host. Annu Rev Microbiol. 2009;63:291–310. - PubMed
Publication types
MeSH terms
LinkOut - more resources
Full Text Sources
Research Materials
