. 2022 Apr 4;18(4):e1010016.
doi: 10.1371/journal.pcbi.1010016. eCollection 2022 Apr.

Inter-paralog amino acid inversion events in large phylogenies of duplicated proteins

Affiliations

Inter-paralog amino acid inversion events in large phylogenies of duplicated proteins

Stefano Pascarelli et al. PLoS Comput Biol. .

Abstract

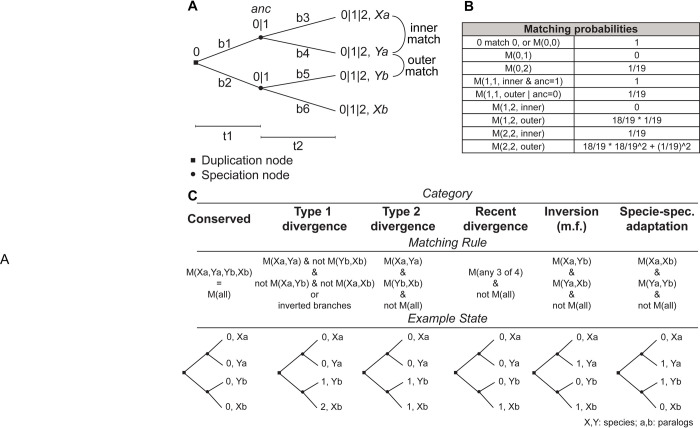
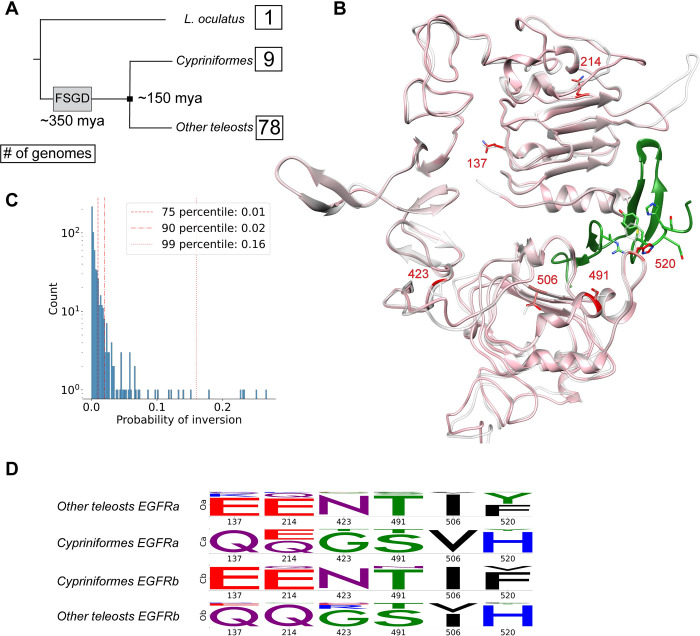
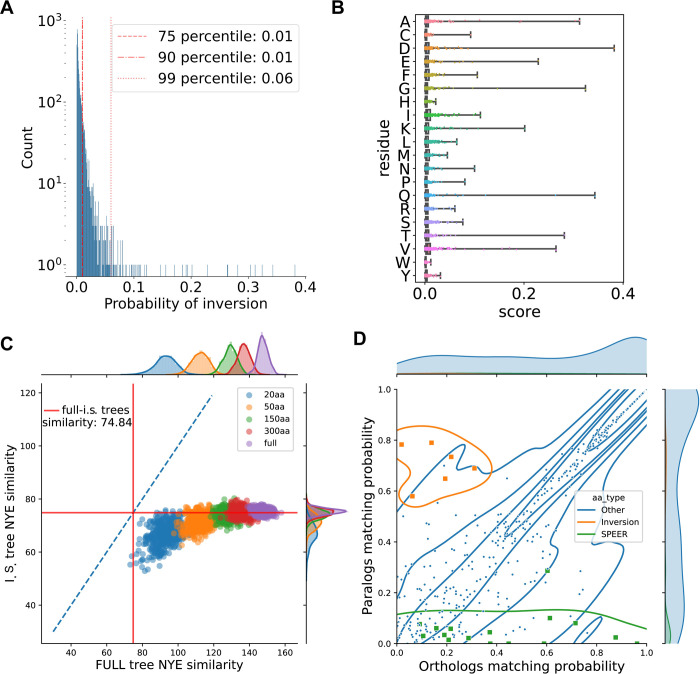
Connecting protein sequence to function is becoming increasingly relevant since high-throughput sequencing studies accumulate large amounts of genomic data. In order to go beyond the existing database annotation, it is fundamental to understand the mechanisms underlying functional inheritance and divergence. If the homology relationship between proteins is known, can we determine whether the function diverged? In this work, we analyze different possibilities of protein sequence evolution after gene duplication and identify "inter-paralog inversions", i.e., sites where the relationship between the ancestry and the functional signal is decoupled. The amino acids in these sites are masked from being recognized by other prediction tools. Still, they play a role in functional divergence and could indicate a shift in protein function. We develop a method to specifically recognize inter-paralog amino acid inversions in a phylogeny and test it on real and simulated datasets. In a dataset built from the Epidermal Growth Factor Receptor (EGFR) sequences found in 88 fish species, we identify 19 amino acid sites that went through inversion after gene duplication, mostly located at the ligand-binding extracellular domain. Our work uncovers an outcome of protein duplications with direct implications in protein functional annotation and sequence evolution. The developed method is optimized to work with large protein datasets and can be readily included in a targeted protein analysis pipeline.


Conflict of interest statement

The authors declare that they have no conflict of interest.

Figures

Fig 1
Fig 1. Theoretical model of the evolution of protein site after gene duplication.
(A) The structure of the phylogenetic tree that the model is based on. The branch lengths t1 and t2 are used to determine the probability of a substitution on each branch b1 to b6. A leaf node can be found in states 0, 1, or 2 depending on the number of mutations in the preceding branches. An inner match is defined to be a match between orthologs (Xa to Ya, or Xb to Yb), while an outer match is any other match. The probability for a match between two states is given by the table in (B) and represents the underlying transition to any of the 20 amino acids. (C) Description of the categories. The categories represent a biologically interpretable situation, suggested by their name. Given a certain outcome configuration of states, it is possible to calculate the probability of observing a certain category by using the matching rule. The “Example State” section shows the leaf configuration that gives the highest probability of observing the category described.
Fig 2
Fig 2. Theoretical model results.
(A) The heatmaps show the category probabilities at different tree branch lengths as calculated using the theoretical model definitions. (B) Exemplification of “Meta-functionalization” (star), the putative driver of inter-paralog inversions in the phylogeny. A multifunctional protein (green) subdivides its functions (blue and yellow) between the two copies obtained after gene duplication (triangle). In a sub-group of species, the functional inheritance of the two copies is inverted. This event is revealed by the pattern of amino acids inversions compared to the majority of the other species.
Fig 3
Fig 3. Inter-paralog inversions of amino acids in fish EGFR.
(A) Schematic representation of the fish dataset phylogeny. The dates (mya: million years ago) indicate the time of the Fish Specific whole Genome Duplication (FSGD) and the separation of Cypriniformes fish to all other teleost fish. The number in the boxes represents how many genomes are in the dataset for that group. (B) 3D model superposition of S. anshuensis EGFRa (pink) and EGFRb (white), generated by homology using human EGFR as a template (1IVO) [48]. The inverted residues have been highlighted in red. The ligand EGF (green) was taken from the human model after superposing the receptors. (C) DIRphy score distribution. The inter-paralog inversion event probability score was calculated for each site in the MSA that has less than 60% gaps. The top 1% of sites were further characterized. (D) Logo representation of the four sub alignments (two species groups, two protein copies) in the inverted sites. The logo represents the normalized amino acid count per column and was obtained using the python package Logomaker [49].
Fig 4
Fig 4. Outcome to the validations.
(A) Distribution of the simulated evolution DIRphy scores. A 5000 random amino acid sequence was evolved through the fish EGFR phylogenetic tree using the same evolutionary models used to generate the tree. The resulting MSA was used to compute the DIRphy score. (B) Distribution per amino acid of the simulated evolution DIRphy scores as shown by the reference (S. anshuiensis EGFRa). (C) Bootstrap trees similarity to the full and inverted sites trees. The color represents the length of the sub-alignment used to generate the bootstrap tree. The red line shows the similarity between the full and inverted sites trees. The blue line is the identity line. (D) Comparison of the sites identified by DIRphy and SPEER. The matching probability of the HMM of four sub-alignments was used to compare between species the orthologs (EGFRa vs EGFRa, EGFRb vs EGFRb) and paralogs (EGFRa vs EGFRb). The matching probability is calculated as the average of two dot products of the frequency arrays. The orange color shows sites where an inversion was identified, while the green color shows sites where the p-value of SPEER score is lower than 0.01.
Fig 5
Fig 5. Extended protein dataset validation.
(A) Distribution of DIRphy scores in the extended dataset. DIRphy was tested in a dataset of 54 protein duplication trees obtained from fish proteomes. The blue color indicates inter-paralog inversion scores, the orange color indicates specie-specific adaptation scores. The two lines show the 99th percentile score of the distributions. (B) Number of positions with a score higher than 0.08 per protein. More than half of the dataset has less than 5 high scoring positions. (C) High scoring positions (>0.08) per protein versus protein length. The two proteins that have 18 high scoring positions in the inter-paralog inversion score are highlighted. (D) Sequence logo of the high scoring positions for the two previously highlighted proteins. The two names are respectively the spotted gar reference name and the human ortholog name. In red arrows, the positions that involve a tyrosine inversion are highlighted.

Similar articles

Cited by

References

    1. Ashkenazy H, Abadi S, Martz E, Chay O, Mayrose I, Pupko T, et al.. ConSurf 2016: an improved methodology to estimate and visualize evolutionary conservation in macromolecules. Nucleic Acids Res. 2016;44(W1):W344–W50. doi: 10.1093/nar/gkw408 . - DOI - PMC - PubMed
    1. Sankararaman S, Kolaczkowski B, Sjölander K. INTREPID: a web server for prediction of functionally important residues by evolutionary analysis. Nucleic Acids Res. 2009;37(Web Server issue):W390–5. Epub 2009/05/16. doi: 10.1093/nar/gkp339 ; PubMed Central PMCID: PMC2703888. - DOI - PMC - PubMed
    1. Wilkins AD, Bachman BJ, Erdin S, Lichtarge O. The use of evolutionary patterns in protein annotation. Curr Opin Struct Biol. 2012;22(3):316–25. Epub 2012/05/29. doi: 10.1016/j.sbi.2012.05.001 ; PubMed Central PMCID: PMC3439137. - DOI - PMC - PubMed
    1. Kimura M. The neutral theory of molecular evolution: a review of recent evidence. Jpn J Genet. 1991;66(4):367–86. Epub 1991/08/01. doi: 10.1266/jjg.66.367 . - DOI - PubMed
    1. Rockah-Shmuel L, Tóth-Petróczy Á, Tawfik DS. Systematic Mapping of Protein Mutational Space by Prolonged Drift Reveals the Deleterious Effects of Seemingly Neutral Mutations. PLoS Comput Biol. 2015;11(8):e1004421. Epub 2015/08/15. doi: 10.1371/journal.pcbi.1004421 ; PubMed Central PMCID: PMC4537296. - DOI - PMC - PubMed

Publication types

Grants and funding

Funding support by the Okinawa Institute of Science and Technology to P.L. is gratefully acknowledged. The funders had no role in study design, data collection and analysis, decision to publish, or preparation of the manuscript.