. 2022 Apr 4:11:e71196.
doi: 10.7554/eLife.71196.

DNA circles promote yeast ageing in part through stimulating the reorganization of nuclear pore complexes

Affiliations

DNA circles promote yeast ageing in part through stimulating the reorganization of nuclear pore complexes

Anne C Meinema et al. Elife. .

Abstract

The nuclear pore complex (NPC) mediates nearly all exchanges between nucleus and cytoplasm, and in many species, it changes composition as the organism ages. However, how these changes arise and whether they contribute themselves to ageing is poorly understood. We show that SAGA-dependent attachment of DNA circles to NPCs in replicatively ageing yeast cells causes NPCs to lose their nuclear basket and cytoplasmic complexes. These NPCs were not recognized as defective by the NPC quality control machinery (SINC) and not targeted by ESCRTs. They interacted normally or more effectively with protein import and export factors but specifically lost mRNA export factors. Acetylation of Nup60 drove the displacement of basket and cytoplasmic complexes from circle-bound NPCs. Mutations preventing this remodeling extended the replicative lifespan of the cells. Thus, our data suggest that the anchorage of accumulating circles locks NPCs in a specialized state and that this process is intrinsically linked to the mechanisms by which ERCs promote ageing.

Keywords: DNA circles; NPC; S. cerevisiae; aging; cell biology; evolutionary biology; nuclear basket.


Conflict of interest statement

AM, AM, MM, TA, SL, GC, YB No competing interests declared

Figures
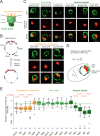
Figure 1.
Figure 1.. DNA circle anchored NPCs lack the peripheral subunits.
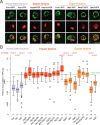
(A) Cartoon of the NPC, showing the scaffold core, cytoplasmic complexes and nuclear basket. (B) Cartoon of an engineered DNA circle with an excisable centromere (CEN3) and TetR-mCherry decorated TetO repeats. The circle contains an autonomic replication sequence (ARS1) and selection markers (LEU2, URA3). (C) Fluorescent images of nuclei in yeast cells with accumulated DNA circles; the DNA circle clusters are labeled with TetR-NLS-mCherry (red) and different nucleoporins labeled with GFP (green). Scale bar is 2 µm. More images in Figure 1—figure supplement 1. (D) Cartoon exemplifying the quantification of protein accumulation around the DNA cluster. The NPC cap was selected by a line scan through the nuclear envelope adjacent to the DNA circle cluster. The relative accumulation (RA) is defined as the ratio of background corrected GFP intensity in the NPC cap (Ic – IBG) over that in the rest of the nucleus (IR – IBG). (E) Quantification of GFP-labeled nucleoporin accumulation in the NPC cap localized at the DNA circle cluster. The relative fluorescence intensity in the NPC cap is plotted on a log2-scale. The median accumulation of the core nucleoporins is indicated (green line). p-Value stands for student’s t-test between the specific nucleoporin and pooled data of all core nups together, no p-value is indicated if the difference is not significant; the sample size per strain is indicated (n).
Figure 1—figure supplement 1.
Figure 1—figure supplement 1.. DNA circle anchored NPCs lack the peripheral subunits, Related to Figure 1.
(A) Additional example images of all strains as quantified in Figure 1E. The DNA circle clusters are labeled with TetR-NLS-mCherry (red) and different nucleoporins with GFP (green). Scale bar is 2 µm. (B) Example images of nuclei in young yeast cells prior to DNA circle accumulation; with nucleoporins labeled with GFP and soluble TetR-NLS-mCherry. Without Tet-O containing DNA circles, TetR-NLS-mCherry is homogenously distributed in the nucleoplasm and the localization of both core subunits (Nup133-GFP) and basket subunits (Nup60-GFP) is rather homogenously distributed throughout the nuclear envelope.
Figure 2.
Figure 2.. Peripheral subunits of NPC displaced in wild-type aged cells.
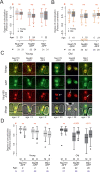
(A) To quantify the degree of nucleoporin colocalization, a line was drawn through the nuclear envelope in a focal image of a young (top) and aged (bottom) nucleus of cells co-expressing GFP-tagged Nup GFP (e.g. Nup60-GFP) and a mCherry-tagged Nup as a reference (e.g. Nup159-mCherry, see Materials and methods). The Pearson correlation between the two intensity profiles is calculated, and used as a measure for nucleoporin colocalization. (B) Fluorescent images of young and old cells in the yeast ageing chip, with nucleoporins labeled with GFP (green) and the reference Nup159 with mCherry (red). The age of each cell is indicated. Scale bars are 5 µm. (C) Quantification of the degree of colocalization between target and reference nucleoporin is plotted for young and old wild type cells. The p-value stands for the student’s t-test between young and old cells. The sample size (n) and the median age is indicated. (D) Fluorescent images of young and aged cells in the yeast ageing chip, as in B, but with Nup84-mCherry as a reference nucleoporin. Scale bars are 5 µm. (E) Quantification of the co-localization between nucleoporins in young and old cells, as in C, but with Nup84-mCherry as a reference.
Figure 3.
Figure 3.. Endogenous DNA circles drive nuclear basket displacement in wild-type aged cells.
(A) Quantification of the degree of colocalization between target and reference nucleoporin is plotted for young and old wild-type, as was done in Figure 2C, but in fob1Δ cells. The sample size (n) and the median age is indicated. The p-value stands for the student’s t-test between young and old cells. (B) Same as A, but in sgf73Δ cells. (C) Fluorescent images of young and old mitotic cells in the yeast ageing chip. Scale bars are 5 µm. (D) Same as in Figure 2C, but comparing nucleoporin colocalization in young and old mother (M) with their corresponding daughter (D) cell. The p-value stands for the student’s t-test between mother and daughter cell. The sample size (n) and the median age is indicated.
Figure 4.
Figure 4.. DNA circle anchored NPCs are not recognized as defective.
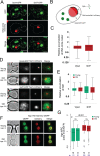
(A) Cells with accumulated DNA circles labeled with TetR‐NLS-mCherry and ESCRT-complex components Vps4 or Snf7 tagged with GFP. (B) Cartoon exemplifying the quantification of Vps4/Snf7 accumulation around the DNA circle cluster/Net1-mCherry focus. A line scan was drawn over the nuclear envelope adjacent to the DNA circle cluster/Net1-mCherry focus and another one over the rest of the nuclear envelope, in a single focal plane. The intensity of Vps4-GFP or Snf7-GFP was measured in each region. The relative accumulation (RA) is defined as the ratio of GFP intensity around the DNA circle cluster/Net1-mCherry focus (IC) over that in the rest of the nuclear periphery (IR). (C) Quantification of relative accumulation of Vps4-GFP and Snf7-GFP at the DNA circle cluster (n = 60 cells each). (D) Young and old cells in the yeast ageing chip. Net1 is tagged with mCherry and ESCRT-complex components Vps4 or Snf7 with GFP. (E) Quantification of the relative accumulation of Vps4 and Snf7 at Net1-mCherry foci in young and old cells (n = 50 cells each). (F) Young and old cells in the yeast ageing chip. Nup170 is tagged with a fluorescent timer (Nup170‐mCherry‐sfGFP). (G) Quantification of the relative age of the NPC plotted as the intensity ratio between mCherry and GFP of Nup170 tagged with a fluorescent timer (Nup170‐mCherry‐sfGFP), measured in young and old mother (M) versus daughter cells (D). Sample size (n) is indicated.
Figure 4—figure supplement 1.
Figure 4—figure supplement 1.. Chm7 does not accumulate at the DNA circle cluster.
(A) Fluorescent images of nuclei in yeast cell with accumulated DNA circles labeled with TetR‐NLS-mCherry and Chm7‐GFP. Occurrence of Chm7‐GFP localization is categorized (1) at least one Chm7 focus in the NPC‐cap, (2) a Chm7 focus somewhere else in the nuclear envelope and (3) no visible Chm7 foci. The standard error of the mean is indicated, n = 190.
Figure 5.
Figure 5.. mRNA export and surveillance factors are displaced from circle-bound NPCs.
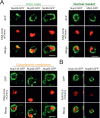
(A) Fluorescent images of nuclei in aged yeast cells, where the DNA circle clusters are labeled with TetR-NLS-mCherry (red) and transport factors with GFP (green). Scale bar is 2 µm. (B) Quantification of factor recruitment in the NPC cap adjacent to the DNA circle cluster, as in Figure 1E. The protein accumulation is plotted for associated factors (purple), import factors (red), and export factors (orange), and is compared to accumulation of the pooled NPC core subunits NPC (green line, duplicated from Figure 1E), no p-value is indicated if the difference is not significant. The sample size (n) is indicated.
Figure 6.
Figure 6.. DNA circle bound NPCs are functional in the nuclear import and retention of proteins.
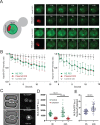
(A) Fluorescent images from FLIP experiments on Kap60-GFP and Kap123-GFP with a DNA circle cluster (labeled with TetR-NLS-mCherry). A region within the nucleus was continuously bleached for 13 s and (B) the intensity kinetics of Kap60 and Kap123 were measured at the Nuclear Envelope (NE) at the DNA circle cluster and in the adjacent NE region, in a single focal plane (n = 33). (C) Example images from a microfluidics ageing experiment of NLS-3xGFP strain. Intensity of the GFP was measured in the nucleus and the cytoplasm of a single focal plane and quantifications are shown in (D) and (E) (n = 50 at each timepoint). Statistical significance assessed by unpaired t-test. Average replicative lifespan at 24 hr is ~18 divisions.
Figure 7.
Figure 7.. Nup60 acetylation mediates its removal from NPCs as well as that of the cytoplasmic complex upon circle anchorage.
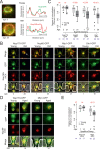
(A) Example images of nuclei in yeast cells with accumulated DNA circles and Nup60-GFP and nup60-K467R-GFP. The DNA circle clusters are labeled with TetR-NLS-mCherry (red). Scale bar is 2 µm. (B) Quantification of GFP-labeled nucleoporin accumulation in the cap, in nup60-K467R (brown lines), compared to wild-type (black lines) on a log2-scale, as in Figure 1E. Wild-type data is a copy from Figure 1E. The p-value stands for the student’s t-test between accumulation ratio of a specific nucleoporin in wild-type and nup60-K467R, no p-value is indicated if the difference is not significant. The sample size (n) is indicated.
Figure 8.
Figure 8.. Basket displacement promotes ageing (A) Example images of the same young and old wild-type cell in a trap of the yeast ageing chip.
The age of the cell is indicated, scale bar is 5 µm. (B) The design of the array with improved traps in the ageing chip. One single trap is highlighted to show its dimensions. The arrow shows the direction of the medium flow. (C) The lifespan curve for nup60Δ and nup60-K467R compared to a wild-type strain, plotted with 95% confidence interval limits. The p-value stands for Log-Rank test between nup60Δ or nup60-K467R with the wild-type strain. (D) Model depicting that DNA circle accumulation affects the organization of the NPC via a SAGA-mediated basket displacement.
Author response image 1.

Similar articles

Cited by

References

    1. Ackermann M, Schauerte A, Stearns SC, Jenal U. Experimental evolution of aging in a bacterium. BMC Evolutionary Biology. 2007;7:126. doi: 10.1186/1471-2148-7-126. - DOI - PMC - PubMed
    1. Akey CW, Singh D, Ouch C, Echeverria I, Nudelman I, Varberg JM, Yu Z, Fang F, Shi Y, Wang J, Salzberg D, Song K, Xu C, Gumbart JC, Suslov S, Unruh J, Jaspersen SL, Chait BT, Sali A, Fernandez-Martinez J, Ludtke SJ, Villa E, Rout MP. Comprehensive structure and functional adaptations of the yeast nuclear pore complex. Cell. 2022;185:361–378. doi: 10.1016/j.cell.2021.12.015. - DOI - PMC - PubMed
    1. Allegretti M, Zimmerli CE, Rantos V, Wilfling F, Ronchi P, Fung HKH, Lee CW, Hagen W, Turoňová B, Karius K, Börmel M, Zhang X, Müller CW, Schwab Y, Mahamid J, Pfander B, Kosinski J, Beck M. In-cell architecture of the nuclear pore and snapshots of its turnover. Nature. 2020;586:796–800. doi: 10.1038/s41586-020-2670-5. - DOI - PubMed
    1. Austad SN, Hoffman JM. Is antagonistic pleiotropy ubiquitous in aging biology? Evolution, Medicine, and Public Health. 2018;2018:287–294. doi: 10.1093/emph/eoy033. - DOI - PMC - PubMed
    1. Baldi S, Bolognesi A, Meinema AC, Barral Y. Heat stress promotes longevity in budding yeast by relaxing the confinement of age-promoting factors in the mother cell. eLife. 2017;6:e28329. doi: 10.7554/eLife.28329. - DOI - PMC - PubMed

Publication types

MeSH terms

Grants and funding

The funders had no role in study design, data collection and interpretation, or the decision to submit the work for publication.

LinkOut - more resources