. 2022 Mar 15:10:819967.
doi: 10.3389/fcell.2022.819967. eCollection 2022.

Tenascins Interfere With Remyelination in an Ex Vivo Cerebellar Explant Model of Demyelination

Affiliations

Tenascins Interfere With Remyelination in an Ex Vivo Cerebellar Explant Model of Demyelination

Juliane Bauch et al. Front Cell Dev Biol. .

Abstract

Oligodendrocytes form myelin membranes and thereby secure the insulation of axons and the rapid conduction of action potentials. Diseases such as multiple sclerosis highlight the importance of this glial cell population for brain function. In the adult brain, efficient remyelination following the damage to oligodendrocytes is compromised. Myelination is characterized by proliferation, migration, and proper integration of oligodendrocyte precursor cells (OPCs). These processes are among others controlled by proteins of the extracellular matrix (ECM). As a prominent representative ECM molecule, tenascin-C (Tnc) exerts an inhibitory effect on the migration and differentiation of OPCs. The structurally similar paralogue tenascin-R (Tnr) is known to promote the differentiation of oligodendrocytes. The model of lysolecithin-induced demyelination of cerebellar slice cultures represents an important tool for the analysis of the remyelination process. Ex vivo cerebellar explant cultures of Tnc -/- and Tnr -/- mouse lines displayed enhanced remyelination by forming thicker myelin membranes upon exposure to lysolecithin. The inhibitory effect of tenascins on remyelination could be confirmed when demyelinated wildtype control cultures were exposed to purified Tnc or Tnr protein. In that approach, the remyelination efficiency decreased in a dose-dependent manner with increasing concentrations of ECM molecules added. In order to examine potential roles in a complex in vivo environment, we successfully established cuprizone-based acute demyelination to analyze the remyelination behavior after cuprizone withdrawal in SV129, Tnc -/- , and Tnr -/- mice. In addition, we documented by immunohistochemistry in the cuprizone model the expression of chondroitin sulfate proteoglycans that are inhibitory for the differentiation of OPCs. In conclusion, inhibitory properties of Tnc and Tnr for myelin membrane formation could be demonstrated by using an ex vivo approach.

Keywords: extracellular matrix (ECM); myelin; myelin lesion; oligodendrocyte; regeneration; tenascin-C; tenascin-R.


Conflict of interest statement

The authors declare that the research was conducted in the absence of any commercial or financial relationships that could be construed as a potential conflict of interest.

Figures

FIGURE 1
FIGURE 1
Experimental setup of the cerebellar explant cultures. Cerebella of newborn tenascin-C and tenascin-R knockout and wildtype mice pups were cut into 250–300 µm thick sagittal sections and cultivated in slice culture medium. Demyelination was induced by administration of 0.5 mg/ml lysolecithin to the medium for 16-18 h. For remyelination analysis, explants were cultivated for further 14 days. Untreated control explants (C) were kept for the whole duration of the experiment.
FIGURE 2
FIGURE 2
(A,B) Comparison of myelination and remyelination in live cerebellar explant cultures of Tnc +/+ and Tnc −/− mice. (A) Tnc +/+ and Tnc −/− cerebellar explant cultures of the conditions myelinated (M), demyelinated (DM), remyelinated (RM), and control (C) were labeled with antibodies against NF200 (red) and MBP (green) to visualize the wrapping of myelin membranes around nerve fibers. Colocalization of neurofilament and MBP appeared as yellow staining. Demyelination nearly eliminated MBP-labeling. The myelinated condition shows a highly distinctive MBP staining. An initiating remyelination is visible for both genotypes. (B) Quantification of myelination indices of each condition in the comparison of Tnc +/+ and Tnc −/− explant cultures (M, myelinated; DM, demyelinated; RM, remyelinated; C, control). For the demyelinated condition, the quantification shows a significant reduction of the myelination index compared to the other conditions. Overall, both myelination and remyelination appeared more extensive in the absence of Tnc. All data are provided as mean ± SEM. Statistical significance was assessed using the two-way ANOVA (*p ≤ 0.05, **p ≤ 0.01, ***p ≤ 0.001) and Tukey’s multiple-comparisons test. Scale bars: 20 µm. Six independent experiments (N = 6) were performed, and three explants (n = 3) were analyzed per experiment for each condition.
FIGURE 3
FIGURE 3
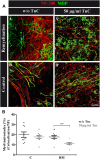
(A,B) Tnc inhibits remyelination in cerebellar slice cultures. (A,A′,B,B′) Exemplary cerebellar explants cultivated in the absence (A,B) or presence (A′,B′) of Tnc. Slices were stained for NF-200 and MBP. Tnc-treated remyelinated cultures displayed myelin membranes that did not wrap the axons throughout the whole cerebellar slice. Scale bar: 20 μm. (B) Evaluation of myelination index, defined as the proportion of colocalized area among the areas of complete neurofilament staining. These results indicate an impaired remyelination in Tnc-treated cultures. Data are presented as mean ± SEM, and statistical significance was assessed using an unpaired two-tailed Student’s t-test for each group (remyelinated and control). Six independent (N = 6) experiments were performed, and three explants (n = 3) were analyzed per experiment for each condition.
FIGURE 4
FIGURE 4
(A,B) Comparison of myelination and remyelination in live cerebellar explant cultures of Tnr +/+ and Tnr −/− mice. (A) Tnr +/+ and Tnr −/− cerebellar explant cultures of the conditions myelinated (M), demyelinated (DM), remyelinated (RM), and control (C) were immunohistochemically labeled with antibodies against NF200 (red) and MBP (green) to visualize the wrapping of myelin membranes around nerve fibers. Colocalization of neurofilament and MBP appeared as yellow staining. Demyelination nearly eliminated MBP-labeling. The myelinated condition shows a highly distinctive MBP staining. An initiating remyelination is visible for both genotypes. (B) Quantification of myelination indices of each condition in the comparison of Tnr +/+ and Tnr −/− explant cultures (M, myelinated; DM, demyelinated; RM, remyelinated; C, control). For the demyelinated condition, the quantification shows a significant reduction of the myelination index compared to the other conditions. Overall, both myelination and remyelination appeared more extensive in the absence of Tnr. All data are provided as mean ± SEM. Statistical significance was assessed using the two-way ANOVA (*p ≤ 0.05, **p ≤ 0.01, ***p ≤ 0.001) and Tukey’s multiple-comparisons test. Scale bars: 50 µm. Nine independent experiments were performed (N = 9), and three explants (n = 3) were analyzed per experiment for each condition and each slice culture group.
FIGURE 5
FIGURE 5
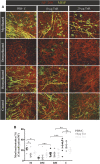
(A,B) Comparison of remyelination efficiency in cerebellar cultures from NMRI-mice in the presence of purified Tnr. (A) Labeling for neurofilament (red) and MBP (green) of live cerebellar explants kept under four different conditions: myelinated, demyelinated, remyelinated, and control. Explants were complemented either with plain PBS (control), with 10 µg, or with 20 µg immunopurified Tnr applied to the explant culture medium. MBP labeling indicates the degree of myelination under the different conditions. (B) The graph displays the quantification of myelination indices of the distinct conditions PBS-control (PBS-C), 10 µg Tnr, and 20 µg Tnr as applied to explant cultures kept in the different conditions (M, myelinated; DM, demyelinated; RM, remyelinated; C, control). All data are provided as mean ± SEM. Statistical significance was assessed using the two-way ANOVA (*p ≤ 0.05, **p ≤ 0.01, ***p ≤ 0.001) and Tukey’s multiple-comparisons test. Scale bars: 50 µm. Five independent experiments (N = 5) were carried out, and three (n = 3) explants per experiment were analyzed for each condition and each slice culture group.
FIGURE 6
FIGURE 6
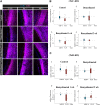
(A–C) Immunolabeling for MBP and gene expression analysis of the myelin genes PLP1 and MBP8 in the corpus callosum of SV129, Tnc −/− , and Tnr −/− mice under control, demyelinated, and remyelinated conditions. (A) Immunohistochemistry with antibodies against MBP (violet) for visualizing the myelination grade in the corpus callosum of SV129, Tnc −/− , and Tnr −/− mice. Four conditions were compared: control, one-week demyelinated (1 wk DM), one-week remyelinated (1 wk RM), and two-weeks remyelinated (2 wk RM). DAPI-staining (blue) shows the cell nuclei in the field of vision. The immunohistochemical staining illustrates an increased intensity of MBP in the area of the corpus callosum in the control condition for the three genotypes. In comparison with the untreated control, MBP-staining of the demyelinated condition was reduced in all genotypes, revealing efficient demyelination by cuprizone. The different genotypes behaved similarly in all four conditions. Scale bars: 100 µm. Using qPCR (B), the expression analysis of the myelin genes MBP and PLP1 was carried out in corpus callosum samples of Tnc −/− and SV129 mice in “control,” “demyelinated,” “one-week remyelinated (1 wk),” and “two-weeks remyelinated (2 wk)” conditions and was represented graphically with box plots. The expression of MBP and PLP1 was normalized with reference to the control genes RPLP0 and β-actin. The expression of myelin genes in SV129 mice was set as 1. The control condition exhibited nearly unchanged expression of MBP but significantly reduced expression of PLP1 in Tnc −/− samples compared to the SV129 wildtype. The demyelinated condition revealed a downregulation of both myelin genes in Tnc −/− in comparison with SV129 samples. After one week of remyelination, PLP1 was also downregulated in Tnc −/− samples, while MBP expression remained unchanged. After two weeks of remyelination, both genotypes did not differ. (C) The expression of both myelin genes in Tnr −/− and SV129 mice was normalized with reference to the control genes RPLP0 and β-actin. The analysis of all data and statistical significance were assessed using LightCycler®96 and Rest 2009 (*p ≤ 0.05, **p ≤ 0.01, ***p ≤ 0.001). At least three animals were included in each group (N = 3) and genotype (n = 500 cells).
FIGURE 7
FIGURE 7
(A–C) Comparison of Olig2/CC1-double immunolabeling in the corpus callosum of SV129, Tnc −/− , and Tnr −/− mice under control, demyelinated, and remyelinated conditions. (A) Using immunohistochemical labeling with antibodies against Olig2 (detects all oligodendroglia) and CC1 (detects mature oligodendrocytes), the percentage of mature oligodendrocytes in the corpus callosum of SV129, Tnc −/− , and Tnr −/− mice was compared. The four conditions “control,” “demyelinated,” “one-week remyelinated,” and “two-weeks remyelinated” were examined. DAPI-staining marks cell nuclei in blue color. Olig2 is nucleus-based staining, and CC1 is located in the cytosol. In the absence of treatment, a strong labeling of CC1-positive cells (green) was detectable in the corpus callosum (CC) of all genotypes. Mature CC1/Olig2-positive cells were reduced in the demyelinated condition. (B) Quantification of Olig2-positive cells in the particular conditions (C: control, DM: demyelinated, RM1: one-week remyelinated, RM2: two-weeks remyelinated). (C) Quantification of CC1/Olig2-double immunopositive cells. The quantification confirms a lower percentage of mature oligodendrocytes in the demyelinated condition compared to the control for all genotypes. All data are provided as mean ± SEM. The statistical significance was assessed by using the two-way ANOVA (*p ≤ 0.05, **p ≤ 0.01, ***p ≤ 0.001) and Tukey’s multiple-comparisons test. The micrograph of the illustration was captured via Axiophot. Scale bars: illustration: 100 µm detail, pictures: 50 μm; at least N = 3 animals were used for each group and genotype, and at least n = 500 cells were evaluated for each individual animal.
FIGURE 8
FIGURE 8
(A,B) Comparative analysis of Olig2/473HD-staining in the corpus callosum of SV129, Tnc −/− , and Tnr −/− mice under control, demyelinated, and remyelinated conditions. Immunohistochemical labeling (A) with antibodies against Olig2 (detects all oligodendroglia) and 473HD (detects chondroitin sulfate) of SV129, Tnc −/− , and Tnr −/− brain sections under different conditions (control, demyelinated, one-week remyelinated, two-weeks remyelinated) is shown. (B) Quantitative analysis of the 473HD fluorescence intensity (CTCF) in the corpus callosum above the region of the hippocampus. The fluorescence intensity was significantly reduced within the corpus callosum of Tnr −/− in control and demyelinated conditions. DAPI stains cell nuclei in blue. Scale bar: illustration: 100 μm, detail pictures: 50 µm. N = 3 animals were used for each group and genotype, and at least n = 500 cells were evaluated for each individual animal.

Similar articles

Cited by

References

    1. Barros C. S., Franco S. J., Muller U. (2011). Extracellular Matrix: Functions in the Nervous System. Cold Spring Harbor Perspect. Biol. 3 (1), a005108. 10.1101/cshperspect.a005108 - DOI - PMC - PubMed
    1. Bartsch S., Bartsch U., Dorries U., Faissner A., Weller A., Ekblom P., et al. (1992). Expression of Tenascin in the Developing and Adult Cerebellar Cortex. J. Neurosci. 12 (3), 736–749. 10.1523/JNEUROSCI.12-03-00736.1992 - DOI - PMC - PubMed
    1. Becker T., Anliker B., Becker C. G., Taylor J., Schachner M., Meyer R. L., et al. (2000). Tenascin-R Inhibits Regrowth of Optic Fibers In Vitro and Persists in the Optic Nerve of Mice after Injury. Glia 29 (4), 330–346. 10.1002/(sici)1098-1136(20000215)29:4<330::aid-glia4>3.0.co;2-l - DOI - PubMed
    1. Birgbauer E., Rao T. S., Webb M. (2004). Lysolecithin Induces Demyelination In Vitro in a Cerebellar Slice Culture System. J. Neurosci. Res. 78 (2), 157–166. 10.1002/jnr.20248 - DOI - PubMed
    1. Boggs J. M. (2006). Myelin Basic Protein: a Multifunctional Protein. Cell. Mol. Life Sci. 63 (17), 1945–1961. 10.1007/s00018-006-6094-7 - DOI - PMC - PubMed