

A Novel Gene Signature of Tripartite Motif Family for Predicting the Prognosis in Kidney Renal Clear Cell Carcinoma and Its Association With Immune Cell Infiltration
- PMID: 35371994
- PMCID: PMC8968921
- DOI: 10.3389/fonc.2022.840410
A Novel Gene Signature of Tripartite Motif Family for Predicting the Prognosis in Kidney Renal Clear Cell Carcinoma and Its Association With Immune Cell Infiltration
Abstract
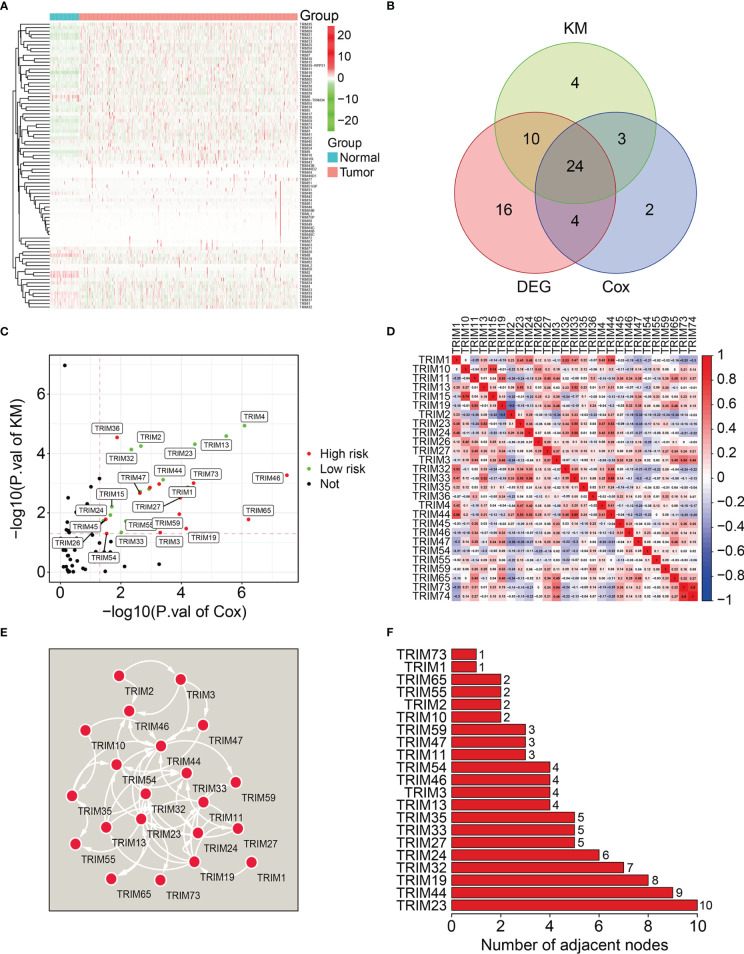
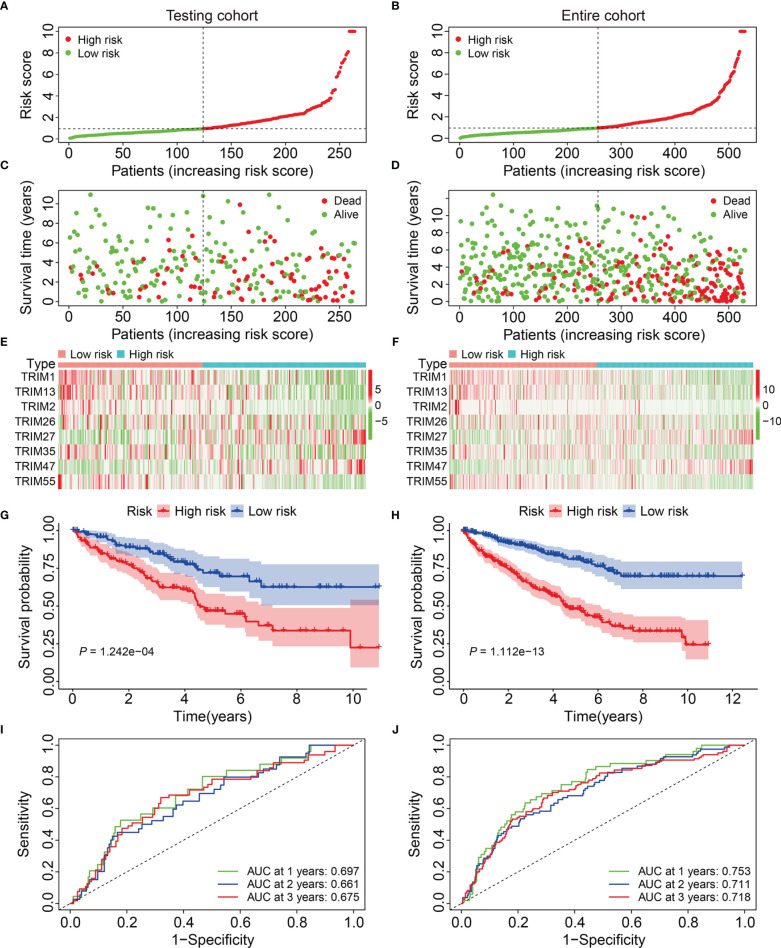
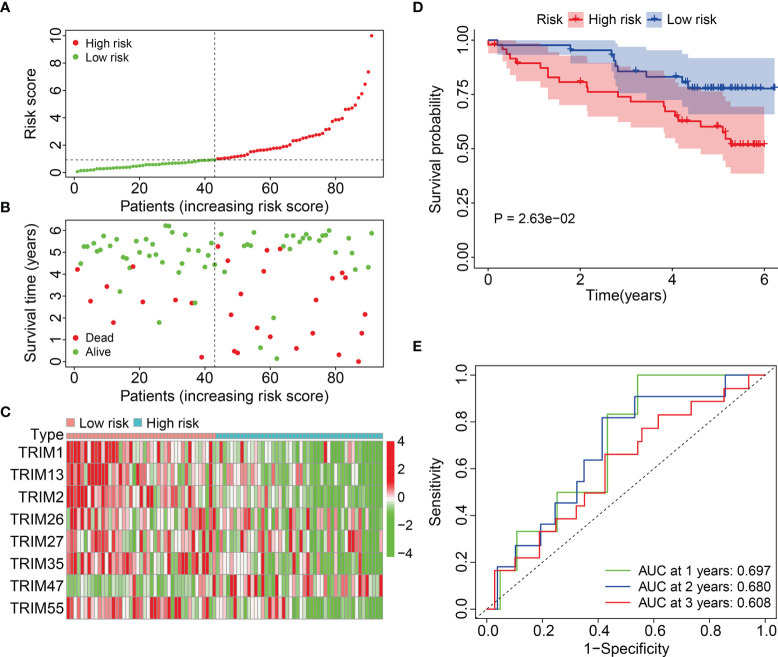
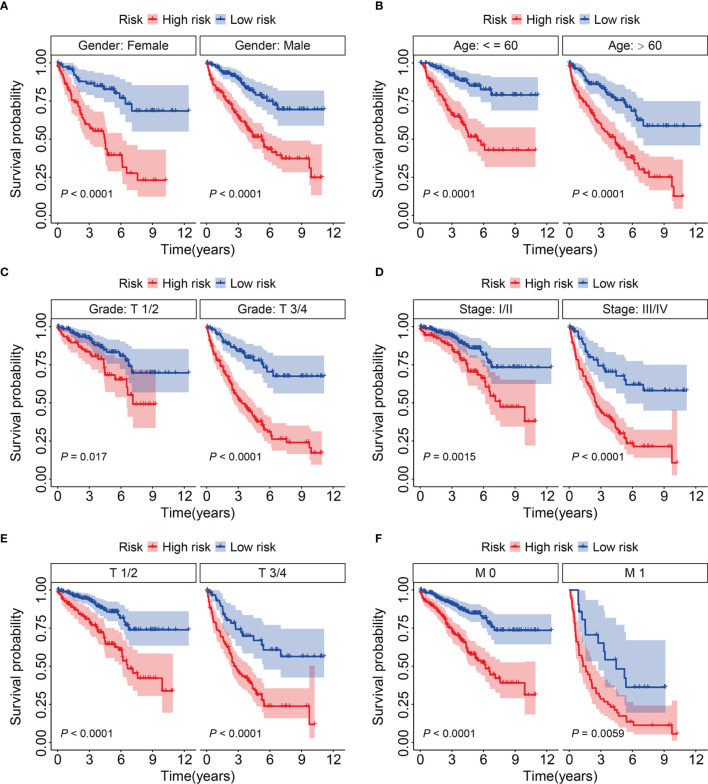
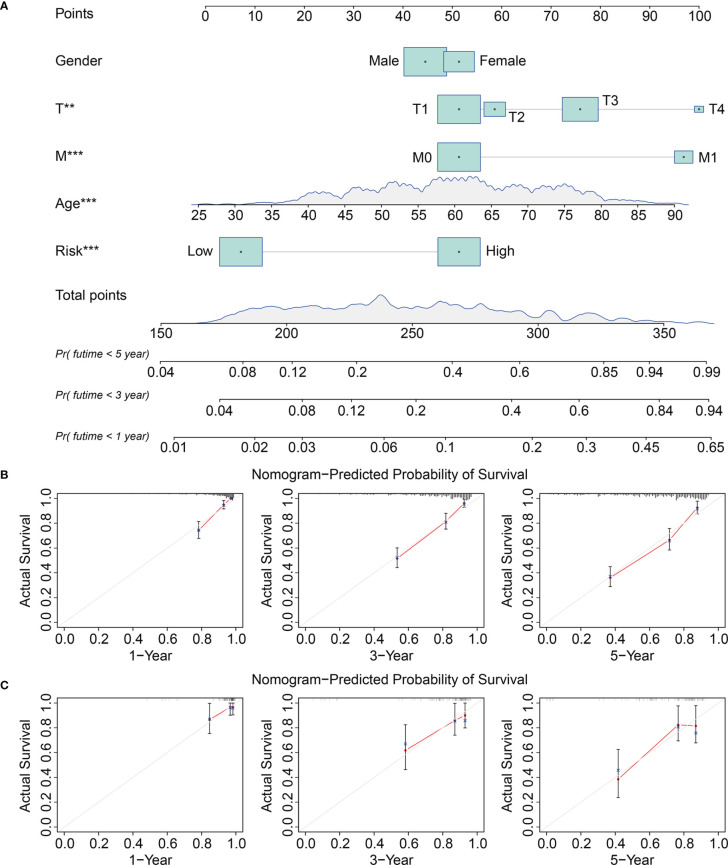
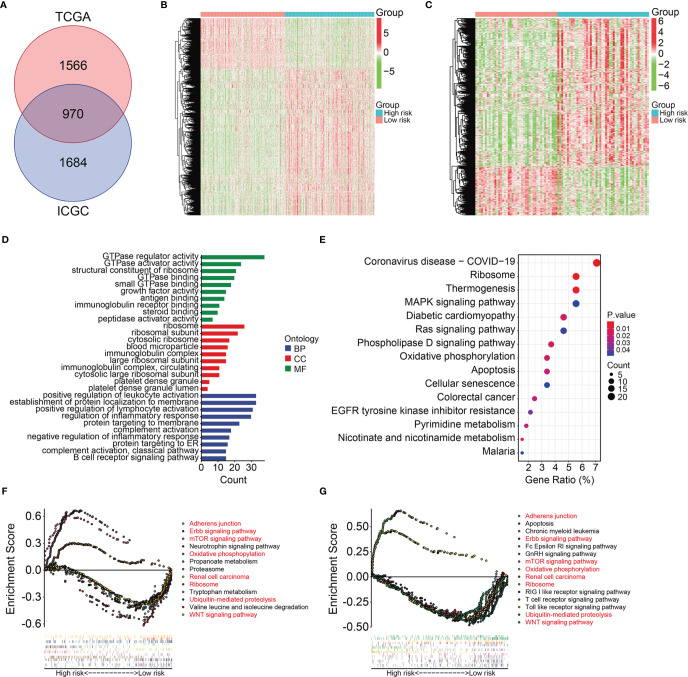
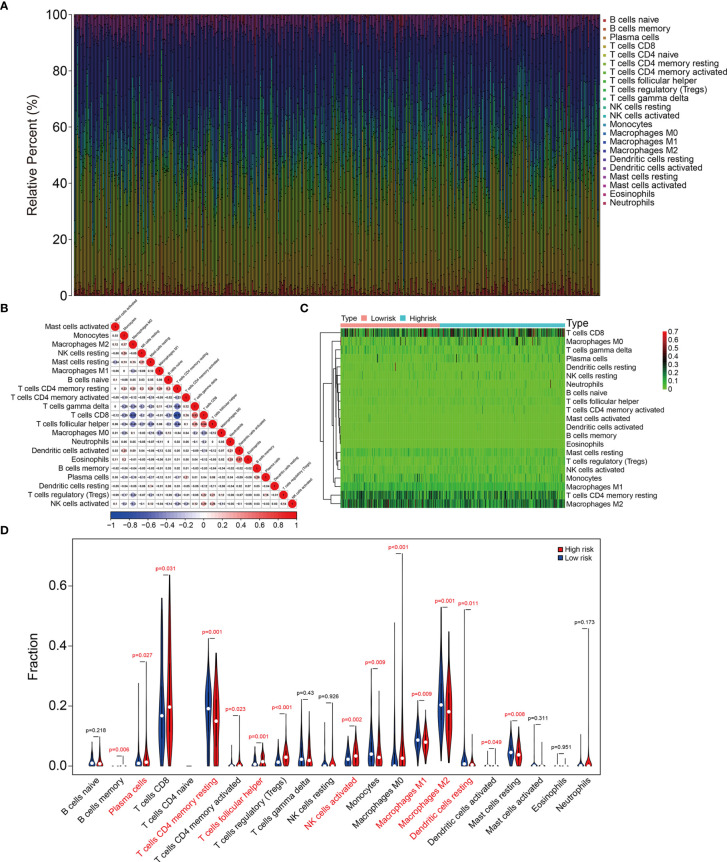
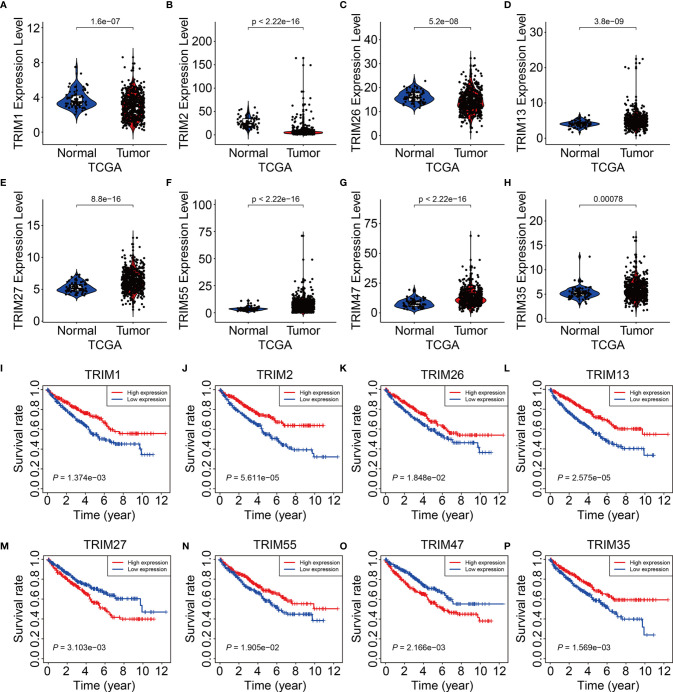
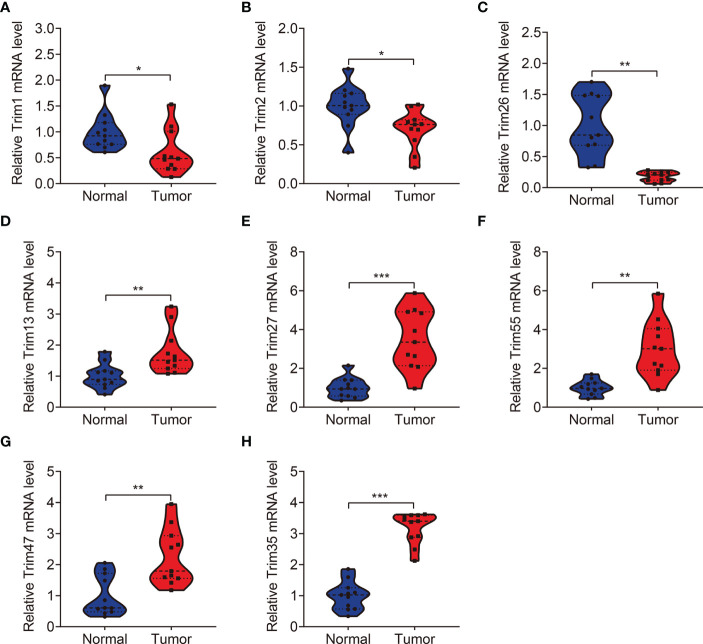
Given the importance of tripartite motif (TRIM) proteins in diverse cellular biological processes and that their dysregulation contributes to cancer progression, we constructed a robust TRIM family signature to stratify patients with kidney renal clear cell carcinoma (KIRC). Transcriptomic profiles and corresponding clinical information of KIRC patients were obtained from The Cancer Genome Atlas (TCGA) and the International Cancer Genome Consortium (ICGC) databases. Prognosis-related TRIM family genes were screened and used to construct a novel TRIM family-based signature for the training cohort. The accuracy and generalizability of the prognostic signature were assessed in testing, entire, and external ICGC cohorts. We analyzed correlations among prognostic signatures, tumor immune microenvironment, and immune cell infiltration. The results of univariate Cox regression and Kaplan-Meier survival analyses revealed 27 TRIMs that were robustly associated with the prognosis of patients with KIRC. We applied Lasso regression and multivariate Cox regression analyses to develop a prognostic signature containing the TRIM1, 13, 35, 26, 55, 2, 47, and 27 genes to predict the survival of patients with KIRC. The accuracy and generalizability of this signature were confirmed in internal and external validation cohorts. We also constructed a predictive nomogram based on the signature and the clinicopathological characteristics of sex, age, and T and M status to aid clinical decision-making. We analyzed immune cell infiltration analysis and found that CD8 T cells, memory resting CD4 T cells, and M2 macrophages were the most enriched components in the KIRC tumor immune microenvironment. A higher level of immune infiltration by plasma cells, follicular helper T cells, and activated NK cells, and a lower level of immune infiltration by memory resting CD4 T cells, M1 and M2 macrophages, and resting dendritic cells were associated with higher risk scores. Overall, our eight-gene TRIM family signature has sufficient accuracy and generalizability for predicting the overall survival of patients with KIRC. Furthermore, this prognostic signature is associated with tumor immune status and distinct immune cell infiltrates in the tumor microenvironment.
Keywords: KIRC; immune cell infiltration; prognosis; signature; tripartite motif family.
Copyright © 2022 Zheng, Zhang, Xia and Cheng.
Conflict of interest statement
The authors declare that the research was conducted in the absence of any commercial or financial relationships that could be construed as a potential conflict of interest.
Figures

Similar articles
-
Identification of a Six-Gene SLC Family Signature With Prognostic Value in Patients With Lung Adenocarcinoma.Front Cell Dev Biol. 2021 Dec 15;9:803198. doi: 10.3389/fcell.2021.803198. eCollection 2021. Front Cell Dev Biol. 2021. PMID: 34977043 Free PMC article.
-
Bioinformatics analysis of immune infiltrates and tripartite motif (TRIM) family genes in hepatocellular carcinoma.J Gastrointest Oncol. 2022 Aug;13(4):1942-1958. doi: 10.21037/jgo-22-619. J Gastrointest Oncol. 2022. PMID: 36092338 Free PMC article.
-
Comprehensive Analysis of N6-Methyladenosine-Related IncRNAs Prognostic Signature and the Associated Immune Infiltrates in Kidney Renal Clear Cell Carcinoma.Crit Rev Eukaryot Gene Expr. 2022;32(1):79-98. doi: 10.1615/CritRevEukaryotGeneExpr.2021039325. Crit Rev Eukaryot Gene Expr. 2022. PMID: 35377983
-
Immune gene signatures as prognostic criteria for cancer patients.Ther Adv Med Oncol. 2023 Aug 2;15:17588359231189436. doi: 10.1177/17588359231189436. eCollection 2023. Ther Adv Med Oncol. 2023. PMID: 37547445 Free PMC article. Review.
-
It's a TRIM-endous view from the top: the varied roles of TRIpartite Motif proteins in brain development and disease.Front Mol Neurosci. 2023 Dec 5;16:1287257. doi: 10.3389/fnmol.2023.1287257. eCollection 2023. Front Mol Neurosci. 2023. PMID: 38115822 Free PMC article. Review.
Cited by
-
TRIM family contribute to tumorigenesis, cancer development, and drug resistance.Exp Hematol Oncol. 2022 Oct 19;11(1):75. doi: 10.1186/s40164-022-00322-w. Exp Hematol Oncol. 2022. PMID: 36261847 Free PMC article. Review.
-
Multifaceted role of TRIM28 in health and disease.MedComm (2020). 2024 Nov 11;5(11):e790. doi: 10.1002/mco2.790. eCollection 2024 Nov. MedComm (2020). 2024. PMID: 39534556 Free PMC article. Review.
-
An investigation of the molecular characterization of the tripartite motif (TRIM) family and primary validation of TRIM31 in gastric cancer.Hum Genomics. 2024 Jul 9;18(1):77. doi: 10.1186/s40246-024-00631-7. Hum Genomics. 2024. PMID: 38978046 Free PMC article.
-
TRIM26 inhibits clear cell renal cell carcinoma progression through destabilizing ETK and thus inactivation of AKT/mTOR signaling.J Transl Med. 2024 May 21;22(1):481. doi: 10.1186/s12967-024-05273-w. J Transl Med. 2024. PMID: 38773612 Free PMC article.
-
A comprehensive analysis of the FOX family for predicting kidney renal clear cell carcinoma prognosis and the oncogenic role of FOXG1.Aging (Albany NY). 2022 Dec 29;14(24):10107-10124. doi: 10.18632/aging.204448. Epub 2022 Dec 29. Aging (Albany NY). 2022. PMID: 36585925 Free PMC article.
References
LinkOut - more resources
Full Text Sources
Research Materials