. 2022 Mar 15:13:732977.
doi: 10.3389/fimmu.2022.732977. eCollection 2022.

Anti-FcαRI Monoclonal Antibodies Resolve IgA Autoantibody-Mediated Disease

Affiliations

Anti-FcαRI Monoclonal Antibodies Resolve IgA Autoantibody-Mediated Disease

Amelie Bos et al. Front Immunol. .

Abstract

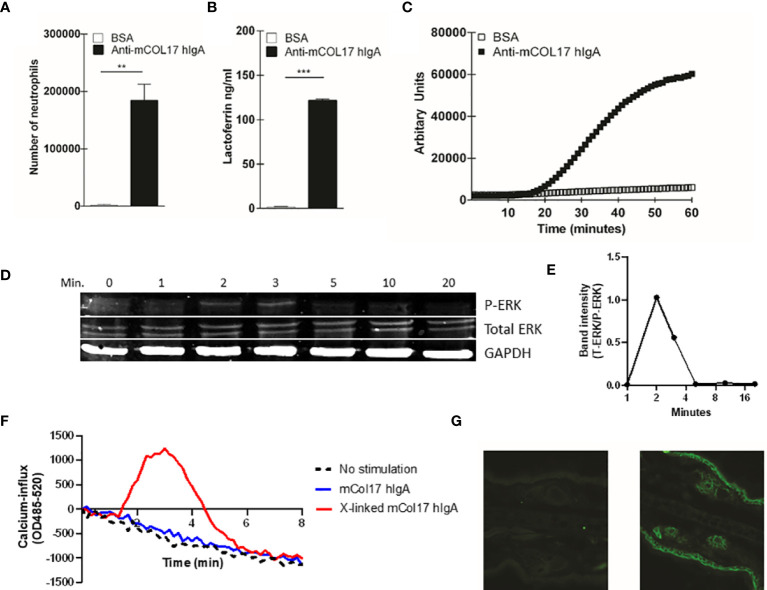
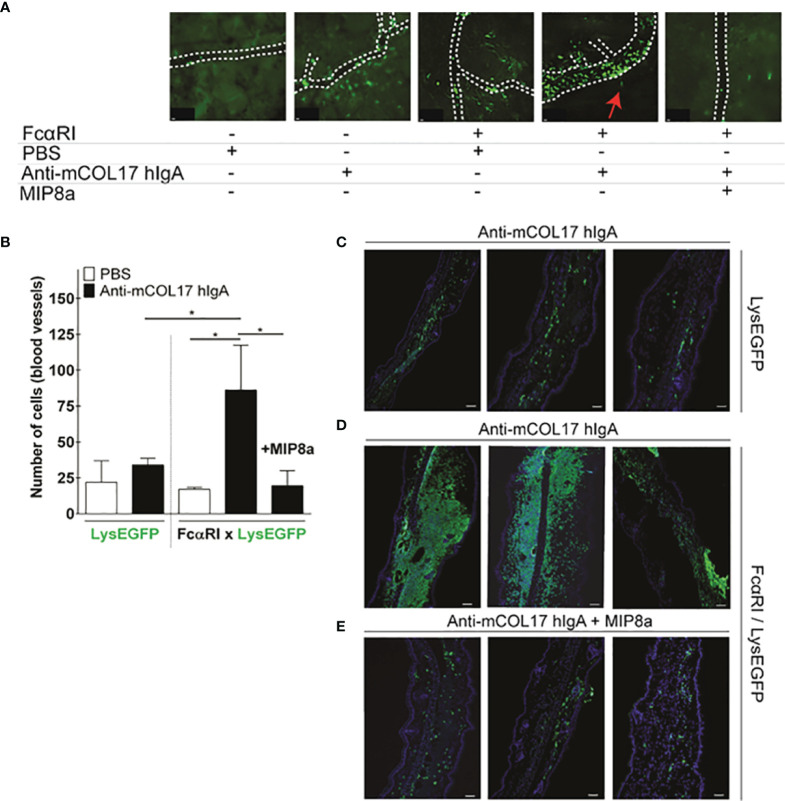
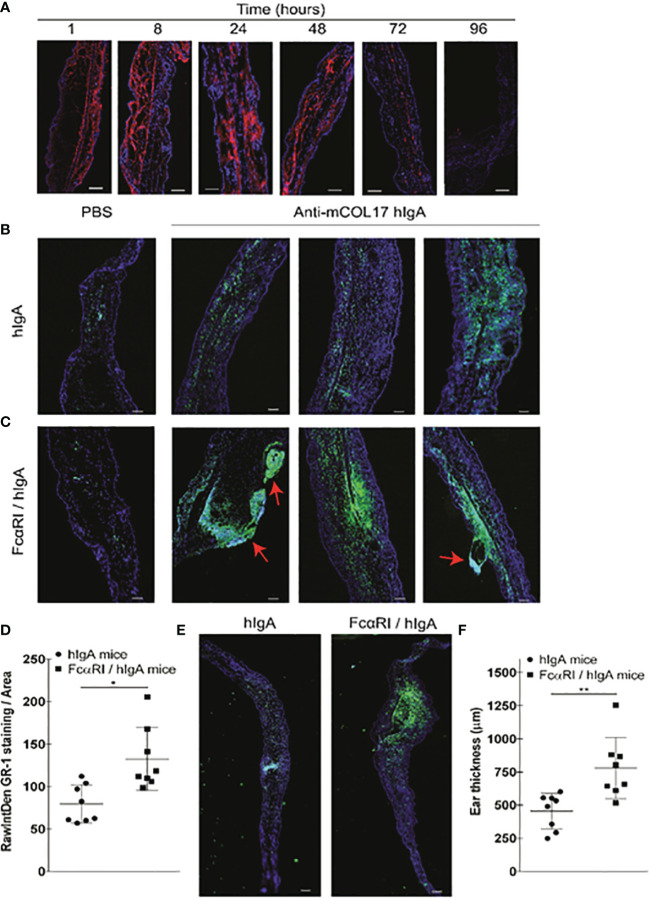
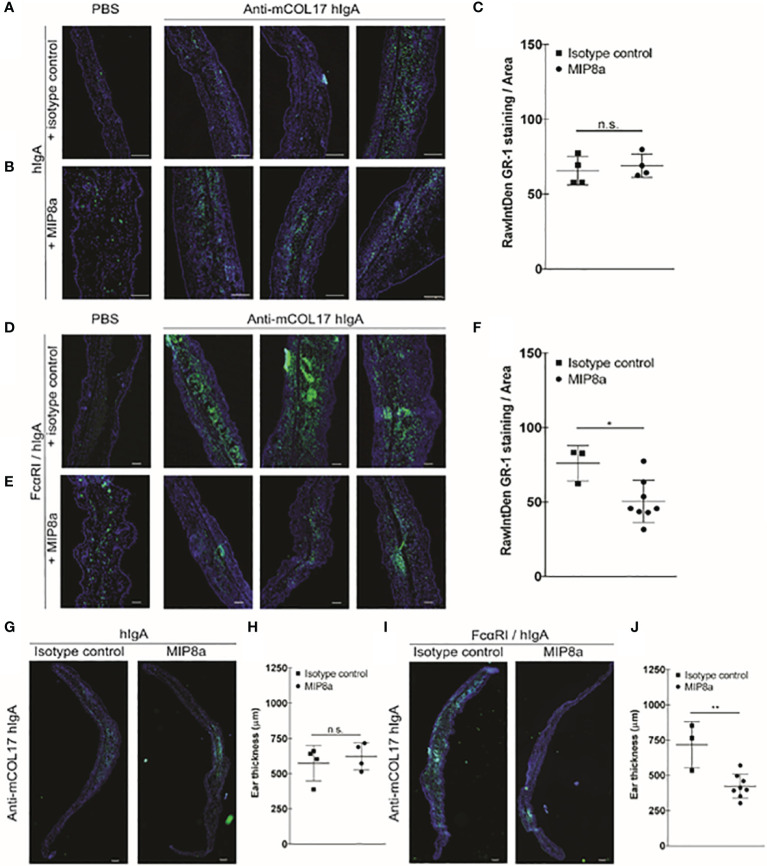
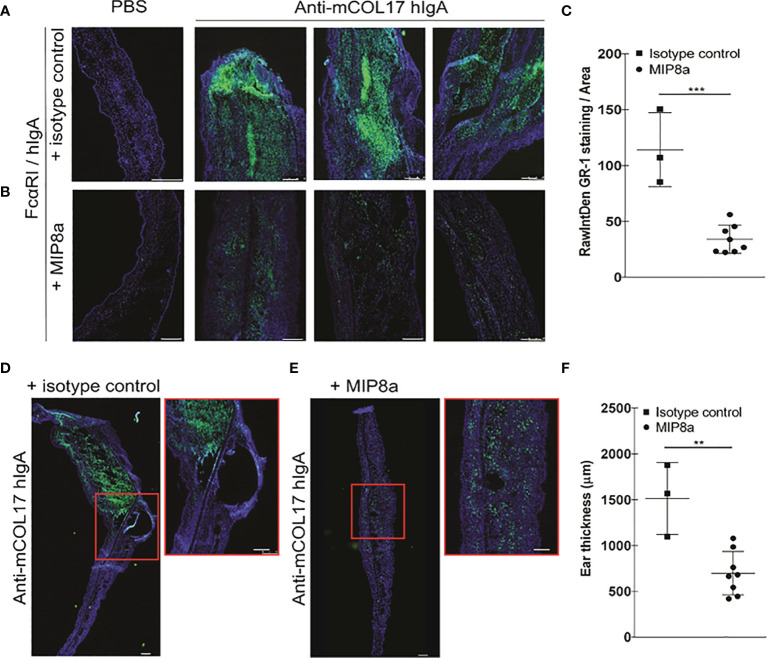
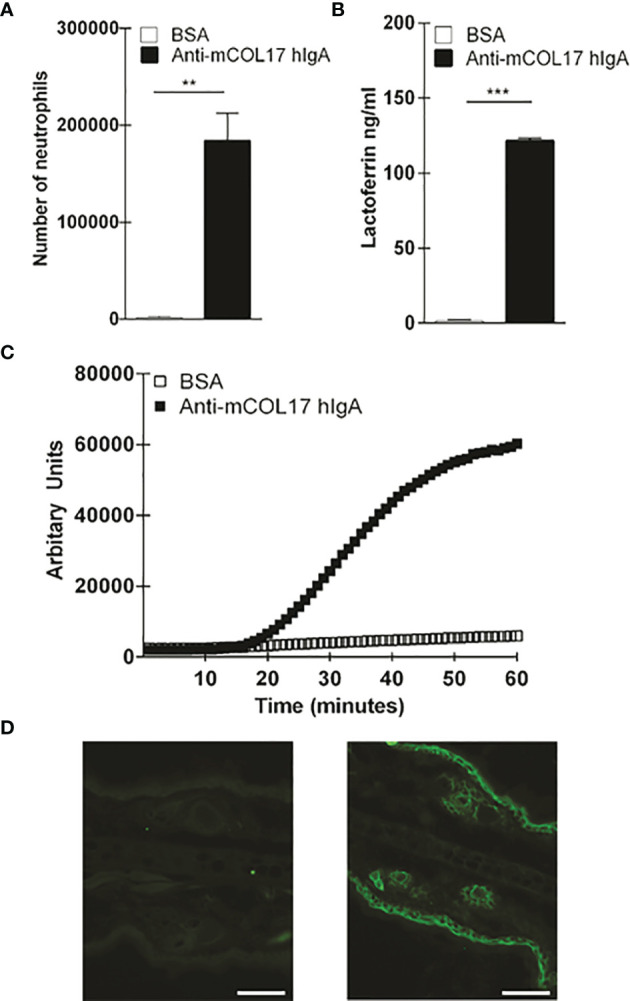
Immunoglobulin A (IgA) is generally considered as a non-inflammatory regulator of mucosal immunity, and its importance in diversifying the gut microbiota is increasingly appreciated. IgA autoantibodies have been found in several autoimmune or chronic inflammatory diseases, but their role in pathophysiology is ill-understood. IgA can interact with the Fc receptor FcαRI on immune cells. We now established a novel IgA autoimmune blistering model, which closely resembles the human disease linear IgA bullous disease (LABD) by using genetically modified mice that produce human IgA and express human FcαRI. Intravital microscopy demonstrated that presence of IgA anti-collagen XVII, - the auto-antigen in LABD-, resulted in neutrophil activation and extravasation from blood vessels into skin tissue. Continued exposure to anti-collagen XVII IgA led to massive neutrophil accumulation, severe tissue damage and blister formation. Importantly, treatment with anti-FcαRI monoclonal antibodies not only prevented disease, but was also able to resolve existing inflammation and tissue damage. Collectively, our data reveal a novel role of neutrophil FcαRI in IgA autoantibody-mediated disease and identify FcαRI as promising new therapeutic target to resolve chronic inflammation and tissue damage.

Keywords: CD89; FcαRI; IgA; LABD; neutrophils.


Conflict of interest statement

Author LB was employed by company JJP Biologics. The remaining authors declare that the research was conducted in the absence of any commercial or financial relationships that could be construed as a potential conflict of interest.

Figures

Figure 1
Figure 1
Anti-mCOL17 hlgA antibodies activate neutrophils in vitro. (A) Binding of fluorescently-labeled neutrophils to BAS or anti-mCOL17 hlgA- coated wells. (B, C) Secretion of (B) lactoferrin (as measure of degranulation) or (C) ROS production after addition of neutrophils to wells coated with BSA or anti-mCOL17 hlgA. (D, E) FcαRI on peripheral human neutrophils was stimulated with anti-mCOL17 hlgA antibodies and cross-linked for 0, 1, 2, 3, 5, 10 and 20 minutes. (D) Western blotting of phosphorylated ERK (upper panel), total ERK (middle panel) and household protein GAPDH (lower panel). Results from one donor are shown, being representative image of three donors. (E) Quantification of the ratio total ERK protein divided by phosphorylated ERK protein at indicated time points of a single donor. (F) Human neutrophils were incubated with anti-mCOL17 hlgA antibodies. Release of intracellular calcium over time was measured with (red line) or without (blue line) cross-linking. Unstimulated neutrophils served as negative control (black dotted line). (G) Human IgA staining (green fluorescence) of mouse ear cryosections incubated with (non-specific) pooled human serum IgA (left panel) or anti-mCOL17 hlgA (right panel). Scales bars: 50 μm. Data are presented as mean ± SD. Student’s t test; **p < 0.001, ***p < 0.0001.
Figure 2
Figure 2
Anti-mCOL17 hlgA antibodies induce FcαRI-dependent neutrophil recruitment. (A) Still frames from intravital imaging movies, 48 hours after injection of PBS (first panel) or anti-mCOL17 hlgA (second panel) in ears of LysEGFP mice. Ears of FcαRI/LysEGFP mice were injected with PBS (third panel), anti-mCOL17 hlgA (fourth panel) or anti-mCOL17 hlgA in combination with systematic treatment with FcαRI blocking mAb MIP8a (fifth panel). Red arrowheah indicates neutrophil extravasation (see also Supplementary Videos 1 and 2 ). Scale bars: 10 μm. (B) Quantification of neutrophil numbers in contact with blood vessels in intravital imaging movies. n = 3 per group. (C–E) Cryosection of ears of (C) LysEGFP mice injected with anti-mCOL17 hlgA, (D) FcαRI/LysEGFP mice injected with anti-mCOL17 hlgA without or (E) with treatment with anti-FcαRI mAb MIP8a. Three examples per group are shown. Cryosections were stained with the neutrophil marker GR-1 (green) and DAPI (DNA; blue). Scale bars: 75 μm. Data are presented as mean ± SD. ANOVA; *p < 0.05.
Figure 3
Figure 3
hlgA anti-mCOL17-induced neutrophil migration and chronic inflammation in FcαRI/hlgA mice. (A) Cryosections of ears of FcαRI/hlgA mice were stained with anti-human lgA (red) and DAPl (DNA; blue) after injection of anti-mCOL17 hlgA antibodies. Mice were sacrificed at indicated time points. Scale bars: 75 μm. (B, C) hlgA (B) and FcRI/hlgA (C) mice were injected with PBS (left panel) or anti-mCOL17 hlgA (right panels) every other day till sacrifice on day 7 (in total 4 injections). Cryosections were stained with the neutrophil marker GR-1 (green) and DAPl (DNA; blue). 3 representative examples are shown. Red arrowheads indicate blister formation and tissue damage. Scale bars: 100 μm. (D) Quantification of GR-1 staining. Each dot represents one mouse. N = 8 per group (E, F) Analysis of ear thickness. (E) A representative cryosection example of a hlgA mouse ear (left panel) or FcαRI/hlgA mouse ear (right panel) are shown. Scale bars: 250 μm. (F) Quantification of ear thickness. N = 8; each dot represents one mouse. Data are presented as mean ± SD. Student’s t test; *p < 0.05, **p < 0.001.
Figure 4
Figure 4
Blocking FcαRI prevents lgA-induced neutrophil accumulation and thickening ears. (A, B) hlgA and (D, E) FcαRI/hlgA mice were injected with PBS (left panels) or anti-mCOL17 hlgA (right panels, 3 examples) every other day till sacrifice on day 7 (in total 4 injections) in combination with a (A, D) isotype control antibody or (B, E) anti-FcαRI mAb MIP8a (C, F) Quantification of GR-1 staining. (G, I) Analysis of ear thickness of (G) hlgA or (I) FcαRI/hlgA mice after treatment with an isotype control (left panel) or MIP8a (right panel). A representative example of a mouse ear cryosection is shown. (H, J) Quatification of ear thickness. Each dot represents one mouse. hlgA mice (isotype control or MIP8a) n = 4; FcαRI/hlgA mice (isotype control) n = 3; FcαRI/hlgA mice (MIP8a) n = 8. Cryosection of ears were stained with the neutrophil marker GR-1 (green) and DAPl (DNA; blue). Scale bars: 250 μm (A, B, G, I) or 100 μm (D, E). Data are presented as mean ± SD. Student’s t test; *p < 0.05, **p < 0.001. n.s., not significant.
Figure 5
Figure 5
Anti-FcαRI mAbs significantly reduces lgA-induced neutrophil recruitment, existing chronic inflammation and tissue damage. FcαRI/hlgA mice were injected with PBS (left ear) or anti-mCOL17 hlgA (right ear) every other day till sacrifice on day 14 (in total 7 injections). Mice were treated with an isotype antibody or anti-FcαRI mAb MIP8a at day 8 and 11. (A, B) FcαRI/hlgA mice were treated with an isotype control (A) or with MIP8a (B). Left panels; PBS injection. Three representative examples of ears that had been injected with anti-mCOL17 hlgA are shown. (C) Quatification of GR-1 staining. (D-F) Analysis of ear thickness. A representative example of mouse ear cryosection is shown after treatment with an isotype control (D) or MIP8a (E). Inserts are magnifications. (F) Quantification of ear thickness. Each dot represents one mouse. Isotype control n = 3; MIP8a n = 8. Cryosections of ears stained for the neutrophil marker GR-1 (green) and DAPI (DNA; blue). Scale bars: 250 μm. Data are presented as mean ± SD. Student’s t test; **p < 0.05, ***p < 0.001.
Figure 6
Figure 6
Anti-mCOL17 hIgA antibodies active neutrophils in vitro. (A) Binding of fluorescently-labeled neutrophils to BSA or anti-mCOL17 hIgA-coated wells. (B, C) Secretion of (B) lactoferrin (as measure of degranulation) or (C) ROS production after addition of neutrophils to wells coated with BSA or anti-mCOL17 hIgA. (D) Huma IgA staining (green flourescene) of mouse ear cryosection incubated with (non-specific) pooled human serum IgA (left panel) or anti-mCOL17 hIgA (right panel). Scale bars: 50um. Data are presented as mean ± SD. Student's t test; **p < 0.001, ***p < 0.0001.

Similar articles

Cited by

References

    1. Pabst O, Slack E. IgA and the Intestinal Microbiota: The Importance of Being Specific. Mucosal Immunol (2020) 13(1):12–21. doi: 10.1038/s41385-019-0227-4 - DOI - PMC - PubMed
    1. Huus KE, Petersen C, Finlay BB. Diversity and Dynamism of IgA-Microbiota Interactions. Nat Rev Immunol (2021) 21:514–25. doi: 10.1038/s41577-021-00506-1 - DOI - PubMed
    1. Nakajima A, Vogelzang A, Maruya M, Miyajima M, Murata M, Son A, et al. . IgA Regulates the Composition and Metabolic Function of Gut Microbiota by Promoting Symbiosis Between Bacteria. J Exp Med (2018) 215(8):2019–34. doi: 10.1084/jem.20180427 - DOI - PMC - PubMed
    1. Kabbert J, Benckert J, Rollenske T, Hitch TCA, Clavel T, Cerovic V, et al. . High Microbiota Reactivity of Adult Human Intestinal IgA Requires Somatic Mutations. J Exp Med (2020) 217(11):1–14. doi: 10.1084/jem.20200275 - DOI - PMC - PubMed
    1. Sterlin D, Fadlallah J, Adams O, Fieschi C, Parizot C, Dorgham K, et al. . Human IgA Binds a Diverse Array of Commensal Bacteria. J Exp Med (2020) 217(3):1–17. doi: 10.1084/jem.20181635 - DOI - PMC - PubMed

LinkOut - more resources