

Key Disease Mechanisms Linked to Amyotrophic Lateral Sclerosis in Spinal Cord Motor Neurons
- PMID: 35370543
- PMCID: PMC8965442
- DOI: 10.3389/fnmol.2022.825031
Key Disease Mechanisms Linked to Amyotrophic Lateral Sclerosis in Spinal Cord Motor Neurons
Abstract
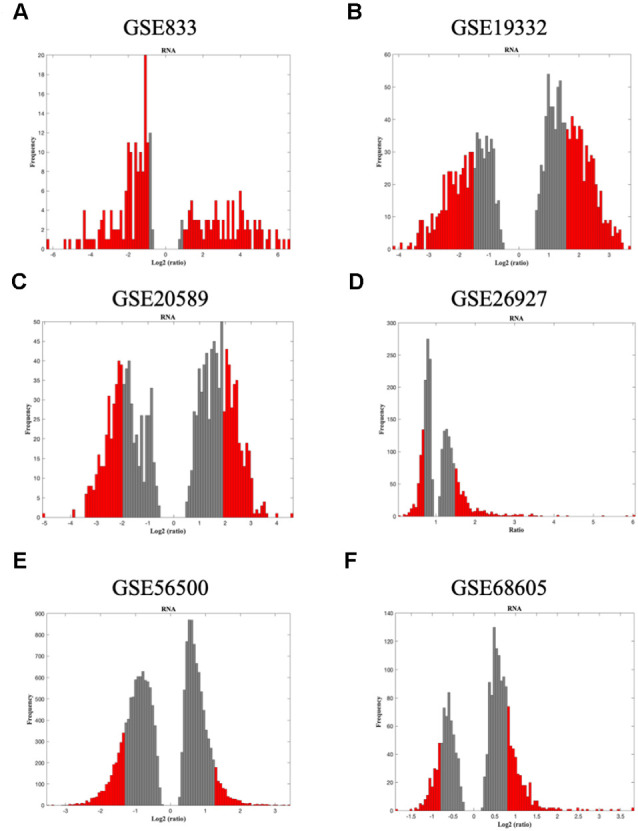
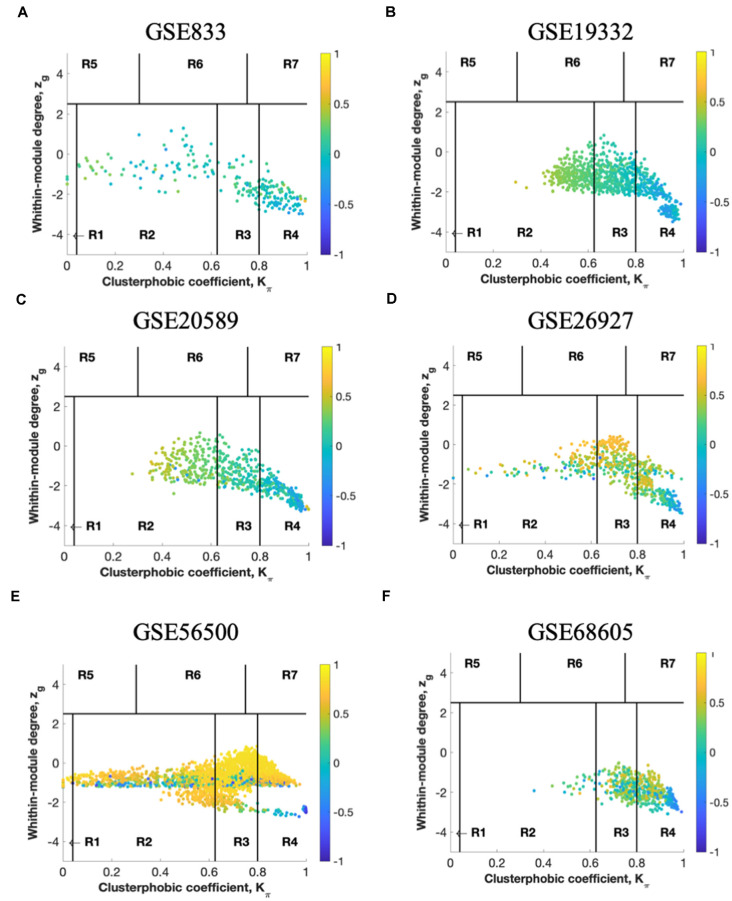
Amyotrophic lateral sclerosis (ALS) is a fatal neurodegenerative disease with no modifying treatments available. The molecular mechanisms underpinning disease pathogenesis are not fully understood. Recent studies have employed co-expression networks to identify key genes, known as "switch genes", responsible for dramatic transcriptional changes in the blood of ALS patients. In this study, we directly investigate the root cause of ALS by examining the changes in gene expression in motor neurons that degenerate in patients. Co-expression networks identified in ALS patients' spinal cord motor neurons revealed 610 switch genes in seven independent microarrays. Switch genes were enriched in several pathways, including viral carcinogenesis, PI3K-Akt, focal adhesion, proteoglycans in cancer, colorectal cancer, and thyroid hormone signaling. Transcription factors ELK1 and GATA2 were identified as key master regulators of the switch genes. Protein-chemical network analysis identified valproic acid, cyclosporine, estradiol, acetaminophen, quercetin, and carbamazepine as potential therapeutics for ALS. Furthermore, the chemical analysis identified metals and organic compounds including, arsenic, copper, nickel, and benzo(a)pyrene as possible mediators of neurodegeneration. The identification of switch genes provides insights into previously unknown biological pathways associated with ALS.
Keywords: ALS; amyotrophic lateral sclerosis; co-expression networks; motor neuron disease; network analysis; neurodegeneration; switch genes.
Copyright © 2022 Bottero, Santiago, Quinn and Potashkin.
Conflict of interest statement
JS is the founder of and employed by NeuroHub Analytics, LLC. JQ is the founder of and employed by Q Regulating Systems, LLC. The remaining authors declare that the research was conducted in the absence of any commercial or financial relationships that could be construed as a potential conflict of interest.
Figures


Similar articles
-
Network Analysis Identifies Sex-Specific Gene Expression Changes in Blood of Amyotrophic Lateral Sclerosis Patients.Int J Mol Sci. 2021 Jul 1;22(13):7150. doi: 10.3390/ijms22137150. Int J Mol Sci. 2021. PMID: 34281203 Free PMC article.
-
Neutral Lipid Cacostasis Contributes to Disease Pathogenesis in Amyotrophic Lateral Sclerosis.J Neurosci. 2020 Nov 18;40(47):9137-9147. doi: 10.1523/JNEUROSCI.1388-20.2020. Epub 2020 Oct 13. J Neurosci. 2020. PMID: 33051352 Free PMC article.
-
New insights into the gene expression associated to amyotrophic lateral sclerosis.Life Sci. 2018 Jan 15;193:110-123. doi: 10.1016/j.lfs.2017.12.016. Epub 2017 Dec 11. Life Sci. 2018. PMID: 29241710 Review.
-
Why do motor neurons degenerate? Actualization in the pathogenesis of amyotrophic lateral sclerosis.Neurologia (Engl Ed). 2019 Jan-Feb;34(1):27-37. doi: 10.1016/j.nrl.2015.12.001. Epub 2016 Feb 4. Neurologia (Engl Ed). 2019. PMID: 26853842 Review. English, Spanish.
-
Single-cell transcriptomics identifies master regulators of neurodegeneration in SOD1 ALS iPSC-derived motor neurons.Stem Cell Reports. 2021 Dec 14;16(12):3020-3035. doi: 10.1016/j.stemcr.2021.10.010. Epub 2021 Nov 11. Stem Cell Reports. 2021. PMID: 34767750 Free PMC article.
Cited by
-
Adipose mesenchymal stem cells-derived extracellular vesicles exert their preferential action in damaged central sites of SOD1 mice rather than peripherally.Eur J Histochem. 2024 Jul 4;68(3):4040. doi: 10.4081/ejh.2024.4040. Eur J Histochem. 2024. PMID: 38963135 Free PMC article.
-
Physical Activity Rewires the Human Brain against Neurodegeneration.Int J Mol Sci. 2022 Jun 2;23(11):6223. doi: 10.3390/ijms23116223. Int J Mol Sci. 2022. PMID: 35682902 Free PMC article.
-
Genome-wide association analysis reveals potential genetic correlation and causality between circulating inflammatory proteins and amyotrophic lateral sclerosis.Aging (Albany NY). 2024 May 30;16(11):9470-9484. doi: 10.18632/aging.205878. Epub 2024 May 30. Aging (Albany NY). 2024. PMID: 38819224 Free PMC article.
-
Co-Expression Network Analysis Identifies Molecular Determinants of Loneliness Associated with Neuropsychiatric and Neurodegenerative Diseases.Int J Mol Sci. 2023 Mar 21;24(6):5909. doi: 10.3390/ijms24065909. Int J Mol Sci. 2023. PMID: 36982982 Free PMC article.
-
Navigating the ALS Genetic Labyrinth: The Role of MAPT Haplotypes.Genes (Basel). 2023 Oct 30;14(11):2023. doi: 10.3390/genes14112023. Genes (Basel). 2023. PMID: 38002967 Free PMC article.
References
-
- Benedusi V., Martorana F., Brambilla L., Maggi A., Rossi D. (2012). The peroxisome proliferator-activated receptor gamma (PPARgamma) controls natural protective mechanisms against lipid peroxidation in amyotrophic lateral sclerosis. J. Biol. Chem. 287, 35899–35911. 10.1074/jbc.M112.366419 - DOI - PMC - PubMed
LinkOut - more resources
Full Text Sources
Miscellaneous