. 2022 Apr 15;208(8):1989-1997.
doi: 10.4049/jimmunol.2100794. Epub 2022 Apr 1.

Virus-Specific Regulatory T Cells Persist as Memory in a Neurotropic Coronavirus Infection

Affiliations

Virus-Specific Regulatory T Cells Persist as Memory in a Neurotropic Coronavirus Infection

Alan Sariol et al. J Immunol. .

Abstract

Regulatory T cells (Tregs) are critical for regulating immunopathogenic responses in a variety of infections, including infection of mice with JHM strain of mouse hepatitis virus (JHMV), a neurotropic coronavirus that causes immune-mediated demyelinating disease. Although virus-specific Tregs are known to mitigate disease in this infection by suppressing pathogenic effector T cell responses of the same specificity, it is unclear whether these virus-specific Tregs form memory populations and persist similar to their conventional T cell counterparts of the same epitope specificity. Using congenically labeled JHMV-specific Tregs, we found that virus-specific Tregs persist long-term after murine infection, through at least 180 d postinfection and stably maintain Foxp3 expression. We additionally demonstrate that these cells are better able to proliferate and inhibit virus-specific T cell responses postinfection than naive Tregs of the same specificity, further suggesting that these cells differentiate into memory Tregs upon encountering cognate Ag. Taken together, these data suggest that virus-specific Tregs are able to persist long-term in the absence of viral Ag as memory Tregs.


Conflict of interest statement

Conflict of interest statement: The authors have declared that no conflict of interest exists

Figures

Figure 1:
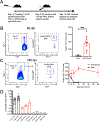
Figure 1:. Virus-specific Tregs persist long-term following infection.
1.5×10⁵ virus-specific Tregs (Foxp3-GFP+ Thy1.1+ CD4+) were sorted from M133 TCR-transgenic mice and transferred intravenously (IV) to B6 (Thy1.2) mice. Two days post-transfer, these mice were intraperitoneally (IP) infected with 1.5×10⁵ PFU JHMV or vehicle control, then sacrificed at various time points post-infection (A). Flow cytometry was used to analyze cells from the spleen at these time points, with representative flow plots at 60 days post-infection (dpi) (B) and 180 dpi (C) depicting donor Thy1.1 cells (left, gated on CD4+ T cell population) and Foxp3-GFP+ Tregs (middle, gated on Thy1.1+ population). Summary data represent numbers of Foxp3-GFP+ Thy1.1+ donor Tregs at 60 dpi (B, right) and kinetics analysis at various time points (C, right). Mice were infected with 700 PFU rJ2.2 ic (brain) or 1.5×10⁵ PFU JHMV ip (liver, spleen) and expression levels of viral genomic RNA (gRNA) as assessed by qPCR shown at indicated time points and in indicated tissues (D). Cycle threshold values (Ct) of <35 were counted as positive, with negative values plotted on the axis. n.d. (not detected). Data shown in B are representative of 2–3 independent experiments with a total of 6–11 mice per group. Data shown in C are representative of 1–3 independent experiments [0 dpi (n=8), 14 dpi (n=5–6), 30 dpi (n=3), 60 dpi (naïve n=6, JHMV-infected n=11), 180dpi (n=8, naïve group not measured)]. Data shown in D are representative of 1–2 independent experiments (n=5–9). Data represent the mean ± SEM, ***P<.001, by two-tailed Student’s t test.
Figure 2:
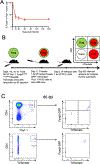
Figure 2:. Virus-specific Tregs do not lose Foxp3 expression.
Summary data of frequencies of Foxp3-GFP+ cells among Thy1.1+ donor cells described in Figure 1C (A). M133 TCR-transgenic Foxp3eGFP-cre-ERT2 Rose26-TdTomato lineage tracing mice were treated with 75 ml/kg tamoxifen IP 3x over 5 days to induce permanent TdTomato reporter expression in Tregs expressing Foxp3 at the time of induction (B). TdTomato-expressing Tregs (Foxp3-GFP+ TdTomato+ Thy1.1+ CD4+) were sorted from these mice and transferred intravenously (IV) to B6 (Thy1.2) mice. 2 days post-transfer, mice were intraperitoneally (IP) infected with 1.5×10⁵ PFU JHMV or vehicle control, then sacrificed at 60 dpi (B). Representative flow plots showing Thy1.1 donor cells (top left) and distinct populations of Foxp3-GFP+ TdTomato+ and Foxp3-GFP TdTomato cells among these donor cells (top right), as well as TdTomato+ cells (bottom left) and exclusively Foxp3-GFP+ cells within this population (bottom right) (C). These data demonstrate that the transferred TdTomato+ Tregs maintained Foxp3-GFP expression after transfer, while Foxp3-GFP cells were never TdTomato+, representing conventional CD4 T cells (Tconv). Data shown in A are representative of 1–3 independent experiments with 3–11 mice per group. Data shown in C represent 3 independent experiments. Data represent the mean ± SEM.
Figure 3:
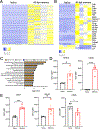
Figure 3:. Virus-specific Tregs express myeloid-like markers as well as markers of memory Tregs at late time points.
60 dpi memory Tregs and naïve counterparts were generated as described in Figure 1A and were isolated from spleens by FACS for RNA-seq analysis. Heat map show the 243 differentially expressed genes (A) and selected immunologically relevant genes (B). Most altered pathways in memory Tregs relative to naïve as analyzed by Ingenuity Pathway Analysis (C). 60 dpi memory and naïve Tregs were analyzed by flow cytometry to compare the geometric mean fluorescence intensity (gMFI) of MHC II (IA/IE) and CD36 to verify upregulation in RNA-seq analysis (D) and of the Treg memory markers CD27, CD127, and CD25 (E). Data in A-C represent 4 samples per group, with splenic Tregs sorted from 1 mouse per sample for the Naïve group and 4–5 pooled mice per sample for the 60 dpi memory group. Data in D and E represent results from 2 independent experiments with n=4 mice per group. Data represent the mean ± SEM, *P<.05, ***P<.001 by two-tailed Student’s t test.
Figure 4:
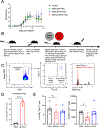
Figure 4:. Virus-specific memory Tregs proliferate more completely than their naïve counterparts.
10,000 each of Foxp3-GFP+ Tregs sorted from naive non-TCR transgenic mice (bulk), naïve M133 TCR-transgenic mice, or 60 dpi memory Tregs generated as described in Figure 1A, along with vehicle control, were transferred to naïve B6 mice. Recipient mice were infected intracranially (ic) with 700 PFU of the neuroattenuated rJ2.2 variant of JHMV and clinical scores measured as described in Materials and Methods (A). 60 dpi memory Tregs (Thy1.1/Thy1.2) and naïve Tregs (Thy1.1) were generated as described in Figure 1A. Cells were isolated from spleens by FACS, mixed in equal number (7,500 each) and stained with CellTrace proliferation dye for an in vivo proliferation assay (B). Cell mixtures were transferred to naïve B6 mice, which were then infected ic with rJ2.2. Cervical lymph nodes were harvested at 4 dpi for analysis (B). Representative flow plots showing gating of donor Tregs by Foxp3-GFP expression (left) and identification of naïve and memory donor Tregs on the basis of Thy1.1 and Thy1.2 expression (right) (C). Histogram depicts dilution of CellTrace as a measurement of cell proliferation. Summary results of data in C depicted as frequency of naïve and memory cells among Foxp3-GFP+ donor Tregs (D). 60 dpi memory Tregs and naïve Tregs were generated as described in Figure 1A. Cells were isolated from spleens by FACS and 5,000 cells were transferred separately to naïve B6 mice, which were then infected ic with rJ2.2. Brains were harvested at 5 dpi for M133 peptide stimulation and flow cytometric analysis. No AT (no adoptive transfer). Data in A are representative of two independent experiments with n=4–5 mice per group. Data in C represent combined results from 5 independent experiments with n=5 combined mice. Data in E represent combined results from 2 independent experiments with n=4–5 combined mice. Data represent the mean ± SEM, * P<.05, ****P<.0001, by two-tailed Student’s t test.

Similar articles

Cited by

  • Keeping T cell memories in mind.
    Mix MR, Harty JT. Mix MR, et al. Trends Immunol. 2022 Dec;43(12):1018-1031. doi: 10.1016/j.it.2022.10.001. Epub 2022 Nov 8. Trends Immunol. 2022. PMID: 36369103 Free PMC article. Review.

References

    1. Savage PA, Klawon DEJ, and Miller CH. 2020. Regulatory T Cell Development. Annu. Rev. Immunol 38: 421–453. - PubMed
    1. Shafiani S, Dinh C, Ertelt JM, Moguche AO, Siddiqui I, Smigiel KS, Sharma P, Campbell DJ, Way SS, and Urdahl KB. 2013. Pathogen-Specific Treg Cells Expand Early during Mycobacterium tuberculosis Infection but Are Later Eliminated in Response to Interleukin-12. Immunity 38: 1261–1270. - PMC - PubMed
    1. Fastenackels S, Bayard C, Larsen M, Magnier P, Bonnafous P, Seddiki N, Appay V, Gautheret-Dejean A, and Sauce D. 2019. Phenotypic and Functional Differences between Human Herpesvirus 6- and Human Cytomegalovirus-Specific T Cells. J. Virol 93: e02321–18. - PMC - PubMed
    1. Bedoya F, Cheng G-S, Leibow A, Zakhary N, Weissler K, Garcia V, Aitken M, Kropf E, Garlick DS, Wherry EJ, Erikson J, and Caton AJ. 2013. Viral Antigen Induces Differentiation of Foxp3+ Natural Regulatory T Cells in Influenza Virus–Infected Mice. J. Immunol 190: 6115–6125. - PMC - PubMed
    1. Zhao J, Zhao J, Fett C, Trandem K, Fleming E, and Perlman S. 2011. IFN-γ– and IL-10–expressing virus epitope-specific Foxp3+ T reg cells in the central nervous system during encephalomyelitis. J. Exp. Med 208: 1571–1577. - PMC - PubMed

Substances