. 2022 Apr 1;13(4):289.
doi: 10.1038/s41419-022-04739-3.

IL-1β-activated mTORC2 promotes accumulation of IFN-γ+ γδ T cells by upregulating CXCR3 to restrict hepatic fibrosis

Affiliations

IL-1β-activated mTORC2 promotes accumulation of IFN-γ+ γδ T cells by upregulating CXCR3 to restrict hepatic fibrosis

Qihui Liu et al. Cell Death Dis. .

Abstract

Liver fibrosis represents a severe stage of liver damage, with hallmarks of inflammation, hepatic stellate cell activation, and extracellular matrix accumulation. Although previous studies demonstrated γδ T cells are involved in liver fibrosis, the precise role and mechanisms of γδ T cells migrating to fibrotic liver have not been elucidated. Here, we aim to investigate the functional subsets of γδ T cells in hepatic fibrosis and to further explore the underlying causes and drivers of migration. In this study, we observed that γδ T cells accumulate in fibrotic liver. Adoptive transfer of γδ T, especially Vγ4 γδ T subset, can significantly alleviate liver fibrosis. In addition, CCl4 treatment also leads to activation of mTOR signaling in γδ T cells. Genetic deletion of the Rictor gene, but not Raptor, in γδ T cells markedly exacerbated liver fibrosis. Mechanistically, CCl4-induced liver injury causes macrophage accumulation in the liver, and IL-1β produced by macrophages promotes mTORC2 signaling activation in γδ T cells, which upregulates T-bet expression and eventually promotes CXCR3 transcription to drive γδ T cell migration. Moreover, hepatic γδ T cells ameliorated liver fibrosis by cytotoxicity against activated hepatic stellate cells in FasL-dependent manner, and secrete IFN-γ to inhibit the differentiation of pro-fibrotic Th17 cells. Thus, IL-1β-activated mTORC2 signaling in γδ T cells upregulates CXCR3 expression, which is critical for IFN-γ+ γδ T cells migration into the liver and amelioration of liver fibrosis. Our findings indicate that targeting the mTORC2 or CXCR3 in γδ T cells could be considered as a promising approach for γδ T cell immunotherapy against liver fibrosis.


Conflict of interest statement

The authors declare no competing interests.

Figures
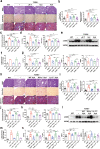
Fig. 1
Fig. 1. IFN-γ+ Vγ4 cells play a protective role in CCl4-induced liver fibrosis.
ag Wild-type (WT), TCRδ-/- or TCRδ-/- mice reconstituted with 5 × 105 γδ T cells or Vγ1 or Vγ4 cells, and repetitive CCl4 were challenged twice weekly for 4 weeks (n = 5–8/group; 3 replicates). a Representative liver histology of H&E, Sirius Red staining and Masson’s Trichrome staining (bar = 500 μm). b Sirius Red staining and Masson’s Trichrome staining were quantified by ImageJ (National Institutes of Health, MD, USA) analysis, counted in ten different fields for each sample, two samples from each mouse, and presented as fold change compared with the control. c Hydroxyproline content in liver tissues. d Serum ALT and AST levels. e, f Representative western bolt images and quantitative analysis of α-SMA expression in liver tissues. g qRT-PCR analysis of the relative expression of Col1α1, Acta2, TIMP-1 and MMP-9 in liver tissues. hn WT, TCRδ−/− or TCRδ−/− mice reconstituted with 5 × 105 WT Vγ4 or IFN-γ-/- Vγ4 or IL-17-/- Vγ4 cells, and repetitive CCl4 were challenged twice weekly for 4 weeks (n = 6/group; 3 replicates). h Representative liver histology of H&E, Sirius Red staining and Masson’s Trichrome staining (bar = 500 μm). i Sirius Red staining and Masson’s Trichrome staining were quantified by ImageJ. j Hydroxyproline content in liver tissues. k Serum ALT and AST levels. l, m Representative western bolt images and quantitative analysis of α-SMA expression in liver tissues. n qRT-PCR analysis of the relative expression of Col1α1, Acta2, TIMP-1 and MMP-9 in mouse liver. H&E hematoxylin and eosin, ALT alanine aminotransferase, CCl4 carbon tetrachloride, qRT-PCR quantitative reverse-transcription PCR, WT wild-type. Data are presented as the mean ± SD. *P < 0.05, **P < 0.01, and ***P < 0.001 in comparison with the corresponding controls, by unpaired Student’s t-test between two groups or one-way ANOVA for comparison of two or multiple groups, respectively.
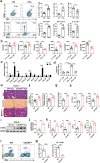
Fig. 2
Fig. 2. CXCR3-mediated IFN-γ+ γδ T cells accumulated in chronic liver injury.
ac WT mice were treated with CCl4 twice weekly for 4 weeks (n = 7/group; 3 replicates). a Representative FACS plots of γδ T cells, IFN-γ and IL-17A in γδ T cells in the liver of WT mice treated with Oil or CCl4. CD45+ CD3e+ TCR δ+ cells were gated. Statistical analysis of the percentage and the absolute cell number of γδ T cells in CD3+ leukocytes, IFN-γ and IL-17A in γδ T cells in liver tissue. b The mean fluorescence intensity (MFI) was determined by flow cytometry showing the expression of CCR2, CCR5, CCR6, CXCR3, CXCR5, and CXCR6 on IFN-γ+ γδ T and IL-17+ γδ T cell subsets in liver form CCl4-treated mice. c qRT-PCR analysis of the relative expression of chemokine genes in mouse liver form Oil or CCl4-treated mice. d IFN-γ+ Vγ4, IFN-γ Vγ4, IL-17+ Vγ4 and IL-17- Vγ4 cells were sorted from IFN-γ-eYPF and IL-17-GPF mice, respectively, and those cells in response to CXCL10 (100 ng/mL) were assessed in transwell chambers for 3 h. em TCRδ-/- mice were reconstituted with 5 × 105 WT Vγ4 or CXCR3KO Vγ4 cells, and repetitive CCl4 were challenged twice weekly for 4 weeks (n = 5–6/group; 3 replicates). e Representative liver histology of H&E, Sirius Red staining and Masson’s Trichrome staining (bar = 500 μm). f Sirius Red staining and Masson’s Trichrome staining were quantified by ImageJ. g Hydroxyproline content in liver tissues. h Serum ALT and AST levels. i, j Representative western bolt images and quantitative analysis of α-SMA expression in liver tissues. k qRT-PCR analysis of the relative expression of Col1α1, Acta2, TIMP-1 and MMP-9 in mouse liver. l Representative FACS plots of γδ T cells in the liver of TCRδ-/- mice reconstituted with WT and CXCR3KO Vγ4 cells. CD45+ CD3e+ TCRδ+ cells were gated. m Statistical analysis of the percentage and absolute cell number of γδ T cells in CD45+ leukocytes in liver tissue. Data are shown as mean ± SD. *P < 0.05, **P < 0.01, and ***P < 0.001 in comparison with the corresponding controls, by unpaired Student’s t-test between two groups.
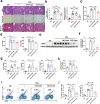
Fig. 3
Fig. 3. mTORC2-mediated signaling is critical for the migration of γδ T cells into the injured liver by increasing chemokine receptor expression.
a Representative histograms and b MFI of p-S6 (ser235/236) and p-AKT (pS473) on γδ T, Vγ1 and Vγ4 cell subsets in the liver form Oil or CCl4-treated mice. CD45+ CD3e+ TCRδ+ cells were gated. c RNAseq heatmap of differentially expressed genes in samples of Ricf/f (n = 6 mice per sample), RicKO (n = 5 mice per sample) γδ T cells isolated from pooled spleens. Expression of chemokine receptor genes for γδ T cells was shown. d The MFI was determined by flow cytometry showing the expression of CCR2, CCR4, CCR5, CCR6, CXCR3, CXCR5 and CXCR6 molecule expression on γδ T cells from Ricf/f and RicKO mice. ei TCRδ-/- mice were reconstituted with Ricf/f Vγ4 or RicKO Vγ4 cells, and repetitive CCl4 were challenged twice weekly for 4 weeks. e Representative liver histology of H&E, Sirius Red staining and Masson’s Trichrome staining. f Sirius Red staining and Masson’s Trichrome staining were quantified by ImageJ. g Serum ALT and AST levels. h Hydroxyproline content in liver tissues. i qRT-PCR analysis of the relative expression of Col1α1, Acta2, TIMP-1 and MMP-9 in mouse liver. j, k Representative western bolt images and quantitative analysis of α-SMA expression in liver tissues. l Representative FACS plots, statistical analysis of the percentage and the absolute cell number of γδ T cells in the liver. m Experimental scheme. Vγ4 cells from CD45.1(WT) and CD45.2 mice (Ricf/f or RicKO) were isolated and mixed at a ratio of 1:1 and injected (i.v.) into TCR δ-/- hosts, and then host mice were injected (i.p) with a single dose of CCl4 for 24 h to induce liver injury. n Representative FACS plots of CD45.1+ Vγ4 and CD45.2+ Vγ4 cells were shown, and the percentages of donor-derived Vγ4 cells in the liver of the recipient mice were calculated. Data are shown as mean ± SD. *P < 0.05, **P < 0.01, and ***P < 0.001 in comparison with the corresponding controls, by unpaired Student’s t-test between two groups.
Fig. 4
Fig. 4. IL-1β-induced γδ T cell mTOR-signaling activation and chemokine receptor expression.
a Serum was collected at the indicated time points after CCl4 treatment (n = 5/group; 3 replicates), and serum levels of IL-1β were determined by using enzyme-linked immunosorbent assay (ELISA) kits according to manufacturer’s instructions. b Statistical analysis of the percentage and the absolute cell number of γδ T cells in liver tissue at indicated time points after CCl4 treatment. ce Whole spleen cell suspensions from C57BL/6 WT mice were stimulated with or without IL-1β (10 ng/mL) for 30 min, c representative histograms and d MFI of p-S6 (ser235/236) and p-AKT (pS473) in γδ T, Vγ1 and Vγ4 cell subsets in IL-1β treated splenocytes. e The MFI was determined by flow cytometry showing the expression of CCR2, CCR4, CCR5, CCR6, CXCR3, CXCR5 and CXCR6 on γδ T cells in IL-1β treated splenocytes. Data are shown as mean ± SD. *P < 0.05, **P < 0.01, and ***P < 0.001 in comparison with the corresponding controls, by unpaired Student’s t-test between two groups.
Fig. 5
Fig. 5. Macrophage-derived IL-1β contributes to γδ T cell migration by activating mTORC2 signaling.
aj WT mice were administered an intravenous injection of clodronate-loaded liposome (Clo-lip) of 50 mg kg−1 24 h before CCl4 treatment; liposome vehicle (lip) served as a control (n = 4–6/group; 3 replicates). a Representative liver histology of H&E, Sirius Red staining and Masson’s Trichrome staining (bar = 500 μm). b Sirius Red staining and Masson’s Trichrome staining were quantified by ImageJ. c Hydroxyproline content in liver tissues. d Serum ALT and AST levels. e, f Representative western bolt images and quantitative analysis of α-SMA expression in liver tissues. g Serum levels of IL-1β, IL-6 and IL-12 p70 were determined by using ELISA kits. h MFI of p-S6 (ser235/236) and p-AKT (pS473) on γδ T in liver tissue. i Representative FACS plots. j Statistical analysis of the percentage and the absolute cell number of γδ T cells in the liver. Data are shown as mean ± SD. *P < 0.05, **P < 0.01, and ***P < 0.001 in comparison with the corresponding controls, by one-way ANOVA for comparison of multiple groups.
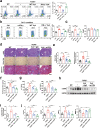
Fig. 6
Fig. 6. γδ T cells attenuate liver fibrosis via suppression of Th17 cells.
a Representative FACS plots of IFN-γ and IL-17A in CD4+ T cells of WT and TCR δ-/- mice reconstituted with Vγ4 cells from WT or IFN-γ-/- mice after repetitive CCl4 challenge for 4 weeks analyzed by flow cytometry (n = 5/group; 3 replicates). Lymphocytes were gated on the basis of FAC-A and SSC-A, doublets (FSC-H and FSC-A gating) were excluded from the analysis, and then CD45+ CD3e+ CD4+ CD8-FVD- cells were gated and analyzed. b, c Splenic CD4+ T cells from WT mice were cultured in Th17 conditions (anti-CD3 mAb, anti-CD28 mAb, TGF-β, IL-6 and anti-IL-4 mAb) with/without anti-IFN-γ mAb, WT γδ T cells or IFN-γ-/- Vγ4 cells for 96 h. Cells were stained for CD3e, CD4, IL-17A and analyzed by flow cytometry. b Representative FACS plots of IL-17A in CD4+ T cells, and c qRT-PCR analysis of the relative expression of Rorc and Gata3 in CD4+ T cells. dj WT, TCR δ-/- mice, TCR δ-/- mice reconstituted with Vγ4 cells with/without anti-CD4 treatment after repetitive CCl4 challenge for 4 weeks (n = 6–7/group; 3 replicates). d Representative liver histology of H&E, Sirius Red staining and Masson’s Trichrome staining in liver tissue. e Sirius Red staining and Masson’s Trichrome staining were quantified by ImageJ analysis. f Hydroxyproline content in liver tissues. g Serum ALT and AST levels were measured. h, i Representative western bolt images and quantitative analysis of α-SMA expression in liver tissues. j qRT-PCR analysis of the relative expression of Col1α1, Acta2, TIMP-1 and MMP-9 in liver tissue. Data are representative of at least three independent experiments. Data are shown as mean ± SD. *P < 0.05, **P < 0.01, and ***P < 0.001 in comparison with the corresponding controls, by one-way ANOVA for comparison of multiple groups.
Fig. 7
Fig. 7. Schematic diagram of mTORC2 signaling mediates γδ T cells migration into the fibrotic liver.
The hepatic immune microenvironment mediates chronic damage (e.g., alcohol and virus infection, etc.) induced hepatocyte injury, driving fibrogenesis by HSC activation. Resident hepatic macrophages, Kupffer cells (KC), are an important sensor of tissue injury. They become activated via pathogen-associated molecular patterns (PAMPs) from invading pathogens, by danger-associated molecular patterns (DAMPs) released from injured hepatocytes, proinflammatory cytokine (IL-1β) released from activated KC and infiltrating macrophage (IM) can initiate the γδ T cells CXCR3 expression by inducing mTORC2 activation, which in combination with the chemokines (CXCL9, CXCL10 and CXCL20, etc.) secreted by apoptotic hepatocytes and hepatic macrophages can stimulate the migration of γδ T cells into the fibrotic liver. Moreover, infiltrated γδ T cells exhibited potent cytotoxicity against activated aHSCs by Fas-FasL-dependent manner. Moreover, IFN-γ+ γδ T cells producing high levels of IFN-γ suppressed Th17 cell differentiation to ameliorate liver fibrosis. HSC hepatic stellate cells, KC Kupffer cell, IM infiltrating macrophage.

Similar articles

Cited by

References

    1. Wynn TA, Ramalingam TR. Mechanisms of fibrosis: therapeutic translation for fibrotic disease. Nat Med. 2012;18:1028–40. doi: 10.1038/nm.2807. - DOI - PMC - PubMed
    1. Pellicoro A, Ramachandran P, Iredale JP, Fallowfield JA. Liver fibrosis and repair: immune regulation of wound healing in a solid organ. Nat Rev Immunol. 2014;14:181–94.. doi: 10.1038/nri3623. - DOI - PubMed
    1. Liu X, Xu J, Rosenthal S, Zhang LJ, McCubbin R, Meshgin N, et al. Identification of lineage-specific transcription factors that prevent activation of hepatic stellate cells and promote fibrosis resolution. Gastroenterology. 2020;158:1728–44. doi: 10.1053/j.gastro.2020.01.027. - DOI - PMC - PubMed
    1. Luo X, Li H, Ma L, Zhou J, Guo X, Woo SL, et al. Expression of STING is increased in liver tissues from patients with NAFLD and promotes macrophage-mediated hepatic inflammation and fibrosis in mice. Gastroenterology. 2018;155:1971–84. doi: 10.1053/j.gastro.2018.09.010. - DOI - PMC - PubMed
    1. Zhou Z, Xu MJ, Cai Y, Wang W, Jiang JX, Varga ZV, et al. Neutrophil-hepatic stellate cell interactions promote fibrosis in experimental steatohepatitis. Cell Mol Gastroenterol Hepatol. 2018;5:399–413. doi: 10.1016/j.jcmgh.2018.01.003. - DOI - PMC - PubMed

Publication types

MeSH terms

Substances