. 2022 Mar 8:9:813215.
doi: 10.3389/fcvm.2022.813215. eCollection 2022.

Novel Nongenetic Murine Model of Hyperglycemia and Hyperlipidemia-Associated Aggravated Atherosclerosis

Affiliations

Novel Nongenetic Murine Model of Hyperglycemia and Hyperlipidemia-Associated Aggravated Atherosclerosis

Susanne Gaul et al. Front Cardiovasc Med. .

Abstract

Objective: Atherosclerosis, the main pathology underlying cardiovascular diseases is accelerated in diabetic patients. Genetic mouse models require breeding efforts which are time-consuming and costly. Our aim was to establish a new nongenetic model of inducible metabolic risk factors that mimics hyperlipidemia, hyperglycemia, or both and allows the detection of phenotypic differences dependent on the metabolic stressor(s).

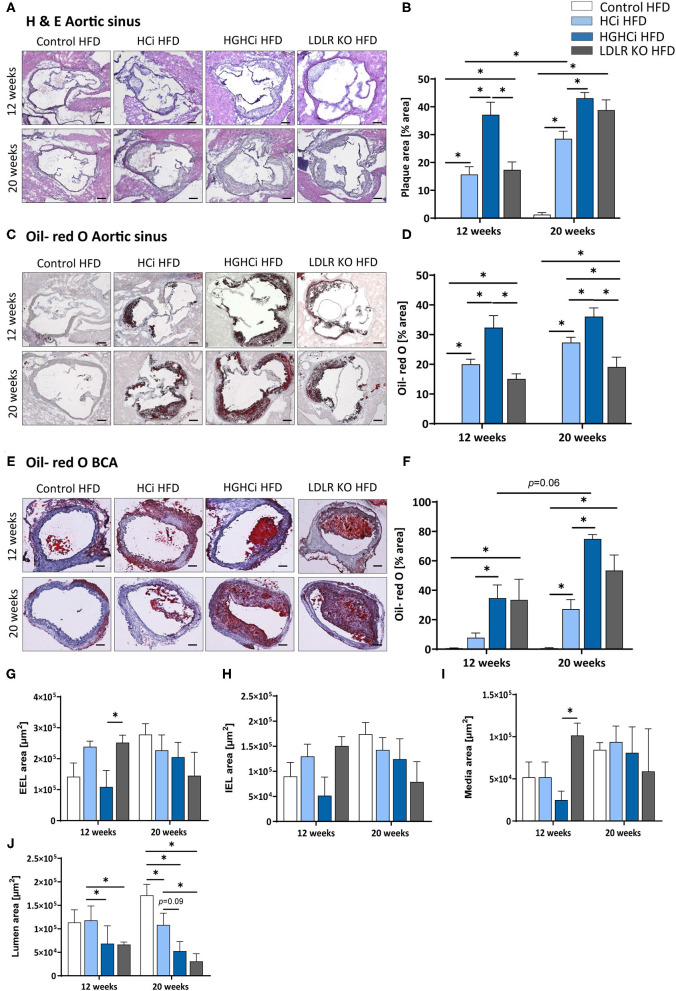
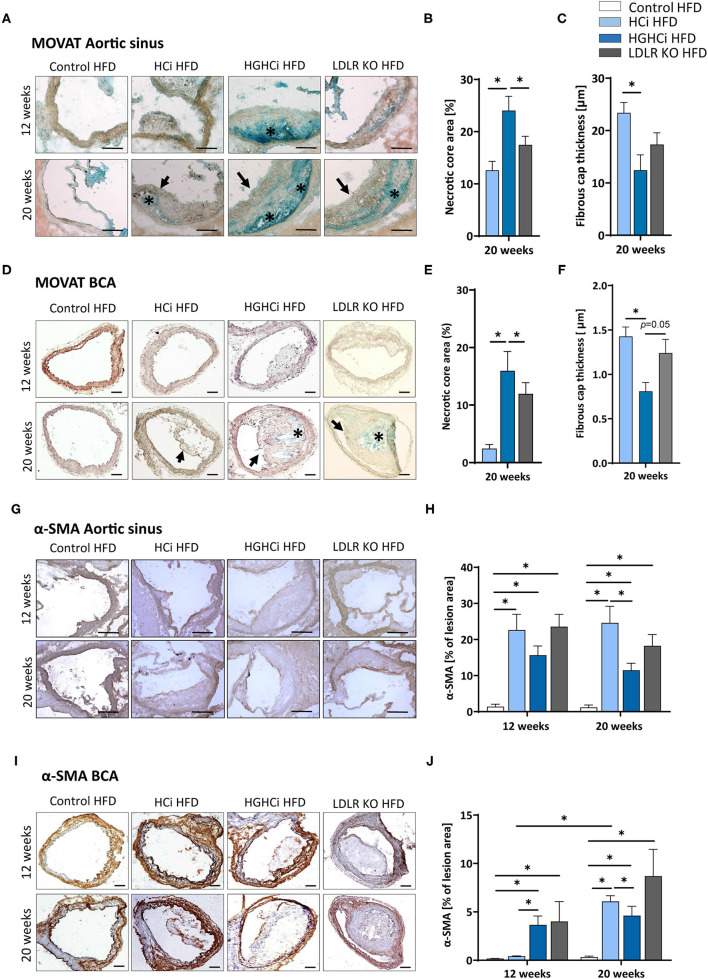
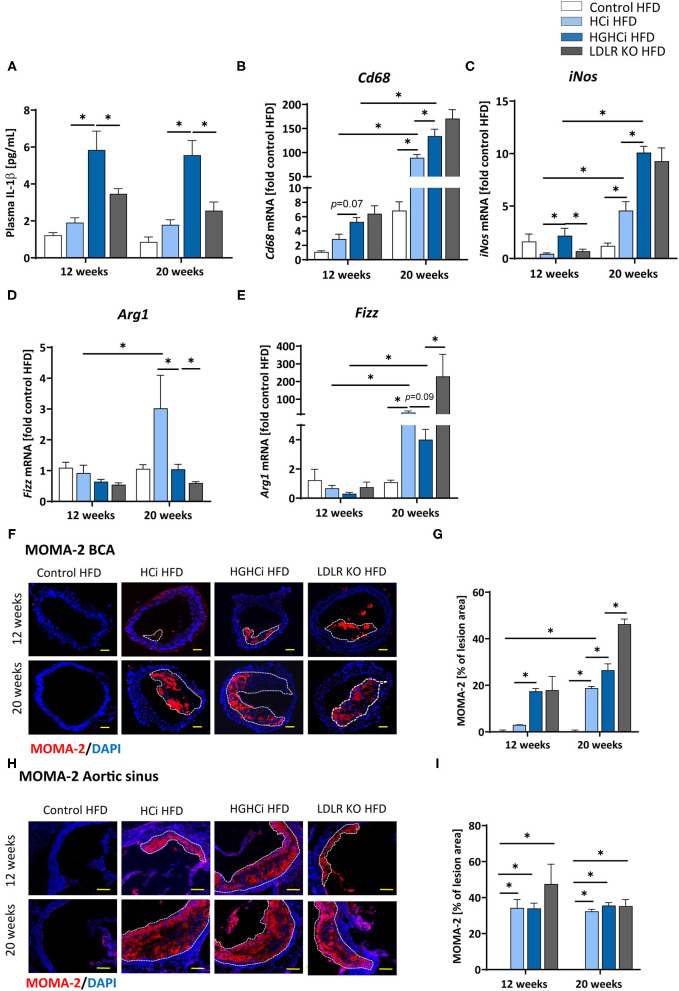
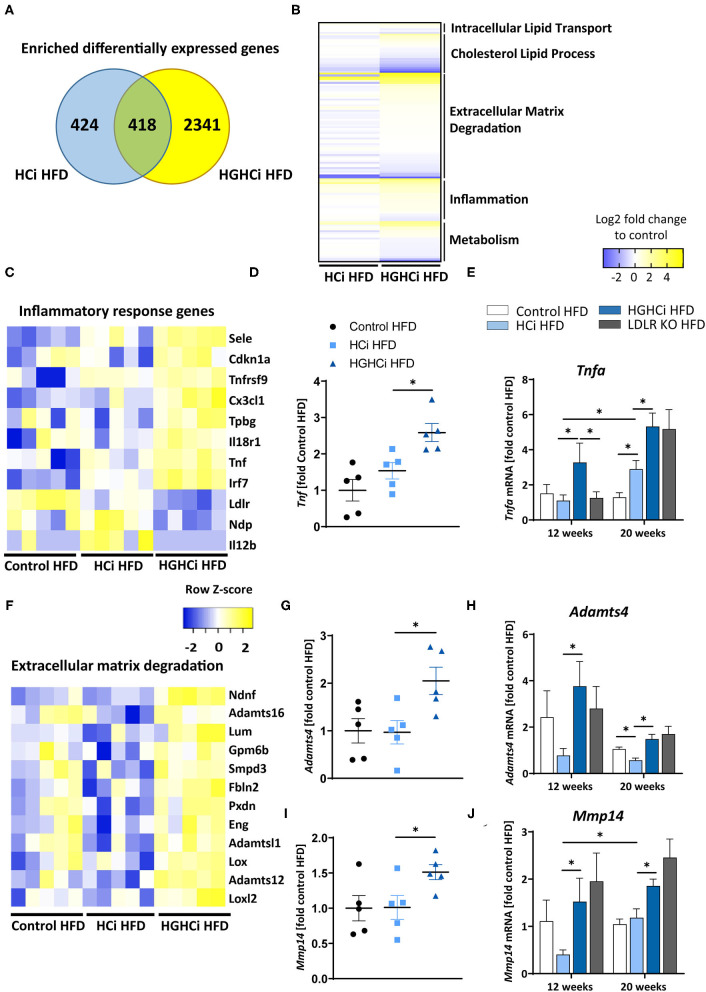
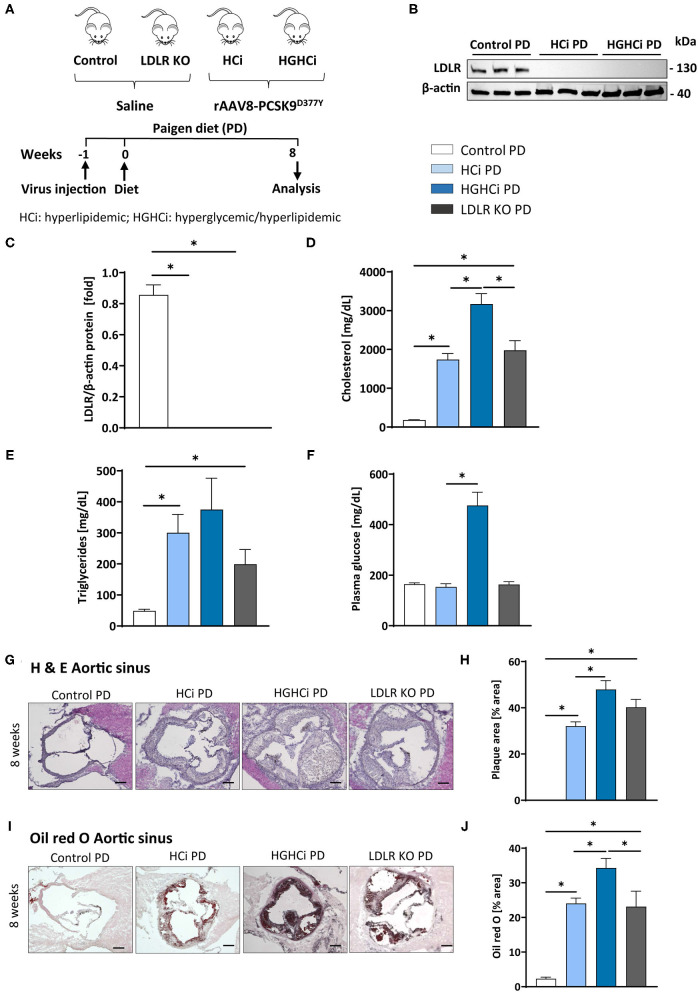
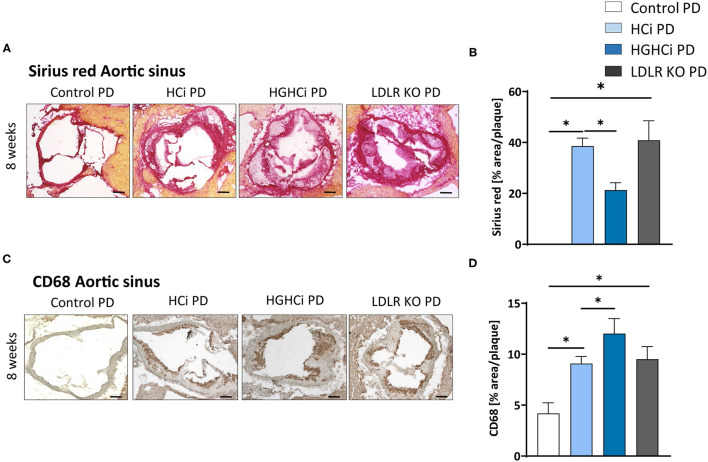
Methods and results: Wild-type mice were injected with gain-of-function PCSK9D377Y (proprotein convertase subtilisin/kexin type 9) mutant adeno-associated viral particles (AAV) and streptozotocin and fed either a high-fat diet (HFD) for 12 or 20 weeks or a high-cholesterol/high-fat diet (Paigen diet, PD) for 8 weeks. To evaluate atherosclerosis, two different vascular sites (aortic sinus and the truncus of the brachiocephalic artery) were examined in the mice. Combined hyperlipidemic and hyperglycemic (HGHCi) mice fed a HFD or PD displayed characteristic features of aggravated atherosclerosis when compared to hyperlipidemia (HCi HFD or PD) mice alone. Atherosclerotic plaques of HGHCi HFD animals were larger, showed a less stable phenotype (measured by the increased necrotic core area, reduced fibrous cap thickness, and less α-SMA-positive area) and had more inflammation (increased plasma IL-1β level, aortic pro-inflammatory gene expression, and MOMA-2-positive cells in the BCA) after 20 weeks of HFD. Differences between the HGHCi and HCi HFD models were confirmed using RNA-seq analysis of aortic tissue, revealing that significantly more genes were dysregulated in mice with combined hyperlipidemia and hyperglycemia than in the hyperlipidemia-only group. The HGHCi-associated genes were related to pathways regulating inflammation (increased Cd68, iNos, and Tnfa expression) and extracellular matrix degradation (Adamts4 and Mmp14). When comparing HFD with PD, the PD aggravated atherosclerosis to a greater extent in mice and showed plaque formation after 8 weeks. Hyperlipidemic and hyperglycemic mice fed a PD (HGHCi PD) showed less collagen (Sirius red) and increased inflammation (CD68-positive cells) within aortic plaques than hyperlipidemic mice (HCi PD). HGHCi-PD mice represent a directly inducible hyperglycemic atherosclerosis model compared with HFD-fed mice, in which atherosclerosis is severe by 8 weeks.

Conclusion: We established a nongenetically inducible mouse model allowing comparative analyses of atherosclerosis in HCi and HGHCi conditions and its modification by diet, allowing analyses of multiple metabolic hits in mice.

Keywords: PCSK9; animal model of disease; atherosclerosis; diabetes; hyperglycemia; hyperlipidemia; streptozotocin.


Conflict of interest statement

The authors declare that the research was conducted in the absence of any commercial or financial relationships that could be construed as a potential conflict of interest.

Figures

Figure 1
Figure 1
Simultaneous treatment of rAAV8-PCSK9 virus and Streptozotocin induces a hyperlipidemic and hyperglycemic mouse phenotype. (A) Schematic summary of the experimental setup. Mice were analyzed after 12 or 20 weeks of interventions initiation. Wild type mice without rAAV8-PCSK9D377Y injection on high-fat diet (HFD, 21% fat, 0.21% cholesterol) was used as control. Mice injected with rAAV8-PCSK9D377Y and fed a HFD are termed HCi HFD (hyperlipidemic), or injected with both rAAV8-PCSK9D377Y and streptozotocin and fed a HFD are termed HGHCi HFD (hyperlipidemic and hyperglycemic). LDLR KO mice on HFD served as atherosclerosis reference control. (B) Representative immunoblot of liver lysate showing hepatic protein levels of low-density lipoprotein receptor (LDLR). β-actin was used as loading control. (C) Densitometric analysis of LDLR immunoblot was normalized on β-actin and referred to control HFD group which is set at 1. Bar graphs are showing level of (D) plasma cholesterol level [mg/dL], (E) blood glucose levels [mg/dL] and (F) Triglycerides [mg/dL]. Data are presented as mean ± SEM and two-way ANOVA was performed with Sidak's multiple comparison post-hoc test (*p < 0.05). N = 6 for each group.
Figure 2
Figure 2
Mice with combined hyperlipidemia and hyperglycemia show larger plaques than hyperlipidemic mice. (A–D) Representative histological images showing cross-sections of aortic sinus stained with Hematoxylin/ Eosin [H & E, (A)] and bar graphs summarizing data (B). Representative histological images showing aortic sinus sections stained with Oil-red O (C) and bar graphs summarizing data (D). (E–H) Representative histological images showing truncus brachiocephalic arteries (BCA) sections stained with Oil-red O (E) and bar graphs summarizing data (F). Stainings were imaged at 4 × magnification (scale bar 100 μm) (A,C,E). HFD control 12 and 20 weeks (N = 7), HCi HFD 12 and 20 weeks (N = 5), and HGHCi HFD 12 and 20 weeks (N = 6). Determination of the external elastic lamina (EEL) (G), internal elastic lamina (IEL) (H), media area (I) and the lumen area (J) from Oil-red O stained cross-sections of the BCA (see Supplementary Figure II). Data presented as mean ± SEM and two-way ANOVA were performed with Sidak's multiple comparison post-hoc test (*p < 0.05). Control HFD: Wild type mice without rAAV8-PCSK9D377Y injection on high fat diet (HFD); HCi HFD: rAAV8-PCSK9D377Y injection plus HFD (hyperlipidemic); HGHCi HFD: rAAV8-PCSK9D377Y and streptozotocin injection and HFD (hyperlipidemic and hyperglycemic).
Figure 3
Figure 3
Increased necrotic core, reduced fibrous cap thickness, and α-SMA positive cells within plaques of hyperlipidemic and hyperglycemic mice as compared to hyperlipidemic mice. (A–C) Representative images showing MOVATs pentachrome staining of cross-sections of the aortic sinus (A, scale bar 100 μm, 10x magnification). Bar graphs summarizing morphometric analyses of MOVATs stained images for necrotic core area (indicated by *) (B) and fibrous cap thickness (indicated by a black arrow) (C). Necrotic core area is depicted as % of total lesion area. (D–F) Representative images showing MOVATs pentachrome staining of cross-sections of truncus brachiocephalic arteries (BCA) (D, scale bar 200 μm, 4x magnification). Bar graphs summarizing morphometric analyses of MOVATs stained images for necrotic core area (indicated by *) (E) and fibrous cap thickness thickness (indicated by a black arrow) (F). Data presented as mean + SEM and one-way ANOVA was performed with Sidak's multiple comparison post-hoc test (*p < 0.05). (G,H) Representative images showing immunohistochemical staining for α-SMA positive cells detected by HRP-DAB reaction (brown) on cross-sections of aortic sinus (G,H) (scale bar 100 μm, 10x magnification) and truncus brachiocephalic arteries (I,J) (scale bar 200 μm, 4x magnification). Corresponding bar graphs summarizing data (H,J). Data presented as mean + SEM and two-way ANOVA were performed with Sidak's multiple comparison post-hoc test (*p < 0.05). HFD control 12 and 20 weeks (N = 7), HCi HFD 12 and 20 weeks (N = 5), and HGHCi HFD 12 and 20 weeks (N = 6). Control HFD: Wild type mice without rAAV8-PCSK9D377Y injection on high fat diet (HFD); HCi HFD: rAAV8-PCSK9D377Y injection plus HFD (hyperlipidemic); HGHCi HFD: rAAV8-PCSK9D377Y and streptozotocin injection and HFD (hyperlipidemic and hyperglycemic).
Figure 4
Figure 4
Increased IL-1β plasma level and expression of pro-inflammatory markers in hyperlipidemic and hyperglycemic mice as compared to hyperlipidemic mice. (A) Plasma IL-1β [pg/mL] level at 12 and 20 weeks. (B–E) mRNA expression of macrophage polarization markers. M1 macrophage polarization is depicted by CD68 (B) and iNos (C) mRNA expression. Arg1 (D) and Fizz (E) mRNA expression levels are shown as M2 polarization marker. The data are presented as mean ± SEM and were normalized on the mean of two housekeeping genes (Hprt and B2m). HFD control served as reference and was set at 1. (F,G) Representative images showing immunofluorescence staining of truncus brachiocephalic arteries (BCA) sections for macrophage marker MOMA-2 (F, MOMA-2 = red; DAPI nuclear counterstain = blue; plaque region is circled with a white dashed line, scale bar 200 μm, 4 × magnification) and bar graphs summarizing data (G). Representative images showing immunofluorescence staining of cross-sections of aortic sinus for MOMA-2 (H, MOMA-2 = red; DAPI nuclear counterstain = blue; plaque region is circled with a white dashed line, scale bar 100 μm, 10 × magnification) and bar graphs summarizing data (I). Data presented as mean ± SEM and two-way ANOVA were performed with Sidak's multiple comparison post-hoc test (*p < 0.05). HFD control 12 and 20 weeks (N = 7), HCi HFD 12 and 20 weeks (N = 5), and HGHCi HFD 12 and 20 weeks (N = 6). Control HFD: Wild type mice without rAAV8-PCSK9D377Y injection on high fat diet (HFD); HCi HFD: rAAV8-PCSK9D377Y injection plus HFD (hyperlipidemic); HGHCi HFD: rAAV8-PCSK9D377Y and streptozotocin injection and HFD (hyperlipidemic and hyperglycemic).
Figure 5
Figure 5
Combined hyperglycemia and hyperlipidemia induce large set of differentially expressed genes and activates inflammatory response and extracellular matrix degradation pathways. RNA sequencing in aortic tissue of control HFD, HCi HFD and HGHCi HFD mice after 12 weeks. Wild type mice without AAV8-PCSK9D377Y injection on high fat diet (control HFD) or injected with rAAV8-PCSK9D377Y and on HFD (hyperlipidemic, HCi HFD) or injected with both rAAV8-PCSK9D377Y and streptozotocin and fed HFD (hyperlipidemic and hyperglycemic, HGHCi HFD). (A) Venn diagram showing overlap of genes significantly changed in HGHCi HFD or HCi HFD mice in relation to gene expression in control HFD mice. (B) Heat map summarizing differentially expressed gene (DEGs) identified by RNA sequencing and DEGs related biological processes using Gene Ontology and EnrichR analysis. (C) Heat map showing list of DEGs related to inflammatory response (GO: 0006954) using Gene Ontology and EnrichR analysis. (D) Tnf expression level (FPKM normalized on Control HFD) from RNASeq at 12 weeks (N = 5/ group) and its (E) qPCR validation in all groups at both time points (12 and 20 weeks). (F) Heat map showing list of DEGs related to extracellular matrix degradation pathways (GO: 0030198) using Gene Ontology and EnrichR analysis. RNA expression levels of selected ECM degradation genes Adamts4 (G,H) and Mmp14 (I,J) (FPKM normalized on Control HFD) from RNASeq at 12 weeks (N = 5/ group) (G,I) and its qPCR validation (H,J) in all groups at both time points (12 and 20 weeks). Gene count values larger than the average control are represented in yellow, while lower counts than the average control are represented in blue. Whenever transcript values are close to the control value, samples are colored in white. The data are presented as mean ± SEM and qPCR data were normalized on the mean of two housekeeping genes (Hprt and B2m). HFD control served as reference control. Two-way ANOVA was performed with Sidak's multiple comparison post-hoc test (*p < 0.05).
Figure 6
Figure 6
Paigen diet accelerates plaque formation after 8 weeks in the rAAV8-PCSK9 streptozotocin induced hyperglycemic atherosclerosis mouse model. (A) Schematic summary of the experimental setup. Mice were analyzed after 8 weeks of interventions initiation. (B) Representative immunoblot showing hepatic protein levels of low-density lipoprotein receptor (LDLR). β-actin was used as loading control and bar graphs summarizing data. Data were normalized on β-actin and control PD mice were set at 1 (C). Bar graphs summarizing data of plasma cholesterol level [mg/dL, D], triglycerides [mg/dL, E), and blood glucose levels [mg/dL, F]. (G–J) Representative histological images showing aortic sinus sections stained with Hematoxylin Eosin [H & E, (G)] and bar graphs summarizing data (H). Representative histological images showing aortic sinus sections stained with Oil-red-O (I) and bar graphs summarizing data (J). Data presented as mean ± SEM and one-way ANOVA was performed with Sidak's multiple comparison post-hoc test (*p < 0.05). Scale bar 200 μm. Control paigen diet (PD) (N = 6), HCi PD (N = 6), HGHCi PD (N = 6), LDLR KO PD (N = 5). Control PD: Wild type mice without rAAV8-PCSK9D377Y injection on PD; HCi PD: mice injected with rAAV8-PCSK9D377Y and fed PD (hyperlipidemic); HGHCi PD: mice injected with both rAAV8-PCSK9D377Y and streptozotocin and fed PD (hyperlipidemic and hyperglycemic); LDLR KO PD: LDLR KO mice fed PD.
Figure 7
Figure 7
Hyperlipidemic and hyperglycemic mice fed a Paigen diet (PD) show less collagen and increased inflammation within aortic plaques compared to hyperlipidemic mice. (A) Representative images showing picrosirius red staining for collagen in aortic sinus sections and bar graphs summarizing data (B). Scale bar 200 μm. (C) Representative images showing immunohistochemical staining of aortic sinus sections for macrophages marker CD68 (positive cells detected by HRP-DAB reaction, brown) and bar graphs summarizing data (D). Data presented as mean ± SEM and one-way ANOVA was performed with Sidak's multiple comparison post-hoc test (*p < 0.05). Scale bar 100 μm. Control paigen diet (PD) (N = 7), HCi PD (N = 4), HGHCi PD (N = 4), LDLR KO PD (N = 5). Control PD: Wild type mice without rAAV8-PCSK9D377Y injection on PD; HCi PD: mice injected with rAAV8-PCSK9D377Y and fed PD (hyperlipidemic); HGHCi PD: mice injected with both rAAV8-PCSK9D377Y and streptozotocin and fed PD (hyperlipidemic and hyperglycemic); LDLR KO PD: LDLR KO mice fed PD.

Similar articles

Cited by

References

    1. Benjamin EJ, Muntner P, Alonso A, Bittencourt MS, Callaway CW, Carson AP et al. Correction to: Heart disease and stroke statistics-2019 update: a report from the American heart association. Circulation. (2020) 141:e33. 10.1161/CIR.0000000000000746 - DOI - PubMed
    1. Raghavan S, Vassy JL, Ho Y-L, Song RJ, Gagnon DR, Cho K, et al. . Diabetes mellitus-related all-cause and cardiovascular mortality in a national cohort of adults. J Am Heart Assoc. (2019) 8:e011295. 10.1161/JAHA.118.011295 - DOI - PMC - PubMed
    1. Fang M, Wang D, Coresh J, Selvin E. Trends in diabetes treatment and control in U.S. adults, 1999–2018. N Engl J Med. (2021) 384: 2219–28. 10.1056/NEJMsa2032271 - DOI - PMC - PubMed
    1. Jun JY, Ma Z, Segar L. Spontaneously diabetic Ins2+/Akita:apoE-deficient mice exhibit exaggerated hypercholesterolemia and atherosclerosis. Am J Physiol Endocrinol Metab. (2011) 301:E145–E154. 10.1152/ajpendo.00034.2011 - DOI - PMC - PubMed
    1. Voyiaziakis E, Goldberg IJ, Plump AS, Rubin EM, Breslow JL, Huang LS. ApoA-I deficiency causes both hypertriglyceridemia and increased atherosclerosis in human apoB transgenic mice. J Lipid Res. (1998) 39:313–21. 10.1016/S0022-2275(20)33893-1 - DOI - PubMed