. 2022 Jun:486:56-70.
doi: 10.1016/j.ydbio.2022.03.009. Epub 2022 Mar 25.

Microtubule polarity is instructive for many aspects of neuronal polarity

Affiliations

Microtubule polarity is instructive for many aspects of neuronal polarity

Pankajam Thyagarajan et al. Dev Biol. 2022 Jun.

Abstract

Many neurons in bilaterian animals are polarized with functionally distinct axons and dendrites. Microtubule polarity, microtubule stability, and the axon initial segment (AIS) have all been shown to influence polarized transport in neurons. Each of these cytoskeletal cues could act independently to control axon and dendrite identity, or there could be a hierarchy in which one acts upstream of the others. Here we test the hypothesis that microtubule polarity acts as a master regulator of neuronal polarity by using a Drosophila genetic background in which some dendrites have normal minus-end-out microtubule polarity and others have the axonal plus-end-out polarity. In these mosaic dendrite arbors, we found that ribosomes, which are more abundant in dendrites than axons, were reduced in plus-end-out dendrites, while an axonal cargo was increased. In addition, we determined that microtubule stability was different in plus-end-out and minus-end-out dendrites, with plus-end-out ones having more stable microtubules like axons. Similarly, we found that ectopic diffusion barriers, like those at the AIS, formed at the base of dendrites with plus-end-out regions. Thus, changes in microtubule polarity were sufficient to rearrange other cytoskeletal features associated with neuronal polarization. However, overall neuron shape was maintained with only subtle changes in branching in mosaic arbors. We conclude that microtubule polarity can act upstream of many aspects of intracellular neuronal polarization, but shape is relatively resilient to changes in microtubule polarity in vivo.

Keywords: Axon; Axon initial segment; Dendrite; Microtubule polarity; Neuronal polarity.


Conflict of interest statement

Declaration of competing interest No competing interests are declared.

Figures
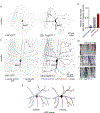
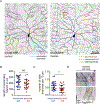
Figure 1.
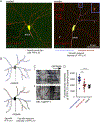
Figure 1.. Reduction of Patronin generates mosaic dendrite arbors with plus-end-out and minus-end-out regions emerging from minus-end-out roots.
A. Representative image of a class IV ddaC (dorsal dendrite arborization-C) neuron expressing UAS-EB1-GFP and UAS-Patronin RNAi under 477-Gal4 in a 3-day-old Drosophila larva. The black dotted line labels the axon. The red and blue dashed lines indicate the regions of neurites/dendritic branches with plus-end-out microtubules and minus-end-out microtubules respectively. The grey dotted lines mark neurites with mixed microtubule polarity. The green solid line marks the base of a dendrite. B. Representative kymographs of EB1-GFP controlled by 477-Gal4 from time-lapse videos of neurites from control and mosaic (Patronin RNAi) dendrite arbors. γ-Tubulin-37c-RNAi was used as the control RNAi – this gene is maternally expressed and does not contribute to somatic function (Wiese, 2008). Blue lines mark the minus-end-out microtubules while red lines mark the plus-end-out microtubules. Scale bar: x axis = 5 µm, y axis = 60 seconds. C. Quantification of dendritic branches expressing EB1-GFP under 477-gal4 displaying different microtubule polarities: plus-end-out microtubules (>90%), minus-end-out microtubules (>90%) and mixed polarity. Numbers on the graphs are the total number of branches collected for each group from 15 animals. D. Representative kymograph from time-lapse video of a segment from the base of the mosaic dendrite arbor where the blue lines label minus-end-out microtubules. Quantification of polarity of microtubules in the base of the control and mosaic arbors is shown in the graph. Numbers on the graphs are the total number of branches collected from 12 animals. E. Representative image of a class IV ddaC neuron expressing EB1-TagRFP-T and Patronin RNAi under ppk-gal4 in a 3-day-old Drosophila larva. The black dotted line labels the axon. Red and blue dashed lines mark the neurites/dendritic branches with plus-end-out microtubules and minus-end-out microtubules respectively. F. Representative kymographs from time-lapse videos of a segment of neurites expressing EB1-TagRFP-T under ppk-gal4 from mosaic dendrite arbors are shown. Blue lines mark minus-end-out microtubules while red lines mark plus-end-out microtubules. Scale bar: x axis = 10 µm, y axis = 60 seconds. G. Schematic diagrams of control and mosaic (Patronin RNAi) neurons are shown. H. The fraction of dendritic branches with different microtubule polarity in individual neurons (same color code as in C) are compared between 477-gal4 and ppk-gal4. The distribution in each neuron is plotted in the graphs.
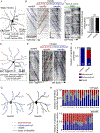
Figure 2.
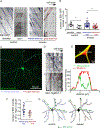
Figure 2.. Axonal cargo is routed to plus-end-out dendrites.
A. Representative images of Class 4 ddaC neurons expressing ANF-GFP (axonal marker) and EB1-Tag-RFP-T in control neurons are shown. B. Quantification of microtubule polarity and ANF-GFP localization in mosaic neurons. ****, P<0.0001 when analyzed with student’s t-test. The numbers on the graph represent the total number of neurites quantified from 16 animals. C. Representative images of mosaic class IV ddaC neurons expressing ANF-GFP and EB1-Tag-RFP-T. Note that in this example the axon (red dashed line) is under one of the dendrites. In the left panel, pink dashed lines indicate neurites with distinct ANF puncta while green dashed lines indicate neurites without ANF. Microtubule polarity (from time-lapse video of EB-dynamics) in these neurites is mapped in the right panel as red lines for plus-end-out, blue lines for minus-end-out and grey lines for mixed. D. Kymographs of a segment of the regions marked with numbers in B (from time-lapsed video of EB-comets) showing different microtubule polarity. Red lines mark plus-end-out microtubules while the blue lines mark the minus-end-out microtubules. Scale bar, x axis = 10 µm, y axis = 60 seconds. E. Schematic diagram showing localization of ANF-GFP in control and mosaic neurons. The color code of microtubule polarity is as described in 1G. Pink triangles represent ANF puncta.
Figure 3.
Figure 3.. Ribosome localization is reduced in plus-end-out neurites.
A. Representative images of ddaC control and mosaic neuron expressing the dendrite-specific ribosomal marker YFP-L10. Orange arrowheads mark branch points with YFP-L10 localization. Insets show zoomed-in branchpoint regions with minus-end-out polarity (in blue) and plus-end-out polarity (in red). B. Schematic diagram showing YFP-L10 distribution in branch points (bp) of control and mosaic neurons. C. Kymographs from regions marked with numbers in A showing microtubule polarity in mosaic neurons expressing YFP-L10. Red lines mark plus-end-out microtubules while the blue lines mark minus-end-out microtubules. Scale bar, x axis = 10 µm, y axis = 60 seconds. D. Quantification of fluorescence intensity of YFP-L10 at branch points. Branch points were were selected for quantitation only if regions on either side had the same polarity. **, P<0.01 when analyzed with student’s t-test. Branch points were quantified from 11 mosaic neurons.
Figure 4.
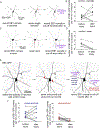
Figure 4.. Microtubule stability differs in plus-end-out and minus-end-out neurites of mosaic arbors.
A. Representative kymographs showing EB1-GFP dynamics in a control dendrite and axon and in minus-end-out and plus-end-out regions of mosaic arbors. Minus-end-out microtubules are labelled with blue lines while red lines label plus-end-out microtubules. Scale bar: x axis = 5 µm, y axis = 60 seconds. B. Quantification of EB1-GFP dynamics in control neurons (n=10 animals) and mosaic dendrite arbors (n=15 animals). **, P<0.01 when analyzed with student’s t-test. C. Representative image of a ddaC neuron expressing tdEos-α-Tubulin. Microtubule polarity is indicated with red lines for plus-end-out and blue lines for minus-end-out. D. Kymographs of the regions marked with numbers in C (from time-lapse videos of EB1-TagRFP-T comets) showing different microtubule polarity. Red lines mark plus-end-out microtubules while blue lines mark minus-end-out microtubules. Scale bar, x axis = 10 µm, y axis = 60 seconds. E. Airyscan image of branch point of a ddaC neuron expressing tdEos-α-Tubulin and iBlueberry (soluble marker). Fluorescence intensity was measured along the white line through the branch point and is shown in the graph. F. Quantification of EB1-TagRFP-T dynamics after normalization to tdEos-α-Tubulin intensity in a neurite (n=10 animals). *, P<0.05. G. Schematic diagram shows plus end (EB1 comet) number is similar in control and minus-end-out regions of mosaic dendrites, but reduced in plus-end-out regions.
Figure 5.
Figure 5.. Microtubules in minus-end-out, but not plus-end-out, regions of mosaic arbors show the dendritic response to neurite severing.
A. Schematics showing the dendrite injury assay for control neurons. Lightning bolt indicates site of severing. B. Quantification of EB1-GFP dynamics before and after dendrite injury in control neurons, n = 10 animals. C. Schematics showing axon injury assay in control neurons. D. Quantification of EB1-dynamics before and after axon injury in control neurons, n = 10 animals. P<0.05 when the outcomes (increase in comet number vs no increase) were compared using the Fisher’s Exact test between 5B and 5D. E. Schematics showing the assay to measure EB1-GFP dynamics after injury in mosaic ddaC neurons. Plus-end-out neurites are marked with red lines and minus-end-out with blue lines. F. Quantification of EB1-GFP dynamics before and after injury in mosaic neurons (n = 16 animals). P<0.05 when the outcomes (increase in comet number vs no increase) were compared using the Fisher’s Exact test between minus-end-out and plus-end-out neurites.
Figure 6.
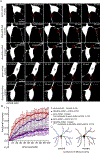
Figure 6.. Ectopic diffusion barriers form in neurons with mosaic arbors.
A. Representative images of neurons expressing mCD8-GFP (membrane marker) at different time points from the time-lapse movie recorded during photobleaching assays. In all images the axons emerge from the bottom of the cell body and are indicated with asterisks. Red circles mark the bleached region. B. Quantification of fluorescence recovery after photobleaching (FRAP). Error bars show the standard deviation. The average intensity values between 80 and 100 seconds post-bleaching of the specified categories were compared with a student’s t-test. C. Schematic diagram showing the location of diffusion barriers in the control and mosaic neurons.
Figure 7.
Figure 7.. Plus-end-out neurites in mosaic arbors have reduced branching.
A. Representative images of control and mosaic ddaC neurons expressing the mCD8-GFP to visualize morphology. Secondary branches (quantified in B) are marked with purple dashed lines. Terminal branches (quantified in C) are marked with orange lines. In mosaic neurons microtubule polarity of neurites is marked with blue dashed lines for minus-end-out and red dashed lines for plus-end-out. B. Quantification of the length of secondary branches in plus-end-out and minus-end-out neurites of mosaic neurons. ns, P>0.05 when analyzed with student’s t-test (n=12 animals). C. Quantification of the number of terminal branches (normalized to length) in plus-end-out and minus-end-out neurites in mosaic arbors. **, P<0.01 when analyzed with student’s t-test (n=12 animals). D. Representative kymographs from time-lapse videos of neurites in mosaic arbors expressing EB1-TagRFP-T. Blue lines mark the minus-end-out microtubules while red lines mark the plus-end-out microtubules. Scale bar: x axis = 10 µm, y axis = 60 seconds.

Similar articles

Cited by

References

    1. Baas PW, Deitch JS, Black MM and Banker GA (1988). Polarity orientation of microtubules in hippocampal neurons: uniformity in the axon and nonuniformity in the dendrite. Proc Natl Acad Sci U S A 85, 8335–9. - PMC - PubMed
    1. Baas PW and Lin S (2011). Hooks and comets: The story of microtubule polarity orientation in the neuron. Dev Neurobiol 71, 403–18. - PMC - PubMed
    1. Baas PW, Rao AN, Matamoros AJ and Leo L (2016). Stability properties of neuronal microtubules. Cytoskeleton (Hoboken) 73, 442–60. - PMC - PubMed
    1. Baas PW, Slaughter T, Brown A and Black MM (1991). Microtubule dynamics in axons and dendrites. J Neurosci Res 30, 134–53. - PubMed
    1. Bartlett WP and Banker GA (1984). An electron microscopic study of the development of axons and dendrites by hippocampal neurons in culture. I. Cells which develop without intercellular contacts. J Neurosci 4, 1944–53. - PMC - PubMed

LinkOut - more resources