. 2022 Mar 1;10(3):580.
doi: 10.3390/biomedicines10030580.

Poxviruses Bearing DNA Polymerase Mutations Show Complex Patterns of Cross-Resistance

Affiliations

Poxviruses Bearing DNA Polymerase Mutations Show Complex Patterns of Cross-Resistance

Graciela Andrei et al. Biomedicines. .

Abstract

Despite the eradication of smallpox four decades ago, poxviruses continue to be a threat to humans and animals. The arsenal of anti-poxvirus agents is very limited and understanding mechanisms of resistance to agents targeting viral DNA polymerases is fundamental for the development of antiviral therapies. We describe here the phenotypic and genotypic characterization of poxvirus DNA polymerase mutants isolated under selective pressure with different acyclic nucleoside phosphonates, including HPMPC (cidofovir), cHPMPC, HPMPA, cHPMPA, HPMPDAP, HPMPO-DAPy, and PMEO-DAPy, and the pyrophosphate analogue phosphonoacetic acid. Vaccinia virus (VACV) and cowpox virus drug-resistant viral clones emerging under drug pressure were characterized phenotypically (drug-susceptibility profile) and genotypically (DNA polymerase sequencing). Different amino acid changes in the polymerase domain and in the 3'-5' exonuclease domain were linked to drug resistance. Changes in the 3'-5' domain emerged earlier than in the polymerase domain when viruses acquired a combination of mutations. Our study highlights the importance of poxvirus DNA polymerase residues 314, 613, 684, 688, and 851, previously linked to drug resistance, and identified several novel mutations in the 3'-5' exonuclease domain (M313I, F354L, D480Y) and in the DNA polymerase domain (A632T, T831I, E856K, L924F) associated with different drug-susceptibility profiles. Furthermore, a combination of mutations resulted in complex patterns of cross-resistance. Modeling of the VACV DNA polymerase bearing the newly described mutations was performed to understand the effects of these mutations on the structure of the viral enzyme. We demonstrated the emergence of drug-resistant DNA polymerase mutations in complex patterns to be considered in case such mutations should eventually arise in the clinic.

Keywords: DNA polymerase; cidofovir; drug resistance; nucleotide analogues; phosphonoacetic acid; vaccinia virus.


Conflict of interest statement

The authors declare no conflict of interest.

Figures

Figure 1
Figure 1
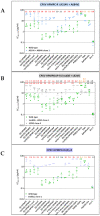
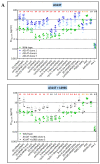
(A) Drug-susceptibility profile of cHPMPA-R VACV clones (A353V + S851Y) compared to VACV clones bearing the single S851Y DNA pol change recovered from VV1 HPMPO-DAPy-R #15. Drug-resistance properties of different plaque-purified viral clones bearing the single amino acid (S851Y) or double amino acid (A353V + S851Y) substitutions as determined using a CPE reduction assay with HEL fibroblasts. (B) Drug-susceptibility profile of selected VV1 HPMPO-DAP-R viral clones to evaluate the impact of the A632T + S851Y DNA polymerase substitutions. The A632T + A684V clones were recovered from VV1 HPMPO-DAPy-R #32. Drug-resistance properties of the different types of viral clones were established using a CPE reduction assay with HEL fibroblasts. The effects of different drugs on viruses encoding the indicated mutations were determined by calculating the EC50 values for the parental wild-type strain and clones bearing the specific mutations. At least two independent experiments were performed for each test compound. Horizontal lines for each drug and mutant viral clones indicate the mean values ± standard deviation. The fold resistance (ratio of the EC50 for the mutant viruses to the EC50 for the corresponding wild-type virus is marked at the top of the graph. VACV viral clones showing a ≥2-fold increase (red, bold) were considered drug resistant (R) and those with a ≤0.5-fold decrease (orange, bold) drug hypersensitive (hs).
Figure 2
Figure 2
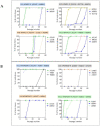
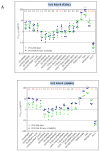
Drug-susceptibility profile of HPMPC-R (A), HPMPDAP-R (B), and HPMPO-DAPy-R (C) clones isolated from CPXV Brighton strain. Drug-resistance properties of different plaque-purified viral clones bearing the indicated DNA pol mutations as determined using a CPE reduction assay with HEL fibroblasts. The effects of different drugs on viruses encoding the indicated mutations were determined by calculating the EC50 values for the parental wild-type strain and clones bearing the specific mutations. At least two independent experiments were performed for each test compound. Horizontal lines for each drug and mutant indicate the mean values ± standard deviation. The fold resistance (ratio of the EC50 for the mutant virus to the EC50 for the wild-type CPXV strain) is marked at the top of the graph. CPXV viral clones showing a ≥2-fold increase (red, bold) were considered drug resistant (R) and those with a ≤0.5-fold decrease (orange, bold) drug hypersensitive (hs). For CPXV HPMPDAP-R, the fold resistance for the Ins408 + L924F mutant is indicated in the upper part of the figure line, while for the L924F mutant these numbers are shown underneath the previous ones.
Figure 3
Figure 3
Chronological detection of DNA pol mutants arising at different passages under pressure of HPMPC (A), HPMPDAP (B), and HPMPO-DAPy (C). Viral clones were isolated at different passages during the selection procedure and genotyping of the E9L (DNA pol) gene was carried out. The percentage of clones harboring a specific mutation is shown for the different passages.
Figure 3
Figure 3
Chronological detection of DNA pol mutants arising at different passages under pressure of HPMPC (A), HPMPDAP (B), and HPMPO-DAPy (C). Viral clones were isolated at different passages during the selection procedure and genotyping of the E9L (DNA pol) gene was carried out. The percentage of clones harboring a specific mutation is shown for the different passages.
Figure 4
Figure 4
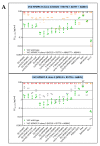
(A) Drug-susceptibility profile of selected VV2 viral clones bearing the M313I + R577G + A684V w/o the A677T change. All clones harbored the W8C substitution, which is expected to be linked to a natural occurring genetic polymorphism since it maps to the beginning of the N-terminal structural domain where drug-resistance mutations have not been described. Drug-resistance properties of the two viral clones were determined using a CPE reduction assay with HEL fibroblasts. (B) Drug-susceptibility profile of selected VV8 HPMPO-DAPy-R viral clones to evaluate the impact of the M313I, R407C, L511F, and A613T DNA polymerase substitutions. The source of the viral clones was as follows: M313I (VV8 HPMPO-DAPy #4), M313I + A613T (VV8 HPMPO-DAPy #9), and M313I + A613T+ A684V (VV8 HPMPO-DAPy-R #36). Drug-resistance properties of the different types of viral clones were determined using a CPE reduction assay with HEL fibroblasts. The effects of different drugs on viruses encoding the indicated mutations were determined by calculating the EC50 values for the parental wild-type strain and clones bearing the specific mutations. At least two independent experiments were performed for each test compound. Horizontal lines for each drug and mutant viral clones indicate the mean values ± standard deviation. The fold resistance (ratio of the EC50 for the mutant viruses to the EC50 for the corresponding wild-type virus is marked at the top of the graph. VACV viral clones showing a ≥2-fold increase (red, bold) were considered drug resistant (R) and those with a ≤0.5-fold decrease (orange, bold) drug hypersensitive (hs).
Figure 4
Figure 4
(A) Drug-susceptibility profile of selected VV2 viral clones bearing the M313I + R577G + A684V w/o the A677T change. All clones harbored the W8C substitution, which is expected to be linked to a natural occurring genetic polymorphism since it maps to the beginning of the N-terminal structural domain where drug-resistance mutations have not been described. Drug-resistance properties of the two viral clones were determined using a CPE reduction assay with HEL fibroblasts. (B) Drug-susceptibility profile of selected VV8 HPMPO-DAPy-R viral clones to evaluate the impact of the M313I, R407C, L511F, and A613T DNA polymerase substitutions. The source of the viral clones was as follows: M313I (VV8 HPMPO-DAPy #4), M313I + A613T (VV8 HPMPO-DAPy #9), and M313I + A613T+ A684V (VV8 HPMPO-DAPy-R #36). Drug-resistance properties of the different types of viral clones were determined using a CPE reduction assay with HEL fibroblasts. The effects of different drugs on viruses encoding the indicated mutations were determined by calculating the EC50 values for the parental wild-type strain and clones bearing the specific mutations. At least two independent experiments were performed for each test compound. Horizontal lines for each drug and mutant viral clones indicate the mean values ± standard deviation. The fold resistance (ratio of the EC50 for the mutant viruses to the EC50 for the corresponding wild-type virus is marked at the top of the graph. VACV viral clones showing a ≥2-fold increase (red, bold) were considered drug resistant (R) and those with a ≤0.5-fold decrease (orange, bold) drug hypersensitive (hs).
Figure 5
Figure 5
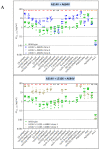
(A) Drug-susceptibility profile of selected VV8 viral clones to evaluate the impact of the A314V, L510S, and A684V DNA polymerase substitutions. The source of the viral clones was as follows: A314V + A684V (VV8 HPMPC-R #30) and the A314V + L510S + A684V (VV8 HPMPC-R #37). (B) Drug-susceptibility profile of selected viral clones to evaluate the impact of the A314V, T500I, and T688A DNA polymerase substitutions. The source of the viral clones was as follows: A314V (VV8 HPMPC-R #22), A314V + T500I (VV1 HPMPDAP-R #9), and A314V + T500I + T688A (VV1 HPMPDAP-R #37). Drug-resistance properties of the different types of viral clones were determined using a CPE reduction assay with HEL fibroblasts. The effects of different drugs on viruses encoding the indicated mutations were determined by calculating the EC50 values for the parental wild-type virus and clones bearing the specific mutations. At least two independent experiments were performed for each test compound. Horizontal lines for each drug and mutant viral clones indicate the mean values ± standard deviation. The fold resistance (ratio of the EC50 for the mutant viruses to the EC50 for the corresponding wild-type virus clone is marked at the top of the graph. VACV viral clones showing a ≥2-fold increase (red, bold) were considered drug resistant (R) and those with a ≤0.5-fold decrease (orange, bold) drug hypersensitive (hs).
Figure 5
Figure 5
(A) Drug-susceptibility profile of selected VV8 viral clones to evaluate the impact of the A314V, L510S, and A684V DNA polymerase substitutions. The source of the viral clones was as follows: A314V + A684V (VV8 HPMPC-R #30) and the A314V + L510S + A684V (VV8 HPMPC-R #37). (B) Drug-susceptibility profile of selected viral clones to evaluate the impact of the A314V, T500I, and T688A DNA polymerase substitutions. The source of the viral clones was as follows: A314V (VV8 HPMPC-R #22), A314V + T500I (VV1 HPMPDAP-R #9), and A314V + T500I + T688A (VV1 HPMPDAP-R #37). Drug-resistance properties of the different types of viral clones were determined using a CPE reduction assay with HEL fibroblasts. The effects of different drugs on viruses encoding the indicated mutations were determined by calculating the EC50 values for the parental wild-type virus and clones bearing the specific mutations. At least two independent experiments were performed for each test compound. Horizontal lines for each drug and mutant viral clones indicate the mean values ± standard deviation. The fold resistance (ratio of the EC50 for the mutant viruses to the EC50 for the corresponding wild-type virus clone is marked at the top of the graph. VACV viral clones showing a ≥2-fold increase (red, bold) were considered drug resistant (R) and those with a ≤0.5-fold decrease (orange, bold) drug hypersensitive (hs).
Figure 6
Figure 6
(A) Drug-susceptibility profile of selected viral clones to evaluate the impact of the A314T, M656I, A684V, and L696S DNA polymerase substitutions. The source of the viral clones was as follows: A314T (VV8 HPMPDAP-R #8), A314T + A684V (VV8 HPMPC-R #30), A314T + L696S (VV11 #16), A314T + M656I + A684V (VV11 HPMPC-R #40), and A314T + A684V + L696S (VV11 HPMPDAP-R #39). (B) Drug-susceptibility profile of the selected VV11 HPMPO-DAPy-R viral clone bearing the G138E + A314T mutations. Drug-resistance properties of the different types of viral clones were determined using a CPE reduction assay with HEL fibroblasts. The effects of different drugs on viruses encoding the indicated mutations were determined by calculating the EC50 values for the parental wild-type strain and clones bearing the specific mutations. At least two independent experiments were performed for each test compound. Horizontal lines for each drug and mutant viral clones indicate the mean values ± standard deviation. The fold resistance (ratio of the EC50 for the mutant viruses to the EC50 for the corresponding wild-type virus is marked at the top of the graph. VACV viral clones showing a ≥2-fold increase (red, bold) were considered drug resistant (R) and those with a ≤0.5-fold decrease (orange, bold) drug hypersensitive (hs).
Figure 6
Figure 6
(A) Drug-susceptibility profile of selected viral clones to evaluate the impact of the A314T, M656I, A684V, and L696S DNA polymerase substitutions. The source of the viral clones was as follows: A314T (VV8 HPMPDAP-R #8), A314T + A684V (VV8 HPMPC-R #30), A314T + L696S (VV11 #16), A314T + M656I + A684V (VV11 HPMPC-R #40), and A314T + A684V + L696S (VV11 HPMPDAP-R #39). (B) Drug-susceptibility profile of the selected VV11 HPMPO-DAPy-R viral clone bearing the G138E + A314T mutations. Drug-resistance properties of the different types of viral clones were determined using a CPE reduction assay with HEL fibroblasts. The effects of different drugs on viruses encoding the indicated mutations were determined by calculating the EC50 values for the parental wild-type strain and clones bearing the specific mutations. At least two independent experiments were performed for each test compound. Horizontal lines for each drug and mutant viral clones indicate the mean values ± standard deviation. The fold resistance (ratio of the EC50 for the mutant viruses to the EC50 for the corresponding wild-type virus is marked at the top of the graph. VACV viral clones showing a ≥2-fold increase (red, bold) were considered drug resistant (R) and those with a ≤0.5-fold decrease (orange, bold) drug hypersensitive (hs).
Figure 7
Figure 7
Drug-susceptibility profile of selected VV2 HPMPDAP-R viral clones to evaluate the impact of the D480Y, A684V, and A705T DNA polymerase substitutions. The source of the viral clones was as follows: D480Y (VV2 HPMPDAP-R # 4), and D480Y + A684V + A705T (VV2 HPMPDAP-R #36). Drug-resistance properties of the different types of viral clones were determined using a CPE reduction assay with HEL fibroblasts. The effects of different drugs on viruses encoding the indicated mutations were determined by calculating the EC50 values for the parental wild-type strain and clones bearing the specific mutations. At least two independent experiments were performed for each test compound. Horizontal lines for each drug and mutant viral clones indicate the mean values ± standard deviation. The fold resistance (ratio of the EC50 for the mutant viruses to the EC50 for the corresponding wild-type virus is marked at the top of the graph. VACV viral clones showing a ≥2-fold increase (red, bold) were considered drug resistant (R) and those with a ≤0.5-fold decrease (orange, bold) drug hypersensitive (hs).
Figure 7
Figure 7
Drug-susceptibility profile of selected VV2 HPMPDAP-R viral clones to evaluate the impact of the D480Y, A684V, and A705T DNA polymerase substitutions. The source of the viral clones was as follows: D480Y (VV2 HPMPDAP-R # 4), and D480Y + A684V + A705T (VV2 HPMPDAP-R #36). Drug-resistance properties of the different types of viral clones were determined using a CPE reduction assay with HEL fibroblasts. The effects of different drugs on viruses encoding the indicated mutations were determined by calculating the EC50 values for the parental wild-type strain and clones bearing the specific mutations. At least two independent experiments were performed for each test compound. Horizontal lines for each drug and mutant viral clones indicate the mean values ± standard deviation. The fold resistance (ratio of the EC50 for the mutant viruses to the EC50 for the corresponding wild-type virus is marked at the top of the graph. VACV viral clones showing a ≥2-fold increase (red, bold) were considered drug resistant (R) and those with a ≤0.5-fold decrease (orange, bold) drug hypersensitive (hs).
Figure 8
Figure 8
Drug-susceptibility profile of selected VV2 HPMPO-DAPy-R viral clones to evaluate the impact of the M313I, R407C, L511F, and A613T DNA polymerase substitutions. The source of the viral clones was as follows: R407C + L511F (VV2 HPMPO-DAPy-R #5), M313I + R407C + L511F (VV2 HPMPO-DAPy-R #10), and R155S + M313I + R407C + L511F + A684V (VV2 HPMPO-DAPy-R #31). Drug-resistance properties of the different types of viral clones were determined using a CPE reduction assay with HEL fibroblasts. The effects of different drugs on viruses encoding the indicated mutations were determined by calculating the EC50 values for the parental wild-type strain and clones bearing the specific mutations. At least two independent experiments were performed for each test compound. Horizontal lines for each drug and mutant viral clones indicate the mean values ± standard deviation. The fold resistance (ratio of the EC50 for the mutant viruses to the EC50 for the wild-type VV2 is marked at the top of the graph. VACV viral clones showing a ≥2-fold increase (red, bold) were considered drug resistant (R) and those with a ≤0.5-fold decrease (orange, bold) drug hypersensitive (hs).
Figure 8
Figure 8
Drug-susceptibility profile of selected VV2 HPMPO-DAPy-R viral clones to evaluate the impact of the M313I, R407C, L511F, and A613T DNA polymerase substitutions. The source of the viral clones was as follows: R407C + L511F (VV2 HPMPO-DAPy-R #5), M313I + R407C + L511F (VV2 HPMPO-DAPy-R #10), and R155S + M313I + R407C + L511F + A684V (VV2 HPMPO-DAPy-R #31). Drug-resistance properties of the different types of viral clones were determined using a CPE reduction assay with HEL fibroblasts. The effects of different drugs on viruses encoding the indicated mutations were determined by calculating the EC50 values for the parental wild-type strain and clones bearing the specific mutations. At least two independent experiments were performed for each test compound. Horizontal lines for each drug and mutant viral clones indicate the mean values ± standard deviation. The fold resistance (ratio of the EC50 for the mutant viruses to the EC50 for the wild-type VV2 is marked at the top of the graph. VACV viral clones showing a ≥2-fold increase (red, bold) were considered drug resistant (R) and those with a ≤0.5-fold decrease (orange, bold) drug hypersensitive (hs).
Figure 9
Figure 9
Drug-susceptibility profile of PAA-R viral clones (A) and PMEO-DAPy-R viral clones (B). Drug-resistance properties of the different viral clones were determined using a CPE reduction assay with HEL fibroblasts. The effects of different drugs on viruses encoding the indicated mutations were determined by calculating the EC50 values for the parental wild-type strain and clones bearing the specific mutations. At least two independent experiments were performed for each test compound. Horizontal lines for each drug and mutant viral clones indicate the mean values ± standard deviation. The fold resistance (ratio of the EC50 for the mutant viruses to the EC50 for the corresponding wild-type virus is marked at the top of the graph. VACV viral clones showing a ≥2-fold increase (red) were considered drug resistant (R) and those with a ≤0.5-fold decrease (orange) were considered drug hypersensitive (hs).
Figure 9
Figure 9
Drug-susceptibility profile of PAA-R viral clones (A) and PMEO-DAPy-R viral clones (B). Drug-resistance properties of the different viral clones were determined using a CPE reduction assay with HEL fibroblasts. The effects of different drugs on viruses encoding the indicated mutations were determined by calculating the EC50 values for the parental wild-type strain and clones bearing the specific mutations. At least two independent experiments were performed for each test compound. Horizontal lines for each drug and mutant viral clones indicate the mean values ± standard deviation. The fold resistance (ratio of the EC50 for the mutant viruses to the EC50 for the corresponding wild-type virus is marked at the top of the graph. VACV viral clones showing a ≥2-fold increase (red) were considered drug resistant (R) and those with a ≤0.5-fold decrease (orange) were considered drug hypersensitive (hs).
Figure 10
Figure 10
(A) Three-dimensional structure of VACV DNA polymerase (pdb code: 5N2E) harboring newly identified amino acid changes (represented as red spheres) and amino acid changes associated to drug resistance, described in the literature (as blue sphere). The polymerase and exonuclease functional domains are shown based on Tarbouriech et al.’s (45) characterization: finger (in blue), palm (in copper) and thumb (in magenta) domains catalyzing the polymerase activity, the 3′-5′ exonuclease domain (in yellow) associated to proofreading activity, and the NH2-terminal domain (in light blue). (B) Position 353 (in red) is located in the 3′-5′ exonuclease domain and (C) A353V change (in blue) might be involved in steric hindrance with residue Y472 (in yellow) (side chain volumes: Ala = 88.6 Å3 and Val = 140 Å3). Amino acid changes located in the exonuclease domain were described to be associated with drug resistance. (D,E) Interface of the 3′-5′ exonuclease (in yellow) and thumb (in magenta) domains showing the position of residue L924 (in red), F924 (in blue), and N442 (in yellow). The images were generated using PyMol Delano Software, version 0.99rc6.
Figure 11
Figure 11
Structure of the interface finger (in blue)/NH2-terminal (in light blue) domains. (A,B) A677 (in red) is facing residues E106, K503, and L506 (in grey) at the interface between finger (in blue) and NH2-terminal (in light blue) domains. (C) Change at position 670 has been associated with aphidicolin resistance. (D,E) Residue L510 was found altered in our study through change L510S selected under the pressure with HPMPC, (F) while at position 511, a phenylalanine residue was present in the clones selected under pressure with HPMPO-DAPY. The images were generated using PyMol Delano Software, version 0.99rc6.
Figure 12
Figure 12
(A) Finger domain, represented in blue, is the location of two amino acid changes identified in position A632 and M656 (represented in red). (B) The amino acid changes, represented in grey, might involve differences in positioning of the finger domain for proper recognition of the incoming substrate. The images were generated using PyMol Delano Software, version 0.99rc6.

Similar articles

Cited by

References

    1. Foster S.A., Parker S., Lanier R. The Role of Brincidofovir in Preparation for a Potential Smallpox Outbreak. Viruses. 2017;9:320. doi: 10.3390/v9110320. - DOI - PMC - PubMed
    1. Jacobs B.L., Langland J.O., Kibler K.V., Denzler K.L., White S.D., Holechek S.A., Wong S., Huynh T., Baskin C.R. Vaccinia virus vaccines: Past, present and future. Antivir. Res. 2009;84:1–13. doi: 10.1016/j.antiviral.2009.06.006. - DOI - PMC - PubMed
    1. Fenner F. Smallpox: Emergence, global spread, and eradication. Hist. Philos. Life Sci. 1993;15:397–420. - PubMed
    1. Breman J.G., Arita I. The Confirmation and Maintenance of Smallpox Eradication. N. Engl. J. Med. 1980;303:1263–1273. doi: 10.1056/nejm198011273032204. - DOI - PubMed
    1. Melamed S., Israely T., Paran N. Challenges and Achievements in Prevention and Treatment of Smallpox. Vaccines. 2018;6:8. doi: 10.3390/vaccines6010008. - DOI - PMC - PubMed

LinkOut - more resources