

In Vivo Basilar Membrane Time Delays in Humans
- PMID: 35326357
- PMCID: PMC8946056
- DOI: 10.3390/brainsci12030400
In Vivo Basilar Membrane Time Delays in Humans
Abstract
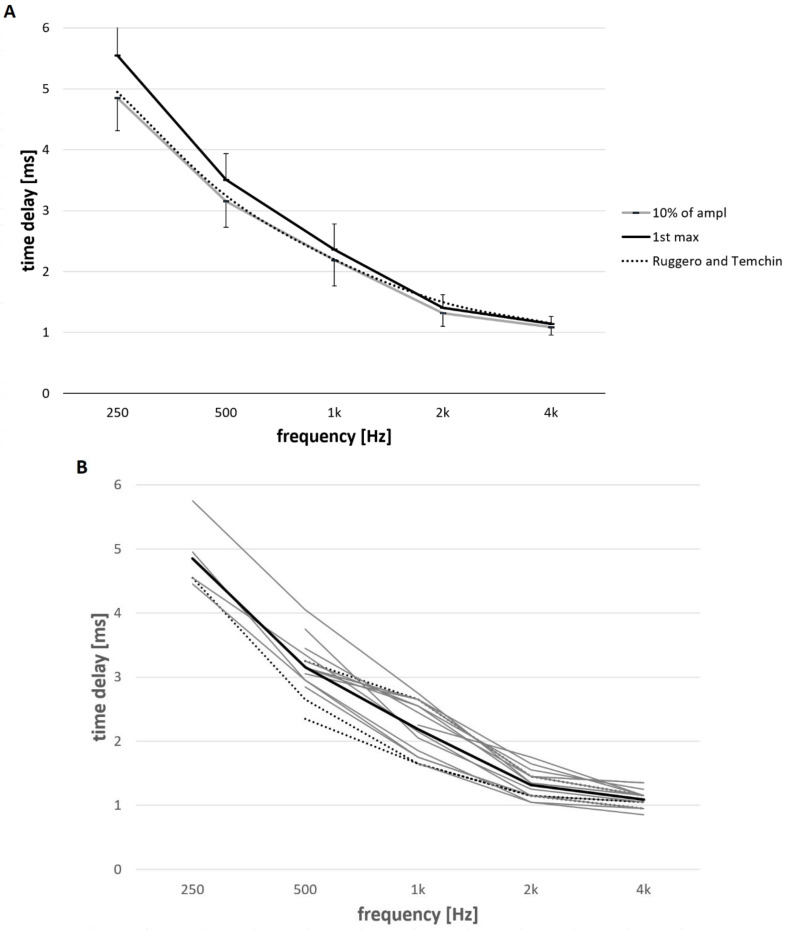
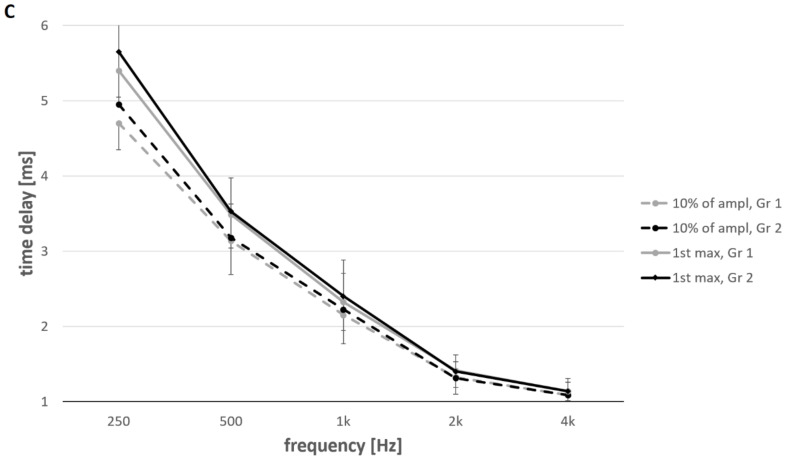
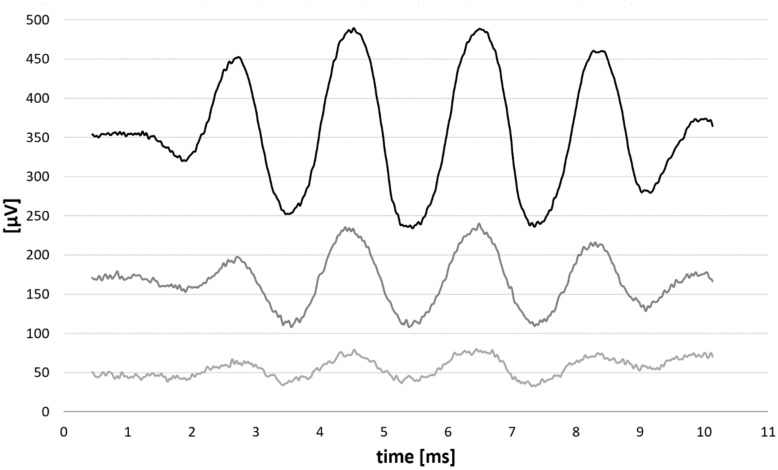
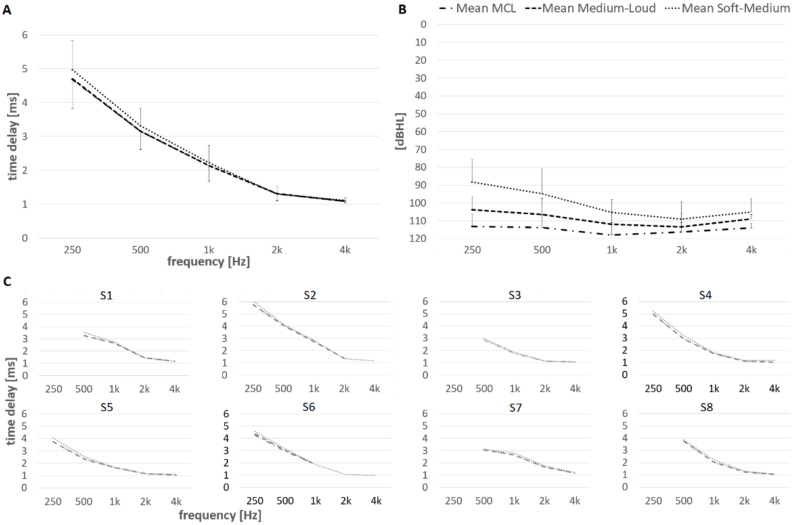
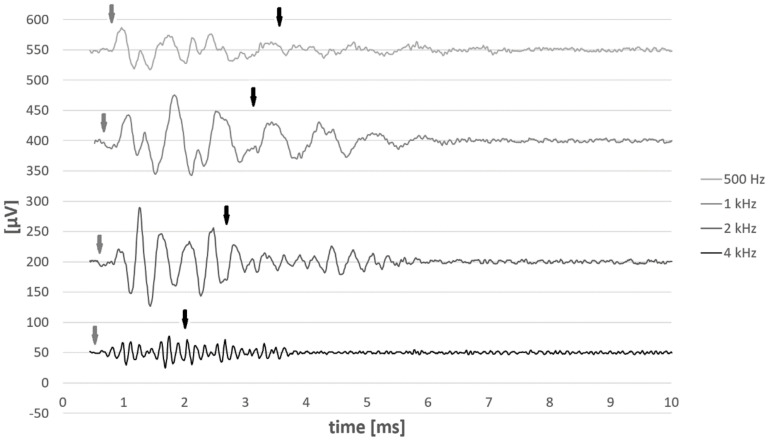
To date, objective measurements and psychophysical experiments have been used to measure frequency dependent basilar membrane (BM) delays in humans; however, in vivo measurements have not been made. This study aimed to measure BM delays by performing intracochlear electrocochleography in cochlear implant recipients. Sixteen subjects with various degrees of hearing abilities were selected. Postoperative Computer Tomography was performed to determine electrode locations. Electrical potentials in response to acoustic tone pips at 0.25, 0.5, 1, 2, and 4 kHz and clicks were recorded with electrodes at the frequency specific region. The electrode array was inserted up to the characteristic cochlear frequency region of 250 Hz for 6 subjects. Furthermore, the array was inserted in the region of 500 Hz for 15 subjects, and 1, 2, and 4 kHz were reached in all subjects. Intracochlear electrocochleography for each frequency-specific tone pip and clicks showed detectable responses in all subjects. The latencies differed among the cochlear location and the cochlear microphonic (CM) onset latency increased with decreasing frequency and were consistent with click derived band technique. Accordingly, BM delays in humans could be derived. The BM delays increased systematically along the cochlea from basal to apical end and were in accordance with Ruggero and Temchin, 2007.
Keywords: auditory prostheses; basilar membrane; cochlear microphonics; hearing preservation; intracochlear electrography; traveling wave delays.
Conflict of interest statement
The authors declare no conflict of interest.
Figures


Similar articles
-
Electrophysiological Evidence of the Basilar-Membrane Travelling Wave and Frequency Place Coding of Sound in Cochlear Implant Recipients.Audiol Neurootol. 2017;22(3):180-189. doi: 10.1159/000478692. Epub 2017 Oct 31. Audiol Neurootol. 2017. PMID: 29084395
-
Acoustically Evoked Compound Action Potentials Recorded From Cochlear Implant Users With Preserved Acoustic Hearing.Ear Hear. 2023 Sep-Oct 01;44(5):1061-1077. doi: 10.1097/AUD.0000000000001350. Epub 2023 Aug 17. Ear Hear. 2023. PMID: 36882917 Free PMC article.
-
Band-Limited Chirp-Evoked Compound Action Potential in Guinea Pig: Comprehensive Neural Measure for Cochlear Implantation Monitoring.Ear Hear. 2021 Jan/Feb;42(1):142-162. doi: 10.1097/AUD.0000000000000910. Ear Hear. 2021. PMID: 32665481
-
Postoperative Electrocochleography from Hybrid Cochlear Implant users: An Alternative Analysis Procedure.Hear Res. 2018 Dec;370:304-315. doi: 10.1016/j.heares.2018.10.016. Epub 2018 Oct 29. Hear Res. 2018. PMID: 30393003 Free PMC article.
-
Experimental look at cochlear mechanics.Audiology. 1992;31(6):301-12. Audiology. 1992. PMID: 1492814 Review.
Cited by
-
An intracochlear electrocochleography dataset - from raw data to objective analysis using deep learning.Sci Data. 2023 Mar 22;10(1):157. doi: 10.1038/s41597-023-02055-9. Sci Data. 2023. PMID: 36949075 Free PMC article.
-
Multi-Frequency Intraoperative Monitoring of Hearing Preservation during Cochlear Implantation.Life (Basel). 2022 Apr 25;12(5):636. doi: 10.3390/life12050636. Life (Basel). 2022. PMID: 35629304 Free PMC article.
-
ZH-ECochG Bode Plot: A Novel Approach to Visualize Electrocochleographic Data in Cochlear Implant Users.J Clin Med. 2024 Jun 14;13(12):3470. doi: 10.3390/jcm13123470. J Clin Med. 2024. PMID: 38929998 Free PMC article.
-
Objectification of intracochlear electrocochleography using machine learning.Front Neurol. 2022 Aug 29;13:943816. doi: 10.3389/fneur.2022.943816. eCollection 2022. Front Neurol. 2022. PMID: 36105773 Free PMC article.
-
[Interaural stimulation timing mismatch in listeners provided with a cochlear implant and a hearing aid : A review focusing on quantification and compensation].HNO. 2023 Aug;71(8):513-520. doi: 10.1007/s00106-023-01308-8. Epub 2023 May 23. HNO. 2023. PMID: 37219567 Review. German.
References
-
- Von Békésy G. Uber die Rezonanzkurve und die Abklingzeit der verschiedenen Stellen der Schneckentrennwand. Akustische Zeitschrift. 1943;8:66–76.
LinkOut - more resources
Full Text Sources
