Mice infected with Mycobacterium tuberculosis are resistant to acute disease caused by secondary infection with SARS-CoV-2
- PMID: 35325013
- PMCID: PMC8946739
- DOI: 10.1371/journal.ppat.1010093
Mice infected with Mycobacterium tuberculosis are resistant to acute disease caused by secondary infection with SARS-CoV-2
Abstract
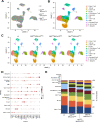
Mycobacterium tuberculosis (Mtb) and SARS-CoV-2 (CoV2) are the leading causes of death due to infectious disease. Although Mtb and CoV2 both cause serious and sometimes fatal respiratory infections, the effect of Mtb infection and its associated immune response on secondary infection with CoV2 is unknown. To address this question we applied two mouse models of COVID19, using mice which were chronically infected with Mtb. In both model systems, Mtb-infected mice were resistant to the pathological consequences of secondary CoV2 infection, and CoV2 infection did not affect Mtb burdens. Single cell RNA sequencing of coinfected and monoinfected lungs demonstrated the resistance of Mtb-infected mice is associated with expansion of T and B cell subsets upon viral challenge. Collectively, these data demonstrate that Mtb infection conditions the lung environment in a manner that is not conducive to CoV2 survival.
Conflict of interest statement
The authors have declared that no competing interests exist.
Figures
Update of
-
Mice infected with Mycobacterium tuberculosis are resistant to secondary infection with SARS-CoV-2.bioRxiv [Preprint]. 2021 Nov 10:2021.11.09.467862. doi: 10.1101/2021.11.09.467862. bioRxiv. 2021. Update in: PLoS Pathog. 2022 Mar 24;18(3):e1010093. doi: 10.1371/journal.ppat.1010093 PMID: 34790981 Free PMC article. Updated. Preprint.
Similar articles
-
Co-infection of mice with SARS-CoV-2 and Mycobacterium tuberculosis limits early viral replication but does not affect mycobacterial loads.Front Immunol. 2023 Sep 1;14:1240419. doi: 10.3389/fimmu.2023.1240419. eCollection 2023. Front Immunol. 2023. PMID: 37720210 Free PMC article.
-
Mice infected with Mycobacterium tuberculosis are resistant to secondary infection with SARS-CoV-2.bioRxiv [Preprint]. 2021 Nov 10:2021.11.09.467862. doi: 10.1101/2021.11.09.467862. bioRxiv. 2021. Update in: PLoS Pathog. 2022 Mar 24;18(3):e1010093. doi: 10.1371/journal.ppat.1010093 PMID: 34790981 Free PMC article. Updated. Preprint.
-
Immune interaction between SARS-CoV-2 and Mycobacterium tuberculosis.Front Immunol. 2023 Sep 27;14:1254206. doi: 10.3389/fimmu.2023.1254206. eCollection 2023. Front Immunol. 2023. PMID: 37841282 Free PMC article. Review.
-
Pathogenesis of SARS-CoV-2 and Mycobacterium tuberculosis Coinfection.Front Immunol. 2022 Jun 16;13:909011. doi: 10.3389/fimmu.2022.909011. eCollection 2022. Front Immunol. 2022. PMID: 35784278 Free PMC article. Review.
-
γ-herpesvirus latency attenuates Mycobacterium tuberculosis infection in mice.Tuberculosis (Edinb). 2019 May;116:56-60. doi: 10.1016/j.tube.2019.04.022. Epub 2019 Apr 30. Tuberculosis (Edinb). 2019. PMID: 31153519 Free PMC article.
Cited by
-
Helminth exposure protects against murine SARS-CoV-2 infection through macrophage dependent T cell activation.bioRxiv [Preprint]. 2022 Nov 10:2022.11.09.515832. doi: 10.1101/2022.11.09.515832. bioRxiv. 2022. Update in: Sci Immunol. 2023 Aug 18;8(86):eadf8161. doi: 10.1126/sciimmunol.adf8161 PMID: 36380767 Free PMC article. Updated. Preprint.
-
Superinfection with SARS-CoV-2 Has Deleterious Effects on Mycobacterium bovis BCG Immunity and Promotes Dissemination of Mycobacterium tuberculosis.Microbiol Spectr. 2022 Oct 26;10(5):e0307522. doi: 10.1128/spectrum.03075-22. Epub 2022 Oct 6. Microbiol Spectr. 2022. PMID: 36200898 Free PMC article.
-
Tuberculosis and COVID-19 in the elderly: factors driving a higher burden of disease.Front Immunol. 2023 Sep 27;14:1250198. doi: 10.3389/fimmu.2023.1250198. eCollection 2023. Front Immunol. 2023. PMID: 37841265 Free PMC article. Review.
-
Co-infection of mice with SARS-CoV-2 and Mycobacterium tuberculosis limits early viral replication but does not affect mycobacterial loads.Front Immunol. 2023 Sep 1;14:1240419. doi: 10.3389/fimmu.2023.1240419. eCollection 2023. Front Immunol. 2023. PMID: 37720210 Free PMC article.
-
The inflammatory microenvironment of the lung at the time of infection governs innate control of SARS-CoV-2 replication.bioRxiv [Preprint]. 2024 Mar 27:2024.03.27.586885. doi: 10.1101/2024.03.27.586885. bioRxiv. 2024. Update in: Sci Immunol. 2024 Dec 6;9(102):eadp7951. doi: 10.1126/sciimmunol.adp7951 PMID: 38585846 Free PMC article. Updated. Preprint.
References
-
- Riou C, du Bruyn E, Stek C, Daroowala R, Goliath RT, Abrahams F, et al.. Relationship of SARS-CoV-2-specific CD4 response to COVID-19 severity and impact of HIV-1 and tuberculosis coinfection. J Clin Invest. 2021;131(12). Epub 2021/05/05. doi: 10.1172/JCI149125 ; PubMed Central PMCID: PMC8203446. - DOI - PMC - PubMed
-
- Tamuzi JL, Ayele BT, Shumba CS, Adetokunboh OO, Uwimana-Nicol J, Haile ZT, et al.. Implications of COVID-19 in high burden countries for HIV/TB: A systematic review of evidence. BMC Infect Dis. 2020;20(1):744. Epub 2020/10/11. doi: 10.1186/s12879-020-05450-4 ; PubMed Central PMCID: PMC7545798. - DOI - PMC - PubMed
-
- Mendy J, Jarju S, Heslop R, Bojang AL, Kampmann B, Sutherland JS. Changes in Mycobacterium tuberculosis-Specific Immunity With Influenza co-infection at Time of TB Diagnosis. Front Immunol. 2018;9:3093. Epub 2019/01/22. doi: 10.3389/fimmu.2018.03093 ; PubMed Central PMCID: PMC6328457. - DOI - PMC - PubMed
Publication types
MeSH terms
Grants and funding
LinkOut - more resources
Full Text Sources
Medical
Molecular Biology Databases
Miscellaneous

