. 2022 Apr 22;50(7):3764-3776.
doi: 10.1093/nar/gkac179.

Telomerase RNA TERC and the PI3K-AKT pathway form a positive feedback loop to regulate cell proliferation independent of telomerase activity

Affiliations

Telomerase RNA TERC and the PI3K-AKT pathway form a positive feedback loop to regulate cell proliferation independent of telomerase activity

Shu Wu et al. Nucleic Acids Res. .

Abstract

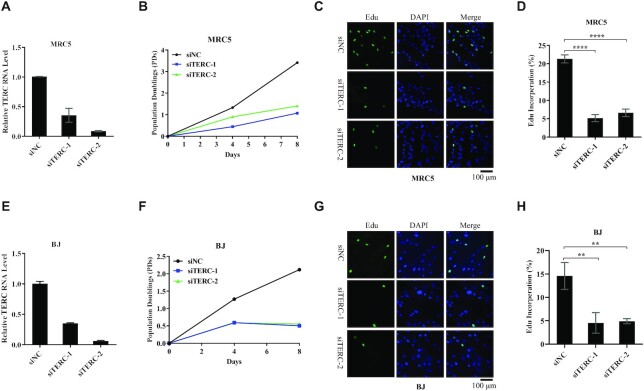
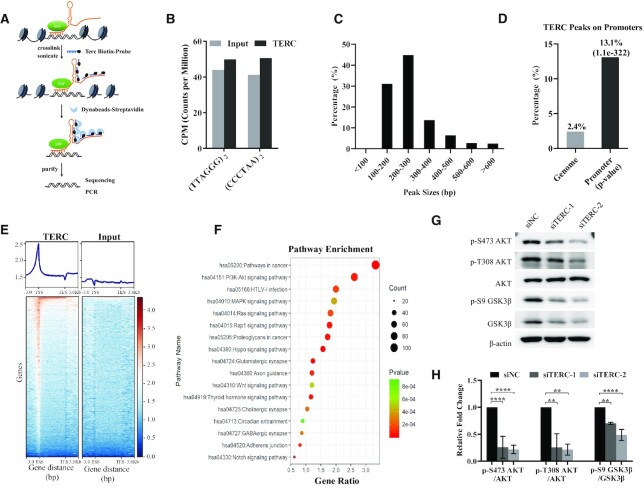
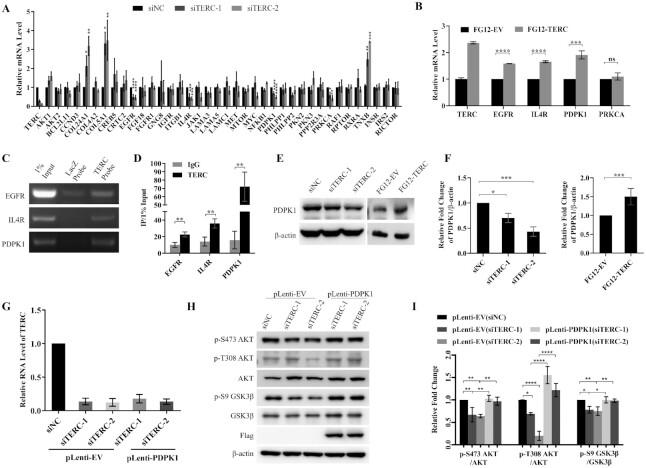
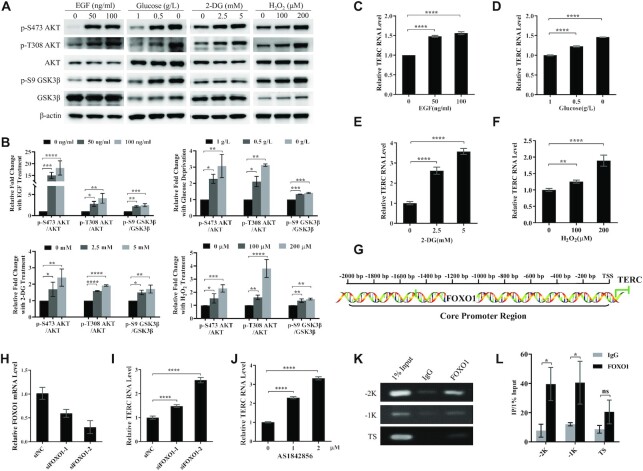
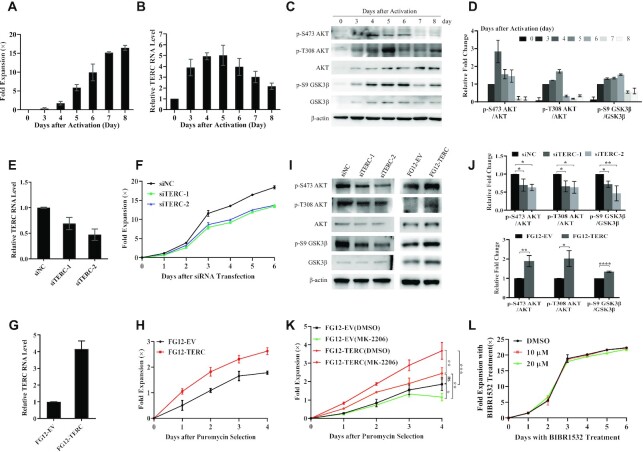
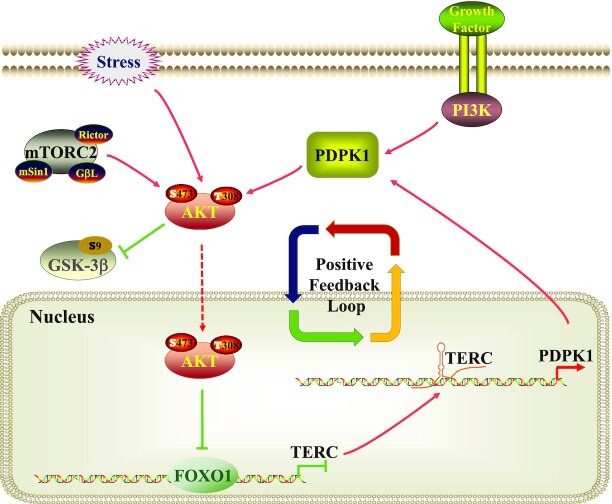
The core catalytic unit of telomerase comprises telomerase reverse transcriptase (TERT) and telomerase RNA (TERC). Unlike TERT, which is predominantly expressed in cancer and stem cells, TERC is ubiquitously expressed in normal somatic cells without telomerase activity. However, the functions of TERC in these telomerase-negative cells remain elusive. Here, we reported positive feedback regulation between TERC and the PI3K-AKT pathway that controlled cell proliferation independent of telomerase activity in human fibroblasts. Mechanistically, we revealed that TERC activated the transcription of target genes from the PI3K-AKT pathway, such as PDPK1, by targeting their promoters. Overexpression of PDPK1 partially rescued the deficiency of AKT activation caused by TERC depletion. Furthermore, we found that FOXO1, a transcription factor negatively regulated by the PI3K-AKT pathway, bound to TERC promoter and suppressed its expression. Intriguingly, TERC-induced activation of the PI3K-AKT pathway also played a critical role in the proliferation of activated CD4+ T cells. Collectively, our findings identify a novel function of TERC that regulates the PI3K-AKT pathway via positive feedback to elevate cell proliferation independent of telomerase activity and provide a potential strategy to promote CD4+ T cells expansion that is responsible for enhancing adaptive immune reactions to defend against pathogens and tumor cells.


Figures

Figure 1.
Figure 1.
TERC depletion decelerates cell proliferation in MRC5 and BJ fibroblast cells. (A) The RNA level of TERC in the control and the TERC-depleted MRC5 cells. MRC5 cells were transfected with two distinct siRNAs target to TERC for 72 h, qPCR analysis of TERC knockdown efficiency. (B) Proliferation of the control and the TERC-depleted MRC5 cells. MRC5 cells were transfected with siRNAs for 8 days, cell PDs (Population Doublings) were used to estimate cell growth. (C) Edu assay of the control and the TERC-depleted MRC5 cells. MRC5 cells transfected with siRNAs for 72 h and then labeled with 10 μM EdU for 2 h. The incorporation of EdU was determined by fluorescence microscope. (D) Quantification of the data in (C), data represent the mean ± SD of three independent experiments, significance was determined using one-way ANOVA with Dunnett’s test, ****P < 0.0001. (E) The RNA level of TERC in the control and the TERC-depleted BJ cells. BJ cells were transfected with two distinct siRNAs target to TERC for 72 h, qPCR analysis of TERC knockdown efficiency. (F) Proliferation of the control and the TERC-depleted BJ cells. BJ cells were transfected with siRNAs for 8 days, and cell PDs (population doublings) were used to estimate cell growth. (G) Edu assay of the control and the TERC-depleted BJ cells. BJ cells transfected with siRNAs for 72 h and then labeled with 10 μM EdU for 4 h. The incorporation of EdU was determined by fluorescence microscope. (H) Quantification of the data in (G), data represent the mean ± SD of three independent experiments, significance was determined using one-way ANOVA with Dunnett’s test, **P = 0.002 (siTERC-1) and 0.0024 (siTERC-2) compared with siNC.
Figure 2.
Figure 2.
TERC occupies genomic sites enrich in the PI3K-AKT signaling pathway. (A) A schematic diagram of ChIRP protocol. Chromatin is cross-linked, fragmented, and hybridized to TERC-biotinylated probes. TERC-bound DNA were purified for DNA sequencing or PCR detection. (B) Counts per million of reads from TERC-ChIRP and Input samples that map to telomere sequences. Reads from ‘TERC ChIRP’ sample and ‘Input’ sample were compared against telomere sequence (TTAGGG)2 and (CCCTAA)2. (C) Histogram distribution of peak sizes from TERC ChIRP-seq. (D) Bar chart showing the percentage of TERC ChIRP-seq peaks on promoters. P-value computed versus genome random. (E) Average signal and heatmaps of TERC ChIRP-seq and Input over hg38 reference genes. (F) KEGG pathway analysis of genes with significant TERC ChIRP-seq peaks. (G) TERC depletion decreased AKT activation in MRC5 cells. The control and the TERC-depleted MRC5 cells were collected for western blotting of indicated proteins. (H) Quantification of the data in (G), data represent the mean ± SD of three independent experiments, significance was determined using one-way ANOVA with Dunnett's test, for p-S473 AKT/AKT: ****P < 0.0001; for p-S308 AKT/AKT: **P = 0.0023 (siTERC-1) and 0.0017 (siTERC-2) compared with siNC; for p-S9 GSK3β/GSK3β: **P = 0.0018, ****P < 0.0001.
Figure 3.
Figure 3.
TERC is involved in the PI3K-AKT pathway through gene transcriptional regulation. (A) The mRNA levels of 38 genes from PI3K-AKT pathway with TERC-ChIRP peaks in the promoters/TSS regions in the control and the TERC-depleted MRC5 cells. MRC5 cells were transfected with two distinct siRNAs target to TERC for 48 h, qPCR analysis of TERC knockdown efficiency and the mRNA levels of 38 genes. Data represent the mean ± SD of three independent experiments, significance was determined using one-way ANOVA with Dunnett’s test, for COL24A1: *P = 0.0330, **P = 0.0015; for COL5A1: *P = 0.0122, **P = 0.0088; for EGFR: ****P < 0.0001; for IL4R: ***P = 0.0003 (siTERC-1) and 0.0001 (siTERC-2) compared with siNC; for PDPK1: ****P < 0.0001; for PRKCA: *P = 0.0111, **P = 0.0022; for TNXB: **P = 0.0014, ***P = 0.0002. (B) The mRNA levels of four screened genes in the control and the TERC-overexpressed MRC5 cells. qPCR analysis of TERC overexpression efficiency and the mRNA levels of four screened genes in MRC5 cells with the expression of FG12-EV or FG12-TERC. Data represent the mean ± SD of three independent experiments, significance was determined using two-tailed Student’s t-test, ****P < 0.0001, ***P = 0.0005, ns = 0.2754. (C) PCR of TERC-immunoprecipitated chromatin for screened genes’ promoter in MRC5 cells. (D) Quantification of the data in (C), data represent the mean ± SD of three independent experiments, significance was determined using two-tailed Student’s t-test, for EGFR: **P = 0.0065; for IL4R: **P = 0.0081; for PDPK1: **P = 0.0016. (E)TERC depletion decreased PDPK1 expression and TERC overexpression induced PDPK1 expression in MRC5 cells. The control and the TERC-depleted or -overexpressed MRC5 cells were collected for western blotting of indicated proteins. (F) Quantification of the data in (E), data represent the mean ± SD of three independent experiments, significance was determined using one-way ANOVA with Dunnett’s test or two-tailed Student’s t-test, TERC knockdown: *P = 0.0297, ***P = 0.0004; TERC overexpression: ***P = 0.0009. (G) Expression of TERC in the TERC-depletion MRC5 cells with exogenous PDPK1. TERC was knocked down in the control and the PDPK1-overexpressed MRC5 for 72 h, qPCR analysis of TERC knockdown efficiency. (H) PDPK1 reversed TERC depletion-induced decrease of AKT phosphorylation level. Cells were treated as shown in (G), and collected for western blotting of indicated proteins. (I) Quantification of the data in (H), data represent the mean ± SD of three independent experiments, significance was determined using one-way ANOVA with Tukey’s test, for p-S473 AKT/AKT: **P = 0.0078 (pLenti-EV(siNC) versus pLenti-EV(siTERC-1)), 0.0044 (pLenti-EV(siNC) versus pLenti-EV(siTERC-2)), 0.0041 (pLenti-EV(siTERC-1) versus pLenti-PDPK1(siTERC-1)) and 0.0082 (pLenti-EV(siTERC-2) versus pLenti-PDPK1(siTERC-2)); for p-S308 AKT/AKT: *P = 0.0376, ****P < 0.0001; for p-S9 GSK3β/GSK3β: *P = 0.0135 (pLenti-EV(siNC) versus pLenti-EV(siTERC-1)) and 0.0057 (pLenti-EV(siTERC-1) versus pLenti-PDPK1(siTERC-1)), **P = 0.0057 (pLenti-EV(siNC) versus pLenti-EV(siTERC-2)) and 0.0094 (pLenti-EV(siTERC-2) versus pLenti-PDPK1(siTERC-2)).
Figure 4.
Figure 4.
Activated AKT induces TERC expression through FOXO1. (A) EGF, glucose starvation, 2-DG and H2O2 induced AKT activation in MRC5 cells. MRC5 cells were treated with EGF (0, 50 and 100 ng/ml with serum starvation) for 15 min, different gradient glucose-containing medium (1, 0.5 and 0 g/L), 2-DG (0, 2.5 and 5 mM) or H2O2 (0, 100 and 200 μM) for 4 h, and collected for western blotting of indicated proteins. (B) Quantification of the data in (A), data represent the mean ± SD of three independent experiments, significance was determined using one-way ANOVA with Dunnett’s test. EGF treatment: for p-S473 AKT/AKT: ***P = 0.0002, ****P < 0.0001; for p-S308 AKT/AKT: *P = 0.0481, **P = 0.0041; for p-S9 GSK3β/GSK3β: **P = 0.0015, ***P = 0.0005. Glucose deprivation: for p-S473 AKT/AKT: *P = 0.0212, **P = 0.0022; for p-S308 AKT/AKT: *P = 0.0157, **P = 0.0024; for p-S9 GSK3β/GSK3β: ***P = 0.0007 (0.5 g/L) and 0.0004 (0 g/L) compared with 1 g/L. 2-DG treatment: for p-S473 AKT/AKT: *P = 0.0366, **P = 0.0026; for p-S308 AKT/AKT: ****P < 0.0001; for p-S9 GSK3β/GSK3β: *P = 0.0127, **P = 0.0048. H2O2 treatment: for p-S473 AKT/AKT: *P = 0.0355, ***P = 0.0004; for p-S308 AKT/AKT: **P = 0.0091, ****P < 0.0001; for p-S9 GSK3β/GSK3β: **P = 0.0051 (100 μM) and 0.0011 (200 μM) compared with 0 μM. (C) EGF induced TERC expression in MRC5 cells. MRC5 cells were serum starved and treated with EGF (0, 50 and 100 ng/ml) for 24 h, and collected for qPCR of TERC expression. Data represent the mean ± SD of three independent experiments, significance was determined using one-way ANOVA with Dunnett’s test, ****P < 0.0001. (D) Glucose deprivation induced TERC expression in MRC5 cells. MRC5 cells were cultured in 1, 0.5 and 0 g/L glucose-containing medium for 24 h, and collected for qPCR of TERC expression. Data represent the mean ± SD of three independent experiments, significance was determined using one-way ANOVA with Dunnett’s test, ****P < 0.0001. (E) 2-DG induced TERC expression in MRC5 cells. MRC5 cells were treated with 2-DG (0, 2.5 and 5 mM) for 24 h, and collected for qPCR of TERC expression. Data represent the mean ± SD of three independent experiments, significance was determined using one-way ANOVA with Dunnett's test, ****P < 0.0001. (F) H2O2 induced TERC expression in MRC5 cells. MRC5 cells were treated with H2O2 (0, 100 and 200 μM) for 24 h, and collected for qPCR of TERC expression. Data represent the mean ± SD of three independent experiments, significance was determined using one-way ANOVA with Dunnett’s test, **P = 0.0025, ****P < 0.0001. (G) Schematic diagram of predicted FOXO1 binding site in TERC promoter. (H) The mRNA level of FOXO1 in the control and the FOXO1-depleted MRC5 cells. MRC5 cells were transfected with two distinct siRNAs target to FOXO1 for 72 h, qPCR analysis of FOXO1 knockdown efficiency. (I) The RNA level of TERC in the control and the FOXO1-depleted MRC5 cells. MRC5 cells were treated as shown in (H), qPCR analysis of TERC expression. Data represent the mean ± SD of three independent experiments, significance was determined using one-way ANOVA with Dunnett’s test, ****P < 0.0001. (J) The RNA level of TERC in the DMSO-treated and the AS1842856-treated MRC5 cells. MRC5 cells were treated with AS1842856 (0, 1 and 2 μM) for 24 h, and collected for qPCR analysis of TERC expression. Data represent the mean ± SD of three independent experiments, significance was determined using one-way ANOVA with Dunnett’s test, ****P < 0.0001. (K) PCR of FOXO1-immunoprecipitated chromatin for TERC promoter in MRC5 cells. (L) Quantification of the data in (K), data represent the mean ± SD of three independent experiments, significance was determined using two-tailed Student’s t-test, for -2K: *P = 0.0104; for -1K: *P = 0.0285; for TS: ns = 0.0747.
Figure 5.
Figure 5.
TERC elevates the proliferation of activated CD4+ T cells through activating AKT in a telomerase activity-independent manner. (A) Fold expansion of peripheral blood CD4+ T cells after in vitro activation. Negatively selected-CD4+ T cells were activated with ImmunoCult Human CD3/CD28 T Cell Activator in ImmunoCult™-XF T Cell Expansion Medium supplemented with 10 ng/ml IL-2, on days 0, 3, 4, 5, 6, 7 and 8, viable cells were counted and fold expansion was calculated. (B) TERC RNA level was increased in peripheral blood CD4+ T cells after in vitro activation. Cells were activated as shown in (A), on days 0, 3, 4, 5, 6, 7 and 8, cells were collected for RNA extraction, qPCR analysis of TERC expression. (C) AKT was activated in peripheral blood CD4+ T cells after in vitro activation. Cells were activated as shown in (A), on days 0, 3, 4, 5, 6, 7 and 8, cells were collected for western blotting of indicated proteins. (D) Quantification of the data in (C), data represent the mean ± SD of three independent experiments. (E) The RNA level of TERC in the control and the TERC-depleted activated CD4+ T cells. Naïve CD4+ T cells were activated with ImmunoCult Human CD3/CD28 T Cell Activator for 3 days followed by transfecting with two distinct siRNAs target to TERC for 6 days, qPCR analysis of TERC knockdown efficiency. (F) Proliferation of the control and the TERC-depleted activated CD4+ T cells. Activated CD4+ T cells were transfected with siRNAs for 6 days, viable cells were counted and fold expansion was calculated. (G) The RNA level of TERC in the control and the TERC-overexpressed activated CD4+ T cells. Naïve CD4+ T cells were activated with ImmunoCult Human CD3/CD28 T Cell Activator for 3 days followed by lentivirus infection (FG12-Vector or FG12-TERC) for 24 hours, and selected with puromycin for 24 h, qPCR analysis of TERC overexpression efficiency. (H) Proliferation of the control and the TERC-overexpressed activated CD4+ T cells. Activated CD4+ T cells were treated as shown in (G), and the TERC-stably expressed activated CD4+ T cells were constructed after puromycin selection, viable cells were counted and fold expansion was calculated. (I) TERC depletion decreased AKT activation and TERC overexpression induced AKT activation in activated CD4+ T cells. The control and the TERC-depleted or -overexpressed activated CD4+ T cells were collected for western blotting of indicated proteins. (J) Quantification of the data in (I), data represent the mean ± SD of three independent experiments, significance was determined using one-way ANOVA with Dunnett’s test or two-tailed Student’s t-test. TERC knockdown: for p-S473 AKT/AKT: *P = 0.0250 (siTERC-1) and 0.0107 (siTERC-2) compared with siNC; for p-S308 AKT/AKT: *P = 0.0313 (siTERC-1) and 0.0231 (siTERC-2) compared with siNC; for p-S9 GSK3β/GSK3β: *P = 0.0308, **P = 0.0029. TERC overexpression: for p-S473 AKT/AKT: **P = 0.0058; for p-S308 AKT/AKT: *P = 0.0123; for p-S9 GSK3β/GSK3β: ****P < 0.0001. (K) MK-2206 rescued TERC overexpression-induced cell proliferation. Activated CD4+ T cells with EV or TERC stable overexpression were constructed, and treated with DMSO, MK-2206 (an AKT inhibitor, 2.5 μM) for 4 days, viable cells were counted and fold expansion was calculated. Data represent the mean ± SD of three independent experiments, significance was determined using two-way ANOVA with Tukey’s test, *P = 0.0399, **P = 0.0099 (FG12-TERC(DMSO) versus FG12-TERC(MK-2206)) and 0.0075 (FG12-EV(MK-2206) versus FG12-TERC(MK-2206)), ***P = 0.0008, ns = 0.2283. (L) Proliferation of DMSO and BIBR1352-treated activated CD4+ T cells. Activated CD4+ T cells were treated with DMSO or BIBR1352 for 6 days, viable cells were counted and fold expansion was calculated.
Figure 6.
Figure 6.
Proposed working model for TERC to regulate cell proliferation independent of telomerase activity via the positive feedback loop with the PI3K-AKT pathway (see text for details).

Similar articles

Cited by

References

    1. Wellinger R.J. In the end, what's the problem?. Mol. Cell. 2014; 53:855–856. - PubMed
    1. Morin G.B. The human telomere terminal transferase enzyme is a ribonucleoprotein that synthesizes TTAGGG repeats. Cell. 1989; 59:521–529. - PubMed
    1. Blackburn E.H., Collins K.. Telomerase: an RNP enzyme synthesizes DNA. Cold Spring Harb. Perspect. Biol. 2011; 3:a003558. - PMC - PubMed
    1. Nandakumar J., Cech T.R.. Finding the end: recruitment of telomerase to telomeres. Nat. Rev. Mol. Cell Biol. 2013; 14:69–82. - PMC - PubMed
    1. Cong Y.S., Wright W.E., Shay J.W.. Human telomerase and its regulation. Microbiol. Mol. Biol. Rev. 2002; 66:407–425. - PMC - PubMed

MeSH terms