. 2022 Mar;603(7903):949-956.
doi: 10.1038/s41586-022-04543-1. Epub 2022 Mar 23.

Inhibition of calcium-triggered secretion by hydrocarbon-stapled peptides

Affiliations

Inhibition of calcium-triggered secretion by hydrocarbon-stapled peptides

Ying Lai et al. Nature. 2022 Mar.

Abstract

Membrane fusion triggered by Ca2+ is orchestrated by a conserved set of proteins to mediate synaptic neurotransmitter release, mucin secretion and other regulated exocytic processes1-4. For neurotransmitter release, the Ca2+ sensitivity is introduced by interactions between the Ca2+ sensor synaptotagmin and the SNARE complex5, and sequence conservation and functional studies suggest that this mechanism is also conserved for mucin secretion6. Disruption of Ca2+-triggered membrane fusion by a pharmacological agent would have therapeutic value for mucus hypersecretion as it is the major cause of airway obstruction in the pathophysiology of respiratory viral infection, asthma, chronic obstructive pulmonary disease and cystic fibrosis7-11. Here we designed a hydrocarbon-stapled peptide that specifically disrupts Ca2+-triggered membrane fusion by interfering with the so-called primary interface between the neuronal SNARE complex and the Ca2+-binding C2B domain of synaptotagmin-1. In reconstituted systems with these neuronal synaptic proteins or with their airway homologues syntaxin-3, SNAP-23, VAMP8, synaptotagmin-2, along with Munc13-2 and Munc18-2, the stapled peptide strongly suppressed Ca2+-triggered fusion at physiological Ca2+ concentrations. Conjugation of cell-penetrating peptides to the stapled peptide resulted in efficient delivery into cultured human airway epithelial cells and mouse airway epithelium, where it markedly and specifically reduced stimulated mucin secretion in both systems, and substantially attenuated mucus occlusion of mouse airways. Taken together, peptides that disrupt Ca2+-triggered membrane fusion may enable the therapeutic modulation of mucin secretory pathways.


Conflict of interest statement

The authors declare no competing interests.

Figures

Fig. 1
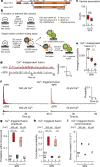
Fig. 1. Mucin secretion defects in Syt2-mutant mice.
a, Transverse sections of bronchial airways of mice stained with periodic acid fluorescent Schiff (PAFS) to demonstrate mucin with red fluorescence. Top, in naive mice without airway inflammation, scant intracellular mucin is visible. Treatment with IL-13 increases mucin synthesis, resulting in abundant intracellular mucin. Bottom, subsequent treatment with ATP induces mucin secretion, reducing intracellular mucin in WT C57Bl/6J mice (WT) and Syt2F/F mice (F/F), but not in Syt2D/D mice (D/D). Scale bar, 50 µm. b, Fractional mucin secretion was measured by analysing images of airways of mice treated with IL-13 alone and comparing those with those of mice treated with IL-13 followed by ATP, as shown in a. Individual data points and box plots are shown for two independent sets of experiments combined to give a total n mice (indicated below each box plot) per group (Supplementary Table 1). Comparison with the Syt2F/F group of mice was performed using two-tailed unpaired Student’s t-tests; ***P = 0.00026. c, Transverse sections of bronchial airways of mice treated with IL-13, then with methacholine (Mch) to induce smooth muscle contraction and mucin secretion, and fixed with methacarn and stained with PAFS to demonstrate lumenal mucus and residual intracellular mucin. Scale bar, 50 µm. d, The sum of the lumenal mucus cross-sectional area in the left lung measured at 500 µm intervals. Individual data points and box plots are shown for two independent sets of experiments combined to give a total of n mice (indicated below each box plot) per group (Supplementary Table 1). Comparison with the Syt2F/F group of mice was performed using two-tailed unpaired Student’s t-tests; **P = 0.0012. Source data
Fig. 2
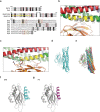
Fig. 2. Characterization of SP9.
a, Magnified view of the primary interface between the neuronal SNARE complex (VAMP-2 (blue), Stx1 (red) and SNAP-25A (green)) and the C2B domain of Syt1 (orange) (Protein Data Bank (PDB): 5W5C), indicating the region (yellow) that corresponds to the stapled peptide SP9 with staples shown as dumbbells. b, Schematic of the synthesis of SP9. Hydrocarbon-stapled peptides are formed by cross-linking residues at the specified positions. c, Sequences of peptides. S5 indicates S stereochemistry at the α-carbon, with 5 carbon atoms in the olefinic side chains. The superscripts denote the start and end positions of the SNAP-25A sequence. d, Circular dichroism (CD) spectra of 100 mM peptides measured at pH 7.4 and at 25 ± 1 °C. e, The percentage of α-helical content in these peptides was estimated by dividing the mean residue ellipticity [φ]222obs by the reported [φ]222obs for a model helical decapeptide. f, Interactions between Cy3-labelled SP9 or P0 and unlabelled Syt1 C2B, the quintuple Syt1 C2B(QM) mutant and Syt2 C2B as measured by bulk fluorescence anisotropy (Methods). Data are mean ± s.e.m. along with individual data points from n = 3–7 independent experiments. Hill equations were fit to estimate the dissociation constant Kd, where the Hill coefficients were constrained to 1. g, Peptide conformations (colours) after five independent 1 μs molecular dynamics simulations of SP9–Syt1 C2B (left) and P9–Syt1 C2B (right) superimposed onto the structure of the primary interface (grey). The simulations started from a conformation (Extended Data Fig. 2f, g) that was derived from the crystal structure PDB 5W5C (Supplementary Videos 1 and 2). For one simulation of P9–Syt1 C2B, the P9 peptide dissociated around 168 ns. Source data
Fig. 3
Fig. 3. SP9 inhibits triggered fusion in a reconstituted system.
a, The domain structure of Munc13-2 and its fragment (Munc13-2*). b, Single-vesicle content mixing assay with complete reconstitution (Methods). Stapled peptide (10 μM) was added together with SG vesicles and was present during all of the subsequent stages. c, The effect of SP9 on vesicle association. d, Corresponding Ca2+-independent fusion probabilities. e, Corresponding average probabilities of Ca2+-independent fusion events per second. For comparison, the result for the SR assay (Extended Data Fig. 7) is also shown. ***P = 0.00016. f, Corresponding Ca2+-triggered fusion probabilities at 500 µM and 50 µM Ca2+. gi, Corresponding Ca2+-triggered fusion amplitudes of the first 1 s time bin after injection with 500 μM Ca2+ (g) (from left to right, ***P = 0.0000053, **P = 0.0024, **P = 0.0012); the cumulative Ca2+-triggered fusion probability within 1 min (h) (from left to right, ***P = 0.000058, **P = 0.0037, **P = 0.0026); and the decay rate (1/τ) of the Ca2+-triggered fusion histogram (i). The fusion probabilities and amplitudes were normalized to the number of analysed SG–airway PM vesicle pairs (Supplementary Table 2). For comparison, the results for the SR assay (Extended Data Fig. 7) are also shown. For c, e, g and h, box plots and data points are shown for n (indicated below each box plot) independent repeat experiments (Supplementary Table 2). For c, eg and h, statistical analysis was performed using two-tailed Student’s t-tests. Decay constants (boxes) and error estimates (bars) in i were computed from the covariance matrix after fitting the corresponding histograms combining all repeats with a single exponential decay function using the Levenberg–Marquardt algorithm. Source data
Fig. 4
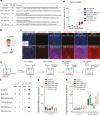
Fig. 4. SP9 inhibits mucin secretion from airway epithelial cells.
a, The design of synthesized SP9 with biotin or CPPs conjugated to the N terminus and Cy3 to the C terminus, respectively. Biotin–SP9–Cy3 was bound to streptavidin-conjugated C2 or CRM197. b, Diagram of the analysis of cumulated Cy3 intensities within individual HAE cells. c, Confocal collapse (projected) images of fixed HAE cells that were treated with SP9–Cy3 or SP9–Cy3 conjugated to bacterial toxins (C2, CRM197) or CPPs. Scale bar, 10 µm. The experiment was independently repeated twice with air–liquid interface (ALI) cultures from different donors with similar results. d, Quantitative analysis of intracellular Cy3 fluorescence for each peptide in MUC5AC+ HAE cells. Box plots and data points are shown for n cells (indicated below each box plot). Statistical analysis was performed using one-way analysis of variance (ANOVA) followed by post hoc Dunnett’s test; ***P < 0.0001. e, Schematic of the peptide application and sample collection from HAE cells maintained under ALI conditions. f, Representative western blot immunofluorescence images for MUC5AC on an apical surface of untreated HAE cells (control), HAE cells treated with 10 μM of SP9–Cy3, or 10 μM of either SP9–Cy3 or P9–Cy3 conjugated to CPPs for 30 min before stimulation. Basl., MUC5AC secretion during a 30 min period before stimulation (baseline). Exp., MUC5AC secreted within a 30 min experimental period with (IL-13 + ATP) or without (IL-13) stimulation of HAE cells with 100 µM ATP. Cells were treated with IL-13 to induce mucous metaplasia. All of the original blots are shown in Supplementary Fig. 1a. g, h, The ratio of baseline to reference wash secretion (fold increase in baseline secretion over reference secretion) (g) and the ratio of experimental to baseline (fold increase in stimulated secretion over baseline secretion) (h) for each condition in f. The numbers below the box plots indicate n for each condition, representing individual ALI cultures derived from four donors for each condition. Statistical analysis was performed using two-way ANOVA followed by post hoc Dunnett’s test; *P = 0.013. Source data
Fig. 5
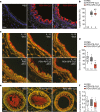
Fig. 5. SP9 inhibits mucin secretion and mucus occlusion in mice.
a, Transverse sections of mouse bronchial airways showing intracellular uptake of peptides (200 μM microsprayer concentration; Cy3 is visualized in red). Nuclei fluoresce blue (DAPI), overlaid on bright-field images. Scale bar, 25 µm. b, Averaged uptake fractions for two independent experiments for a total n cells (indicated below each box plot) per group (Supplementary Table 1). Total of n = 260 (PEN–SP9–Cy3) and n = 361 (PEN–P9–Cy3) cells (6 sections from 3 mice per peptide). Statistical analysis was performed using a two-tailed unpaired Student’s t-test, showing a non-significant difference (P = 0.83). ND, not detected. c, Fractional mucin secretion was measured by analysis of images of mouse airways treated with IL-13 to induce mucous metaplasia (top row), followed by stimulation of secretion with methacholine or PBS as control (bottom row). The sections were taken 3 mm distal to those in Fig. 1. Mice that were pretreated with PBS or PEN–P9–Cy3 show greater reductions in intracellular mucin content (PAFS stain (red)) in response to methacholine compared with mice that were pretreated with PEN–SP9–Cy3. Scale bar, 25 µm. d, Fractional mucin secretion measured as in c. Box plots and data points are shown for two independent experiments for a total n mice (indicated below each box plot) per group. Statistical analysis was performed using a two-tailed unpaired Student’s t-test, showing a significant difference between mice that were pretreated with PEN–SP9–Cy3 compared with those that were pretreated with PBS; ***P = 0.00000001. e, Airway lumenal mucus was measured by image analysis as in Fig. 1, except that the right lungs were examined instead of the left lungs. Scale bar, 25 µm. f, The sum of lumenal mucus cross-sectional area in the caudal lobe of the right lung measured at 500 µm intervals. Box plots and data points are shown for two independent experiments combined for a total n mice (indicated below each box plot) per group. Statistical analysis was performed using a two-tailed unpaired Student’s t-test, showing a significant difference between mice that were pretreated with PEN–SP9–Cy3 compared with those that were pretreated with PBS; *P = 0.027. Source data
Extended Data Fig. 1
Extended Data Fig. 1. Related to Figure 1. Efficiency of Syt2 deletion in airway secretory cells.
Bronchial airways of Syt2WT and Syt2D/D mice were stained with antibodies to Syt2 and secondary antibodies conjugated to horseradish peroxidase (brown colour, see Methods). Secretory cells in Syt2 WT mice (left panel) have a domed appearance with their apical poles staining intensely for Syt2 (filled triangle). There was less intense linear staining of tufted ciliated cells in the region of ciliary basal bodies (open triangle), which often stain non-specifically. Secretory cells in Syt2D/D mice did not stain for Syt2 (filled triangle), but linear staining of ciliated cells was similar to that in Syt2WT. We enumerated secretory cells in 3 mice of each genotype and found 46% in Syt2WT and 48% in Syt2D/D, ±4%, which did not differ significantly, indicating there was no loss of viability of secretory cells in Syt2D/D mice. In Syt2WT mice, 91% of secretory cells stained for Syt2, whereas in Syt2D/D mice, only 7% stained for Syt2, indicating a deletion efficiency ~92%. Results for Syt2F/F mice were indistinguishable from those for Syt2WT. Scale bar, 50 µm. Experiments were repeated twice with similar results.
Extended Data Fig. 2
Extended Data Fig. 2. Related to Figure 2. The conservation of the primary interface.
a, Primary sequence alignments between neuronal and airway systems (Stx1A vs. Stx3, SNAP-25A vs. SNAP-23, and Syt1 vs. Syt2). White: absolutely conserved, grey: similar, black: not conserved. Red boxes indicate residues involved in salt bridges and hydrogen bonds, orange boxes indicate residues involved in hydrophobic interactions in the primary interface. The yellow line indicates the residues of SP9 shown as the yellow region in panel b and c. b, Close-up view of the primary interface (PDB ID 5W5C) with grey colour and labels indicating the locations of sequence differences in the primary interface between the neuronal and airway epithelial systems (SNAP-25A vs. SNAP-23, Syt1 vs. Syt2); the corresponding labels indicate the sequence differences. Yellow: region that corresponds to SP9 with staples shown as dumbbells. c, Close-up view of the primary interface with residues shown as sticks that are important for the primary interface, including R281, E295, Y338, R398, R399 in Syt1 C2B (also corresponding to residues mutated in Syt1(QM)) and K40, D51, E52, E55, Q56, D166 in SNAP-25A and D231, E234, E238 in Stx1A. Yellow: region that corresponds to SP9 with staples shown as dumbbells.d, Starting point of the molecular dynamics simulations of the primary interface. e, End points of five independent 1-μsec simulations (colours) of the primary interface. f, Starting point of the SP9–Syt1-C2B simulations. g, Starting point of the P9–Syt1-C2B simulations. All starting points were derived from the crystal structure with PDB ID 5W5C.
Extended Data Fig. 3
Extended Data Fig. 3. Related to Figure 2. Characterization of the oligomeric state of SP9.
a, Size exclusion chromatography (SEC) profiles of peptides. Each peptide was filtered with a 0.2 micrometer filter and then loaded on a Superdex 75 column in buffer V (20 mM HEPES, pH 7.4, 90 mM NaCl). The dashed line indicates the border of the void volume at ~8 ml. The difference in retention times for P0 and SP9 may be related to the conformations of the peptides. b, Representative TIRF images of immobilized SP9-Cy3 at specified concentrations. Scale bar, 410 μm. c, Representative time traces showing single-molecule stepwise photobleaching events of SP9-Cy3. Black lines correspond to the fluorescence intensity of SP9-Cy3 and red lines correspond to the idealized trajectory obtained by Hidden Markov Model analysis (HMM) (Methods). d, Distribution of multiple SP9-Cy3 molecules in (diffraction limited) fluorescent spots at specified concentrations. Fluorescent spots were automatically selected by smCamera. The number of SP9-Cy3 molecules per fluorescent spot was determined from the observed fluorescence intensity time traces by HMM and verified by manual inspection (Methods). Bar graphs were calculated from 167, 675, 937, and 520 selected traces at concentrations of 0.5, 1, 10, and 100 nM SP9-Cy3, respectively. Source data
Extended Data Fig. 4
Extended Data Fig. 4. Related to Figure 3. SP9 inhibits both Ca2+-independent and Ca2+-triggered vesicle fusion with reconstituted neuronal SNAREs and Syt1.
a, Schematic of the single vesicle content mixing assay. Neuronal PM: plasma membrane mimic vesicles with reconstituted Stx1A and SNAP-25A; SV: synaptic vesicle mimic with reconstituted VAMP2 and Syt1. After SV - neuronal PM vesicle association, vesicle pairs either undergo Ca2+-independent fusion or remain associated until fusion is triggered by Ca2+ addition. 10 μM of P0 or SP9 was added together with SV vesicles and was present in all subsequent stages. b, Effect P0 and SP9 on vesicle association. c, Corresponding Ca2+-independent fusion probabilities. d, Corresponding average probabilities of Ca2+-independent fusion events per second (*** p = 0.00022). e, Corresponding Ca2+-triggered fusion probabilities. (f–h) Corresponding Ca2+-triggered fusion amplitudes of the first 1-sec time bin upon 500 μM Ca2+-injection (f) (* p = 0.017), the cumulative Ca2+-triggered fusion probability within 1 min (g) (* p = 0.039), and the decay rate (1/τ) of the Ca2+-triggered fusion histogram (h). The fusion probabilities and amplitudes were normalized to the number of analysed neuronal SV - neuronal PM vesicle pairs (Supplementary Table 2). Panels b, d, f, g show box plots and data points for n (indicated below each box plot) independent repeat experiments (Supplementary Table 2). Two-tailed Student’s t-tests were used for SP9 vs. No SP. Decay constants (boxes) and error estimates (bars) in panels h computed from the covariance matrix upon fitting the corresponding histograms combining all repeats with a single exponential decay function using the Levenberg-Marquardt algorithm. Source data
Extended Data Fig. 5
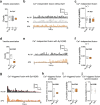
Extended Data Fig. 5. Related to Figure 3. SP9 has no effect on vesicle fusion mediated by neuronal SNAREs alone, or by Syt1(QM).
a–c, SP9 has no effect on vesicle fusion mediated by neuronal SNAREs alone. a, Effects of 10 μM of P0 or SP9 on vesicle association. b, Corresponding Ca2+-independent fusion probabilities. c, Corresponding average probabilities of Ca2+-independent fusion events per second. d–j, the quintuple Syt1(QM) mutant alleviates the inhibitory effect of SP9 on neuronal synaptic vesicle fusion. d, Effect of 10 μM of SP9 on vesicle association (* p = 0.01629). e, Corresponding Ca2+-independent fusion probabilities. f, Corresponding average probabilities of Ca2+-independent fusion events per second. g, Corresponding Ca2+-triggered fusion probabilities. (h–j) Corresponding Ca2+-triggered fusion amplitude of the first 1-sec time bin upon 500 μM Ca2+-injection (h), the cumulative Ca2+-triggered fusion probability within 1 min (i), and the decay rate (1/τ) of the Ca2+-triggered fusion histogram (j). The fusion probabilities and amplitudes were normalized to the number of analysed neuronal SV - neuronal PM vesicle pairs (Supplementary Table 2). Panels a, c, d, f, h, i show box plots and data points for n (indicated below each box plot) independent repeat experiments (Supplementary Table 2). Two-tailed Student’s t-tests were used for SP9 vs. No SP. Decay constants (boxes) and error estimates (bars) in panels j computed from the covariance matrix upon fitting the corresponding histograms combining all repeats with a single exponential decay function using the Levenberg-Marquardt algorithm. Source data
Extended Data Fig. 6
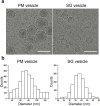
Extended Data Fig. 6. Related to Figure 3. Airway PM and SG vesicle preparation.
a, Cryo-EM images of airway PM and SG vesicles as defined in Methods. Scale bar, 100 nm. b, Diameter distributions for airway PM and SG vesicles. Source data
Extended Data Fig. 7
Extended Data Fig. 7. Related to Figure 3. SP9 inhibits Ca2+-triggered vesicle fusion with reconstituted airway epithelial SNAREs and Syt2.
a, Schematic of the single vesicle content mixing assay. Airway PM: plasma membrane mimic vesicles with reconstituted airway Stx3 and SNAP-23; SG: secretory granule mimics with reconstituted VAMP8 and Syt2. After SG - airway PM vesicle association, vesicle pairs either undergo Ca2+-independent fusion or remain associated until fusion is triggered by Ca2+ addition. 10 μM of P0 or SP9 was added together with SG vesicles and was present during all subsequent stages. b, Effects of P0 or SP9 on vesicle association. c, Corresponding Ca2+-independent fusion probabilities. d, Corresponding average probabilities of Ca2+-independent fusion events per second (* p = 0.014). e, Corresponding Ca2+-triggered fusion probabilities. (f–h) Corresponding Ca2+-triggered fusion amplitudes of the first 1-sec time bin upon 500 μM Ca2+-injection (f) (* p = 0.012), the cumulative Ca2+-triggered fusion probability within 1 min (g) (** p = 0.0018), and the decay rate (1/τ) of the Ca2+-triggered fusion histogram (h). i–k, SP9 has no effect on vesicle fusion mediated by airway SNAREs alone. i, Effects of 10 μM of P0 or SP9 on vesicle association using the assay described above. j, Corresponding Ca2+-independent fusion probabilities. k, Corresponding average probabilities of Ca2+-independent fusion events per second. Panels b, d, f, g, i, k show box plots and data points for n (indicated below each box plot) independent repeat experiments (Supplementary Table 2). Two-tailed Student’s t-tests were used for SP9 vs. No SP. Decay constants (boxes) and error estimates (bars) in panel h computed from the covariance matrix upon fitting the corresponding histograms combining all repeats with a single exponential decay function using the Levenberg-Marquardt algorithm. Source data
Extended Data Fig. 8
Extended Data Fig. 8. Related to Figure 4. SP9 penetrates epithelial cells when conjugated to CPPs and inhibit mucin secretion from airway epithelium cells.
a, Representative confocal images (z-sections) of fixed HAE cells treated with SP9-Cy3 or SP9-Cy3 conjugated to CPPs or biotin. Biotin-SP9-Cy3 was bound to streptavidin-conjugated C2 or CRM197. The experiment was repeated twice with ALI cultures from different donors with similar results. Scale bar, 10 µm. b, The diagram illustrates the analysis of intracellular localization of MUC5AC, Cy3, and DAPI in airway secretory cells. Fluorescence intensities of DAPI, AlexaFluor 488 (MUC5AC) and Cy3 were analysed within individual MUC5AC+ cells at each z-section, normalized and fluorescence intensity traces calculated along the basolateral to apical cell axis. c, Representative western blot immunofluorescence images for MUC5AC on apical surface of untreated HAE cells (control 1 and 2) or HAE cells treated with 100 μM SP9-Cy3, PEN-SP9-Cy3, TAT-SP9-Cy3, PEN-P9-Cy3, or TAT-P9-Cy3 for 24 h before stimulation. Wash represents MUC5AC accumulated during culture and before start of experiment. Baseline represents unstimulated MUC5AC secretion during a 15 min period after removal of accumulated MUC5AC and experimental represents MUC5AC secreted within 15 min of stimulation with (ATP) or without (no ATP) 100 µM ATP. Lysate represents MUC5AC within HAE cells at the end of the experiment. Cells were treated with IL-13 to induce mucous metaplasia. All original blots are shown in Supplementary Fig 1b. d, Box plots and data points show the ratio of experimental / baseline secretion (fold increase of stimulated secretion over baseline secretion) following 24 h preincubation with 100 μM of the respective peptides. Numbers below box-plots indicate n for each condition, representing individual ALI cultures derived from 4 donors for each condition. * p = 0.046 for HAE cells treated with 100 μM PEN-SP9-Cy3, and p = 0.016 for HAE cells treated with 100 μM TAT-SP9-Cy3, assessed by two-way ANOVA followed by post-hoc Dunnett`s test. Source data
Extended Data Fig. 9
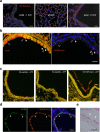
Extended Data Fig. 9. Related to Figure 5. Uptake of labelled SP9 conjugated to CPP into mouse airway epithelial cells.
a, Predominant delivery of 100 µM TAT-SP9-Cy3 to distal airways of mice using a microsprayer. The left panel shows a lack of uptake of the labelled peptide in the proximal axial bronchus, sectioned 1 mm below our usual site of transverse section between lateral branches 1 and 2, though uptake in alveoli surrounding the airway can be seen. The middle panel shows a section through the periphery of the lung, with extensive uptake of the labelled peptide in alveolar epithelial cells. The right panel shows patchy uptake of the labelled peptide in the distal axial bronchus, sectioned 3 mm below lateral branches 1 and 2. Scale bar, 50 µm. b, Two serial transverse sections of the left axial bronchus of a mouse with mucous metaplasia induced by prior instillation of IL-13, then treated with 300 µM aerosolized TAT-SP9-Cy3. The left panel is stained with PAFS (red) to demonstrate intracellular mucin, and shows some cells with high mucin content (open arrowheads) and other cells with low mucin content (closed arrowheads), presumably due to induced mucin secretion. The right panel shows blue fluorescent staining of nuclei with DAPI and red fluorescent staining of epithelial cells that have internalized TAT-SP9-Cy3. The same cells indicated in the left panel are also indicated in the right panel, showing that cells that internalize TAT-SP9-Cy3 tend to have low intracellular mucin content, possibly due to the cell-penetrating peptide conjugate allowing calcium entry into the cytoplasm to induce secretion. Scale bar, 20 µm. c, Sections of the left axial bronchus of mice with mucous metaplasia induced by prior instillation of IL-13, and not further treated (left panel), or subsequently treated with aerosolized 100 mM ATP (middle panel) or 1 mM TAT-SP9-Cy3 (right panel). These show high intracellular mucin content (red: PAFS stain) in the mice not treated with an aerosolized drug, extensive secretion of intracellular mucin in the mice treated with ATP, and extensive apocrine mucin secretion in the mice treated with TAT-SP9-Cy3, possibly due to disruption of mucin granule membrane integrity causing intracellular mucin swelling at this high peptide concentration. Scale bar, 50 µm. d, Transverse section of the left axial bronchus of a mouse taken 30 min after treatment with aerosolized 20 µM PEN-SP9-Cy3. Immunofluorescent staining for CCSP shows green secretory cells (arrowheads), red PEN-SP9-Cy3 fluorescence, and blue nuclei stained with DAPI. Green secretory cells are observed to not visibly take up PEN-SP9-Cy3, in contrast to ciliated cells, the other major airway epithelial cell type that is not labelled here with a lineage marker, but avidly internalize red PEN-SP9-Cy3 fluorescence. Scale bar, 50 µm. e, Section of the left axial bronchus of a mouse treated as in “c” (with PEN-SP9-Cy3), showing red fluorescent staining of ciliated cells with ciliary tufts clearly visible by differential interference microscopy (arrowheads), but no staining of intervening secretory cells. Scale bar, 20 µm. Similar results were obtained multiple times.

Comment in

Similar articles

Cited by

References

    1. Jaramillo AM, Azzegagh Z, Tuvim MJ, Dickey BF. Airway mucin secretion. Ann. Am. Thorac. Soc. 2018;15:S164–S170. - PMC - PubMed
    1. Davis CW, Dickey BF. Regulated airway goblet cell mucin secretion. Annu. Rev. Physiol. 2008;70:487–512. - PubMed
    1. Südhof TC. Neurotransmitter release: the last millisecond in the life of a synaptic vesicle. Neuron. 2013;80:675–690. - PMC - PubMed
    1. Thorn P, Zorec R, Rettig J, Keating DJ. Exocytosis in non-neuronal cells. J. Neurochem. 2016;137:849–859. - PubMed
    1. Zhou Q, et al. Architecture of the synaptotagmin–SNARE machinery for neuronal exocytosis. Nature. 2015;525:62–67. - PMC - PubMed