SARS-CoV-2 Spike Protein 1 Activates Microvascular Endothelial Cells and Complement System Leading to Platelet Aggregation
- PMID: 35320941
- PMCID: PMC8936079
- DOI: 10.3389/fimmu.2022.827146
SARS-CoV-2 Spike Protein 1 Activates Microvascular Endothelial Cells and Complement System Leading to Platelet Aggregation
Abstract
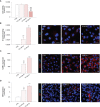
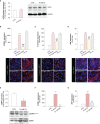
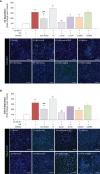
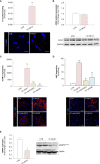
Microvascular thrombosis is associated with multiorgan failure and mortality in coronavirus disease 2019 (COVID-19). Although thrombotic complications may be ascribed to the ability of SARS-CoV-2 to infect and replicate in endothelial cells, it has been poorly investigated whether, in the complexity of viral infection in the human host, specific viral elements alone can induce endothelial damage. Detection of circulating spike protein in the sera of severe COVID-19 patients was evaluated by ELISA. In vitro experiments were performed on human microvascular endothelial cells from the derma and lung exposed to SARS-CoV-2-derived spike protein 1 (S1). The expression of adhesive molecules was studied by immunofluorescence and leukocyte adhesion and platelet aggregation were assessed under flow conditions. Angiotensin converting enzyme 2 (ACE2) and AMPK expression were investigated by Western Blot analysis. In addition, S1-treated endothelial cells were incubated with anti-ACE2 blocking antibody, AMPK agonist, or complement inhibitors. Our results show that significant levels of spike protein were found in the 30.4% of severe COVID-19 patients. In vitro, the activation of endothelial cells with S1 protein, via ACE2, impaired AMPK signalling, leading to robust leukocyte recruitment due to increased adhesive molecule expression and thrombomodulin loss. This S1-induced pro-inflammatory phenotype led to exuberant C3 and C5b-9 deposition on endothelial cells, along with C3a and C5a generation that further amplified S1-induced complement activation. Functional blockade of ACE2 or complement inhibition halted S1-induced platelet aggregates by limiting von Willebrand factor and P-selectin exocytosis and expression on endothelial cells. Overall, we demonstrate that SARS-CoV-2-derived S1 is sufficient in itself to propagate inflammatory and thrombogenic processes in the microvasculature, amplified by the complement system, recapitulating the thromboembolic complications of COVID-19.
Keywords: COVID-19; SARS-CoV-2 spike protein 1; complement system; endothelial dysfunction; inflammation; thrombosis.
Copyright © 2022 Perico, Morigi, Galbusera, Pezzotta, Gastoldi, Imberti, Perna, Ruggenenti, Donadelli, Benigni and Remuzzi.
Conflict of interest statement
The authors declare that the research was conducted in the absence of any commercial or financial relationships that could be construed as a potential conflict of interest.
Figures


Similar articles
-
SARS-CoV-2 binds platelet ACE2 to enhance thrombosis in COVID-19.J Hematol Oncol. 2020 Sep 4;13(1):120. doi: 10.1186/s13045-020-00954-7. J Hematol Oncol. 2020. PMID: 32887634 Free PMC article.
-
SARS-CoV-2 Spike Protein Destabilizes Microvascular Homeostasis.Microbiol Spectr. 2021 Dec 22;9(3):e0073521. doi: 10.1128/Spectrum.00735-21. Epub 2021 Dec 22. Microbiol Spectr. 2021. PMID: 34935423 Free PMC article.
-
SARS-CoV-2 Spike Proteins and Cell-Cell Communication Inhibits TFPI and Induces Thrombogenic Factors in Human Lung Microvascular Endothelial Cells and Neutrophils: Implications for COVID-19 Coagulopathy Pathogenesis.Int J Mol Sci. 2022 Sep 9;23(18):10436. doi: 10.3390/ijms231810436. Int J Mol Sci. 2022. PMID: 36142345 Free PMC article.
-
Endothelium Infection and Dysregulation by SARS-CoV-2: Evidence and Caveats in COVID-19.Viruses. 2020 Dec 26;13(1):29. doi: 10.3390/v13010029. Viruses. 2020. PMID: 33375371 Free PMC article. Review.
-
SARS-CoV-2 pandemic and research gaps: Understanding SARS-CoV-2 interaction with the ACE2 receptor and implications for therapy.Theranostics. 2020 Jun 12;10(16):7448-7464. doi: 10.7150/thno.48076. eCollection 2020. Theranostics. 2020. PMID: 32642005 Free PMC article. Review.
Cited by
-
SARS-CoV-2 Spike Protein Induces Hemagglutination: Implications for COVID-19 Morbidities and Therapeutics and for Vaccine Adverse Effects.Int J Mol Sci. 2022 Dec 7;23(24):15480. doi: 10.3390/ijms232415480. Int J Mol Sci. 2022. PMID: 36555121 Free PMC article.
-
Therapeutic Targeting of NF-κB in Acute Lung Injury: A Double-Edged Sword.Cells. 2022 Oct 21;11(20):3317. doi: 10.3390/cells11203317. Cells. 2022. PMID: 36291185 Free PMC article. Review.
-
A Deadly Embrace: Hemagglutination Mediated by SARS-CoV-2 Spike Protein at Its 22 N-Glycosylation Sites, Red Blood Cell Surface Sialoglycoproteins, and Antibody.Int J Mol Sci. 2022 Feb 25;23(5):2558. doi: 10.3390/ijms23052558. Int J Mol Sci. 2022. PMID: 35269703 Free PMC article. Review.
-
Complement and COVID-19: Three years on, what we know, what we don't know, and what we ought to know.Immunobiology. 2023 May;228(3):152393. doi: 10.1016/j.imbio.2023.152393. Epub 2023 May 11. Immunobiology. 2023. PMID: 37187043 Free PMC article. Review.
-
The amplification of CNS damage in Alzheimer's disease due to SARS-CoV2 infection.Ann Diagn Pathol. 2022 Dec;61:152057. doi: 10.1016/j.anndiagpath.2022.152057. Epub 2022 Oct 28. Ann Diagn Pathol. 2022. PMID: 36334414 Free PMC article.
References
-
- COVID-19 Map . Johns Hopkins Coronavirus Resource Centre. Available at: https://coronavirus.jhu.edu/map.html (Accessed January 31, 2022).
-
- Ravindra NG, Alfajaro MM, Gasque V, Huston NC, Wan H, Szigeti-Buck K, et al. . Single-Cell Longitudinal Analysis of SARS-CoV-2 Infection in Human Airway Epithelium Identifies Target Cells, Alterations in Gene Expression, and Cell State Changes. PloS Biol (2021) 19:e3001143. doi: 10.1371/journal.pbio.3001143 - DOI - PMC - PubMed
MeSH terms
Substances
LinkOut - more resources
Full Text Sources
Medical
Research Materials
Miscellaneous

